| Param | Original file | Final file |
|---|---|---|
| Filename | modeM0/AS1A13_071T04_9000006110_45576cztM0_level2.fits | modeM0/AS1A13_071T04_9000006110_45576cztM0_level2_quad_clean.evt |
| Size (bytes) | 559,008,000 | 113,224,320 |
| Size | 533.1 MB | 108.0 MB |
| Events in quadrant A | 6,051,481 | 784,346 |
| Events in quadrant B | 3,620,795 | 802,754 |
| Events in quadrant C | 4,206,218 | 726,277 |
| Events in quadrant D | 6,306,548 | 658,492 |
| Mode M9 | |||
|---|---|---|---|
| Quadrant | BADHDUFLAG | Total packets | Discarded packets |
| A | 0 | 12 | 0 |
| B | 0 | 12 | 0 |
| C | 0 | 12 | 0 |
| D | 0 | 12 | 0 |
| Mode M0 | |||
|---|---|---|---|
| Quadrant | BADHDUFLAG | Total packets | Discarded packets |
| A | 0 | 22169 | 2 |
| B | 0 | 15009 | 2 |
| C | 0 | 17040 | 2 |
| D | 0 | 23373 | 4 |
| Mode SS | |||
|---|---|---|---|
| Quadrant | BADHDUFLAG | Total packets | Discarded packets |
| A | 0 | 132 | 0 |
| B | 0 | 132 | 0 |
| C | 0 | 132 | 0 |
| D | 0 | 132 | 0 |
| Quadrant | Total seconds | Saturated seconds | Saturation percentage |
|---|---|---|---|
| A | 6550 | 276 | 4.213740% |
| B | 6550 | 229 | 3.496183% |
| C | 6550 | 459 | 7.007634% |
| D | 6549 | 737 | 11.253627% |
Noise dominated data is calculated using 1-second bins in cleaned event files. If a bin has >2000 counts, and if more than 50% of those come from <1% of pixels, then it is considered to be noise-dominated and hence unusable.
| Quadrant | # 1 sec bins | Bins with >0 counts | Bins with >2000 counts | High rate bins dominated by noise | Noise dominated (total time) | Noise dominated (detector-on time) | Marked lightcurve |
|---|---|---|---|---|---|---|---|
| A | 7735 | 6551 | 23 | 23 | 0.30% | 0.35% | 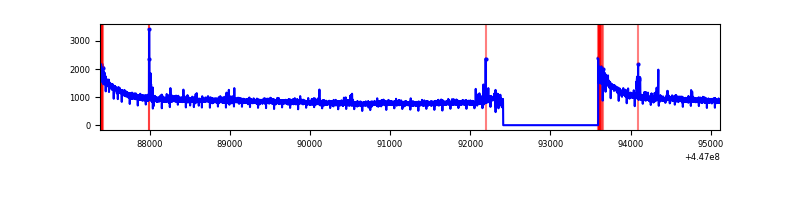 |
| B | 7735 | 6551 | 76 | 76 | 0.98% | 1.16% | 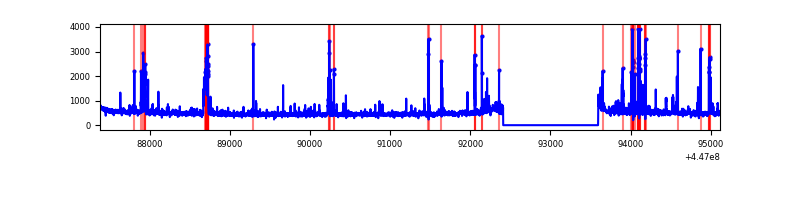 |
| C | 7735 | 6551 | 339 | 339 | 4.38% | 5.17% | 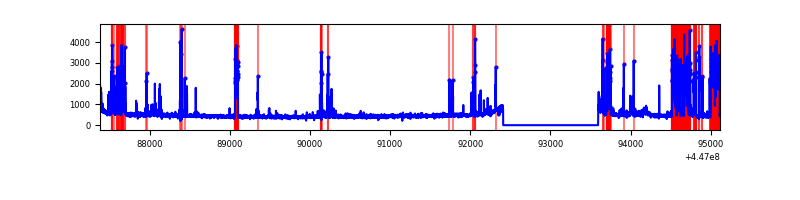 |
| D | 7734 | 6550 | 561 | 561 | 7.25% | 8.56% | 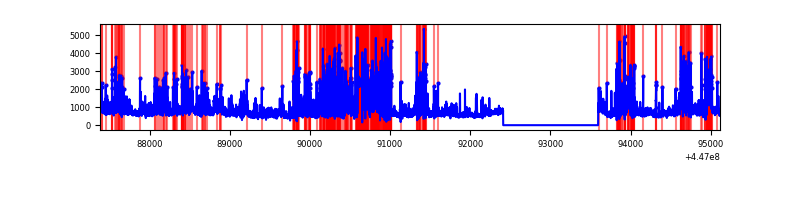 |
Top three noisy pixels from each quadrant. If the there are fewer than three noisy pixels in the level2.evt file, extra rows are filled as -1
| Pixel properties | Quadrant properties | ||||||
|---|---|---|---|---|---|---|---|
| Quadrant | DetID | PixID | Counts | Sigma | Mean | Median | Sigma |
| A | 10 | 83 | 2940132 | 18389.15 | 781 | 765 | 159.8 |
| A | 10 | 248 | 23415 | 141.7 | 781 | 765 | 159.8 |
| A | 7 | 192 | 23056 | 139.46 | 781 | 765 | 159.8 |
| B | 15 | 201 | 165534 | 1100.29 | 773 | 751 | 149.8 |
| B | 0 | 189 | 129055 | 856.71 | 773 | 751 | 149.8 |
| B | 5 | 172 | 123988 | 822.88 | 773 | 751 | 149.8 |
| C | 12 | 2 | 1049240 | 6094.58 | 741 | 745 | 172.0 |
| C | 14 | 254 | 245174 | 1420.79 | 741 | 745 | 172.0 |
| C | 2 | 14 | 15140 | 83.67 | 741 | 745 | 172.0 |
| D | 1 | 52 | 2028374 | 11207.7 | 725 | 702 | 180.9 |
| D | 11 | 241 | 627295 | 3463.41 | 725 | 702 | 180.9 |
| D | 11 | 224 | 327781 | 1807.89 | 725 | 702 | 180.9 |
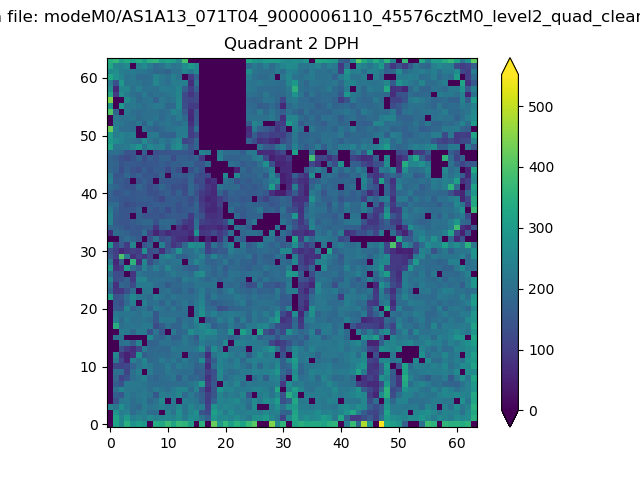
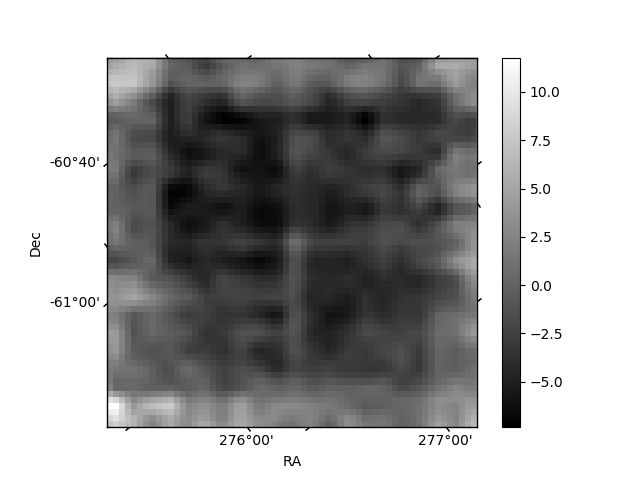
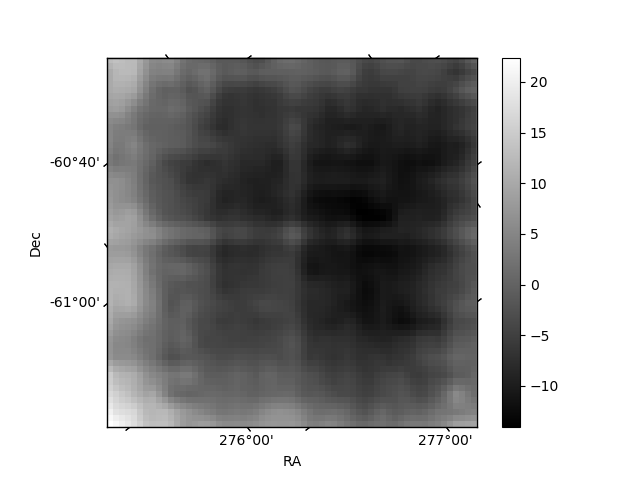
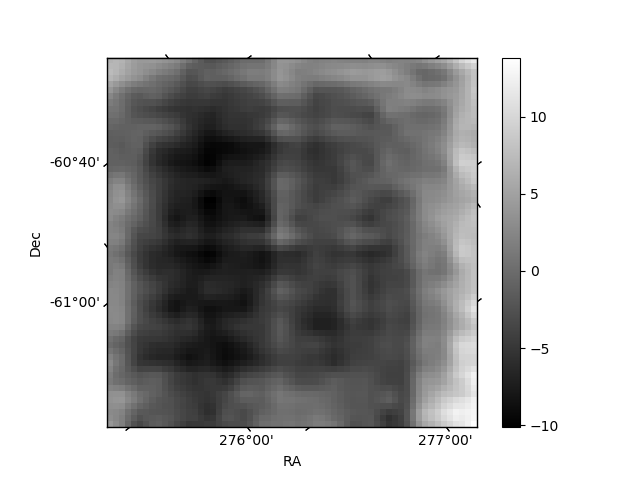
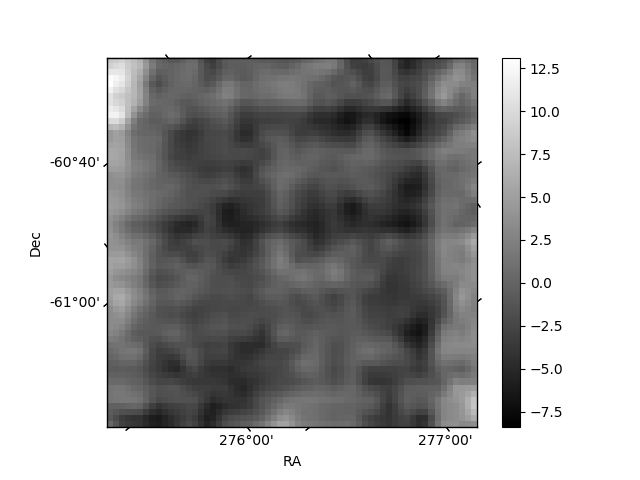
Histogram calculated using DETX and DETY for each event in the final _common_clean file
| Quadrant A |  |
 |
Quadrant B |
|---|---|---|---|
| Quadrant D | 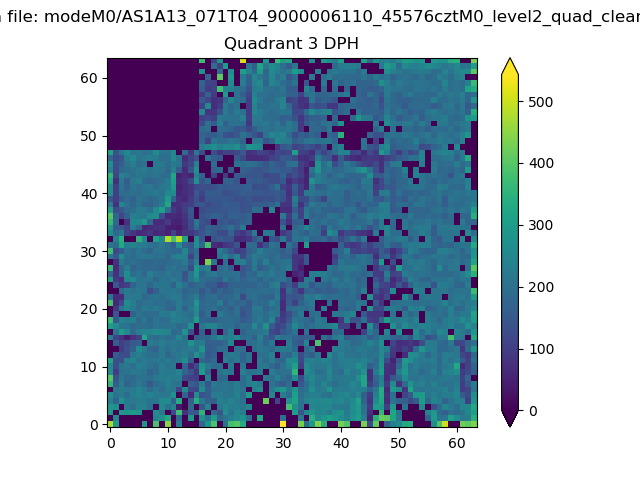 |
 |
Quadrant C |
| Plot type | Count rate plots | Images |
|---|---|---|
| Comparison with Poisson distribution Blue bars denote a histogram of data divided into 1 sec bins. Red curve is a Poisson curve with rate = median count rate of data. |
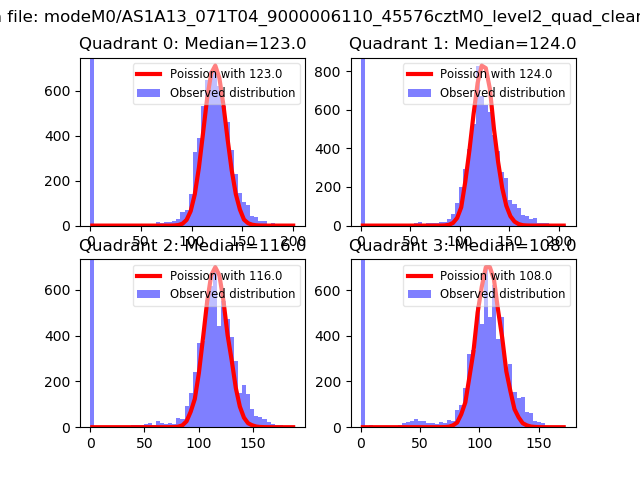 |
 |
| Quadrant-wise count rates Data is divided into 100 sec bins |
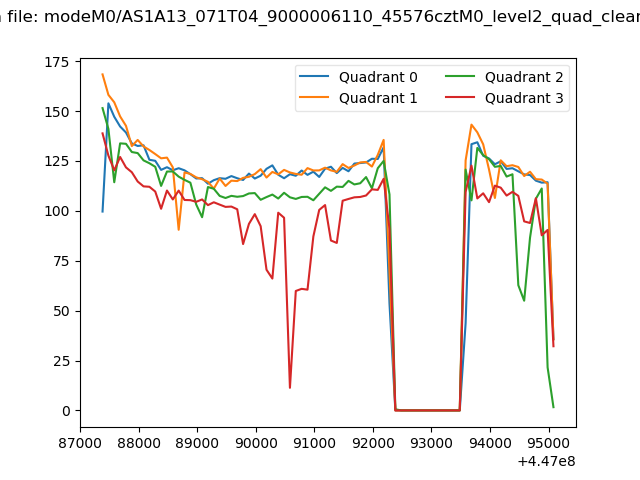 |
|
| Module-wise count rates for Quadrant A Data is divided into 100 sec bins |
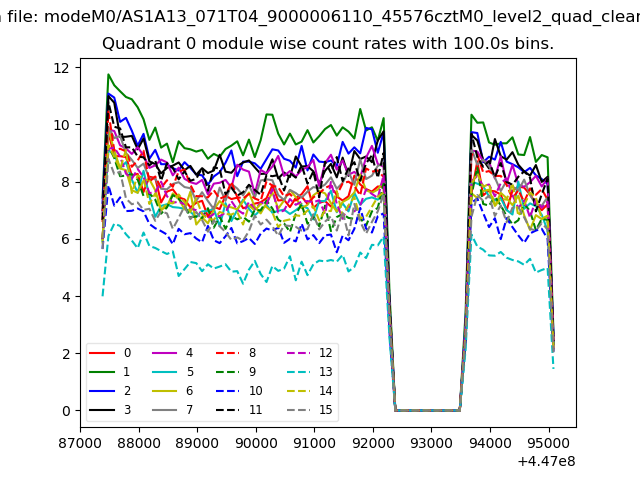 |
 |
| Module-wise count rates for Quadrant B Data is divided into 100 sec bins |
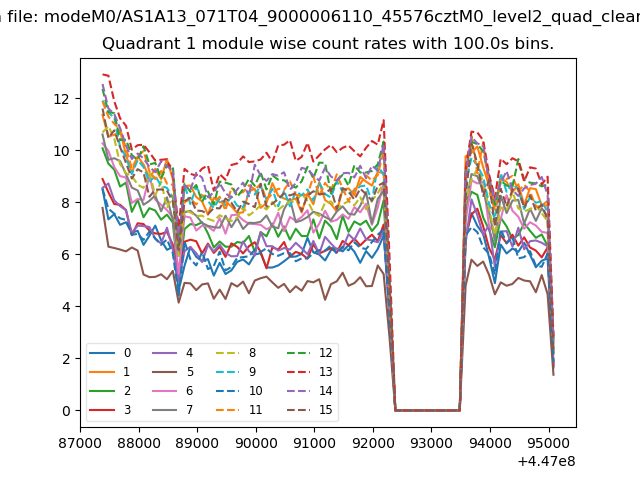 |
 |
| Module-wise count rates for Quadrant C Data is divided into 100 sec bins |
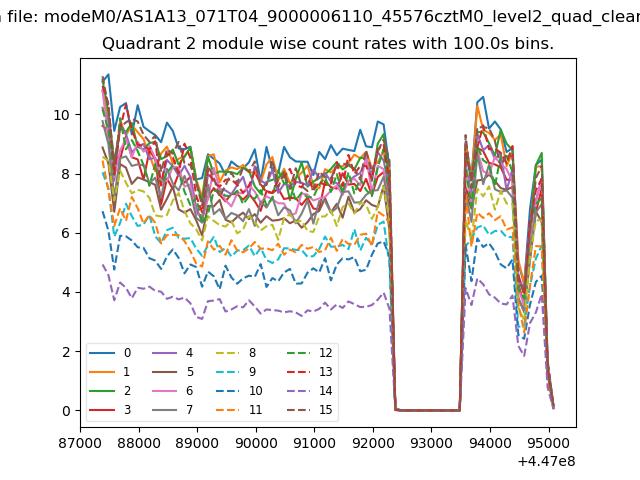 |
 |
| Module-wise count rates for Quadrant D Data is divided into 100 sec bins |
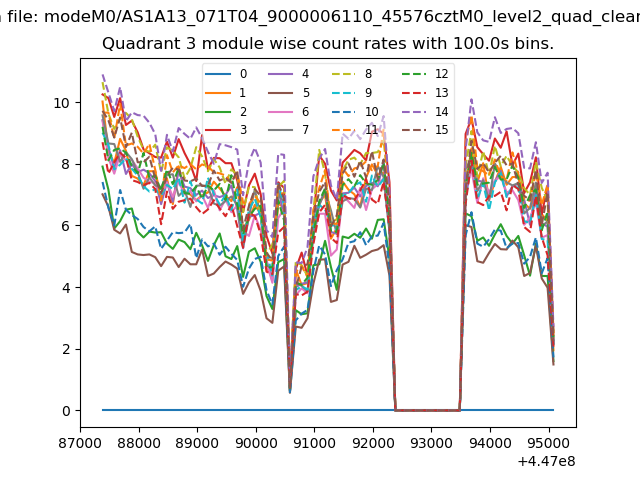 |
 |
| Parameter | Plot |
|---|---|
| CZT HV Monitor | 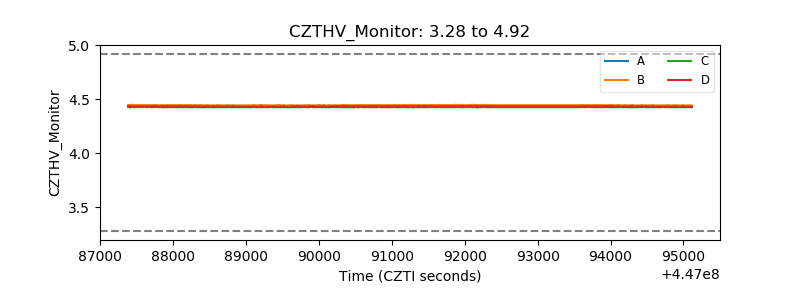 |
| D_VDD | 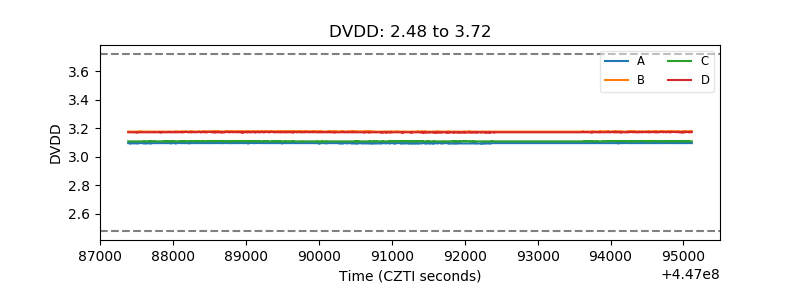 |
| Temperature 1 | 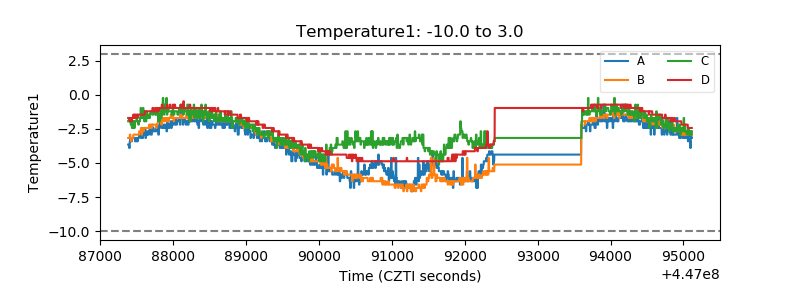 |
| Veto HV Monitor | 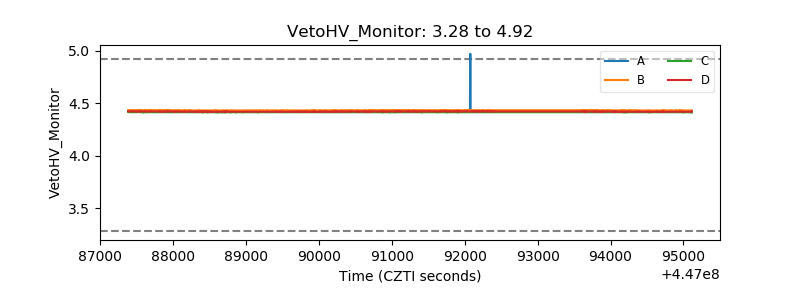 |
| Veto LLD | 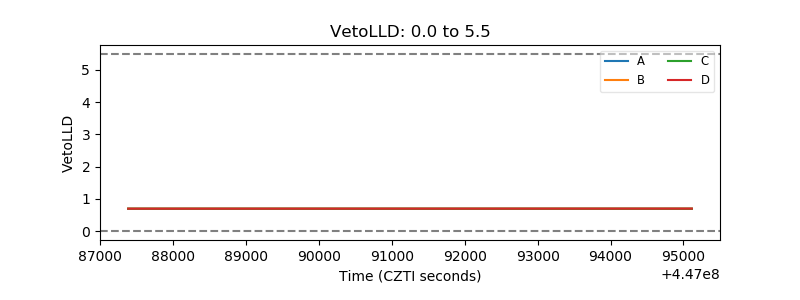 |
| Alpha Counter | 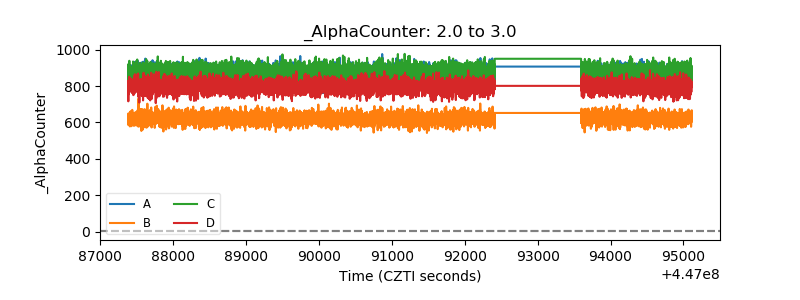 |
| _CPM_Rate | 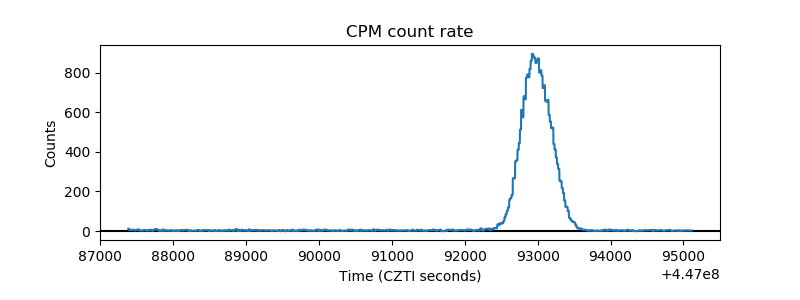 |
| CZT Counter | 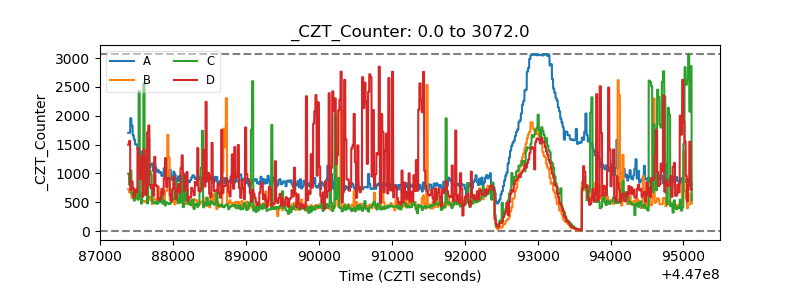 |
| +2.5 Volts monitor | 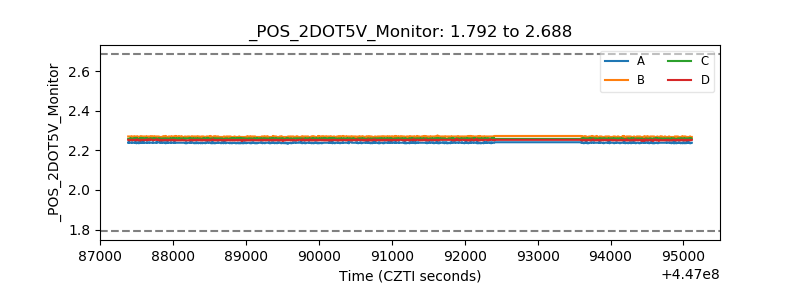 |
| +5 Volts monitor | 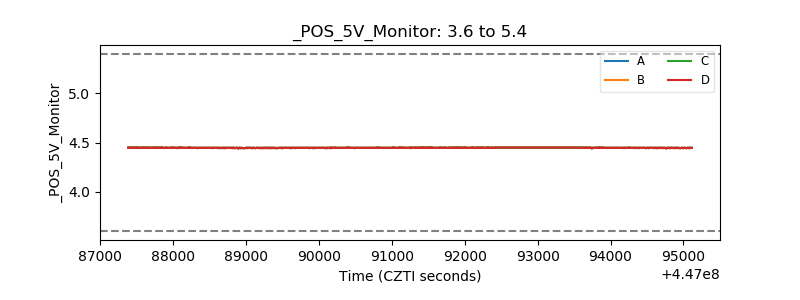 |
| _ROLL_ROT | 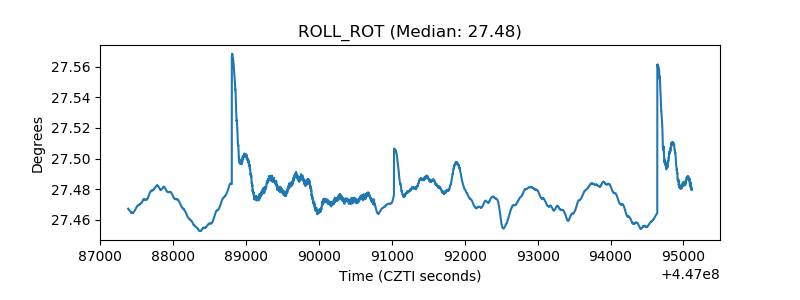 |
| _Roll_DEC | 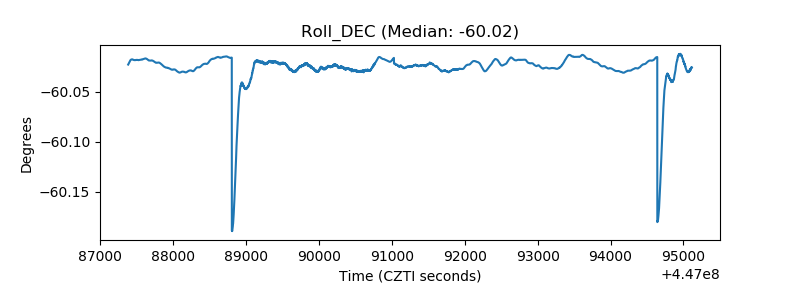 |
| _Roll_RA | 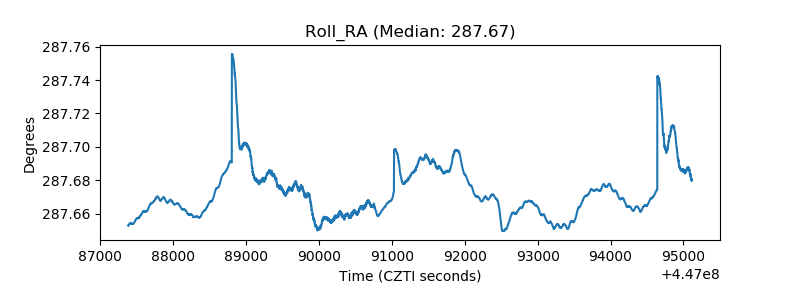 |
| Veto Counter | 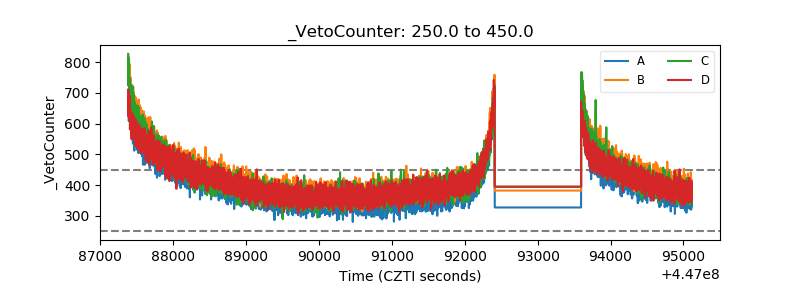 |