| Param | Original file | Final file |
|---|---|---|
| Filename | modeM0/AS1A13_071T04_9000006110_45577cztM0_level2.fits | modeM0/AS1A13_071T04_9000006110_45577cztM0_level2_quad_clean.evt |
| Size (bytes) | 475,776,000 | 103,726,080 |
| Size | 453.7 MB | 98.9 MB |
| Events in quadrant A | 5,455,294 | 706,438 |
| Events in quadrant B | 3,189,951 | 723,998 |
| Events in quadrant C | 3,851,177 | 653,438 |
| Events in quadrant D | 4,636,911 | 626,457 |
| Mode M9 | |||
|---|---|---|---|
| Quadrant | BADHDUFLAG | Total packets | Discarded packets |
| A | 0 | 11 | 0 |
| B | 0 | 11 | 0 |
| C | 0 | 11 | 0 |
| D | 0 | 11 | 0 |
| Mode M0 | |||
|---|---|---|---|
| Quadrant | BADHDUFLAG | Total packets | Discarded packets |
| A | 0 | 20271 | 1 |
| B | 0 | 13594 | 1 |
| C | 0 | 15819 | 1 |
| D | 0 | 18073 | 1 |
| Mode SS | |||
|---|---|---|---|
| Quadrant | BADHDUFLAG | Total packets | Discarded packets |
| A | 0 | 126 | 0 |
| B | 0 | 126 | 0 |
| C | 0 | 126 | 0 |
| D | 0 | 126 | 0 |
| Quadrant | Total seconds | Saturated seconds | Saturation percentage |
|---|---|---|---|
| A | 6164 | 196 | 3.179753% |
| B | 6164 | 144 | 2.336145% |
| C | 6164 | 427 | 6.927320% |
| D | 6164 | 242 | 3.926022% |
Noise dominated data is calculated using 1-second bins in cleaned event files. If a bin has >2000 counts, and if more than 50% of those come from <1% of pixels, then it is considered to be noise-dominated and hence unusable.
| Quadrant | # 1 sec bins | Bins with >0 counts | Bins with >2000 counts | High rate bins dominated by noise | Noise dominated (total time) | Noise dominated (detector-on time) | Marked lightcurve |
|---|---|---|---|---|---|---|---|
| A | 7284 | 6165 | 7 | 7 | 0.10% | 0.11% | 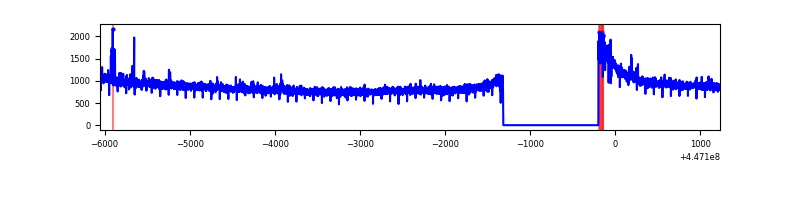 |
| B | 7284 | 6165 | 43 | 43 | 0.59% | 0.70% | 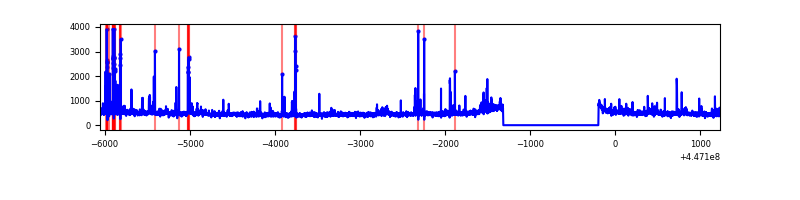 |
| C | 7284 | 6165 | 365 | 365 | 5.01% | 5.92% | 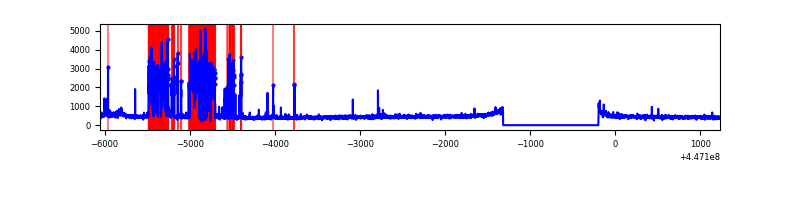 |
| D | 7284 | 6165 | 152 | 152 | 2.09% | 2.47% | 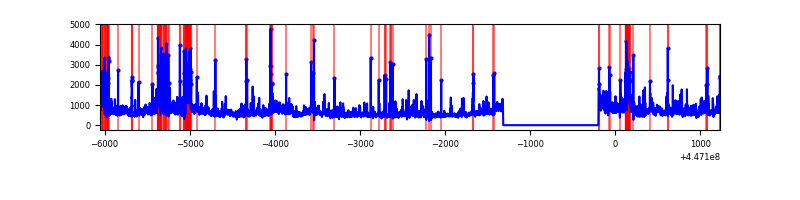 |
Top three noisy pixels from each quadrant. If the there are fewer than three noisy pixels in the level2.evt file, extra rows are filled as -1
| Pixel properties | Quadrant properties | ||||||
|---|---|---|---|---|---|---|---|
| Quadrant | DetID | PixID | Counts | Sigma | Mean | Median | Sigma |
| A | 10 | 83 | 2645931 | 18195.24 | 707 | 691 | 145.4 |
| A | 0 | 243 | 34561 | 232.97 | 707 | 691 | 145.4 |
| A | 7 | 192 | 20031 | 133.03 | 707 | 691 | 145.4 |
| B | 0 | 189 | 106886 | 786.11 | 703 | 683 | 135.1 |
| B | 5 | 172 | 76238 | 559.25 | 703 | 683 | 135.1 |
| B | 15 | 201 | 75567 | 554.29 | 703 | 683 | 135.1 |
| C | 12 | 2 | 1203240 | 7661.79 | 670 | 674 | 157.0 |
| C | 2 | 14 | 20522 | 126.45 | 670 | 674 | 157.0 |
| C | 14 | 254 | 11083 | 66.31 | 670 | 674 | 157.0 |
| D | 11 | 241 | 678429 | 3940.88 | 685 | 662 | 172.0 |
| D | 1 | 52 | 459901 | 2670.25 | 685 | 662 | 172.0 |
| D | 11 | 224 | 266295 | 1544.53 | 685 | 662 | 172.0 |
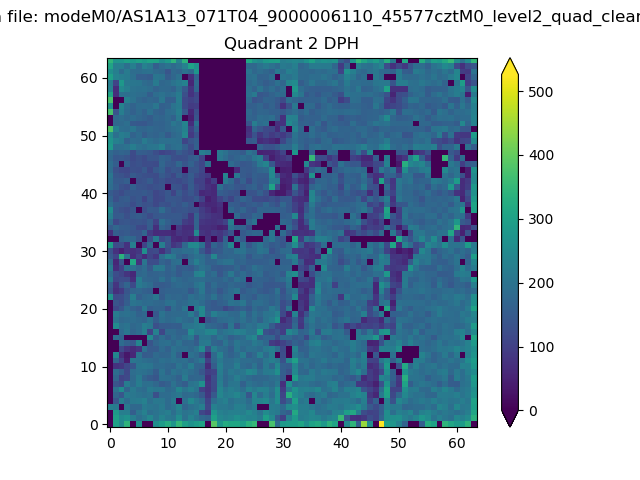
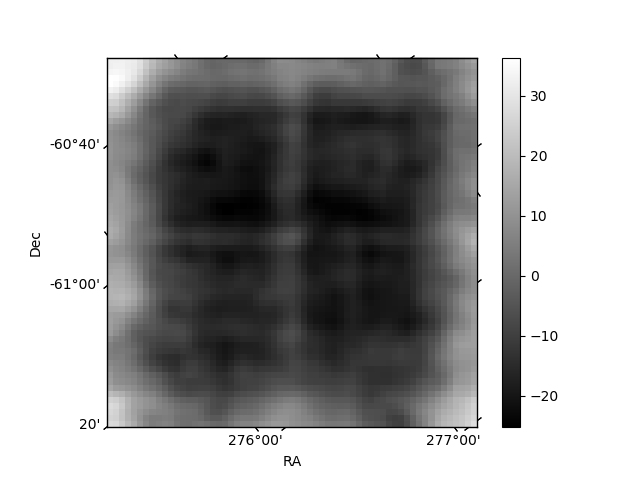
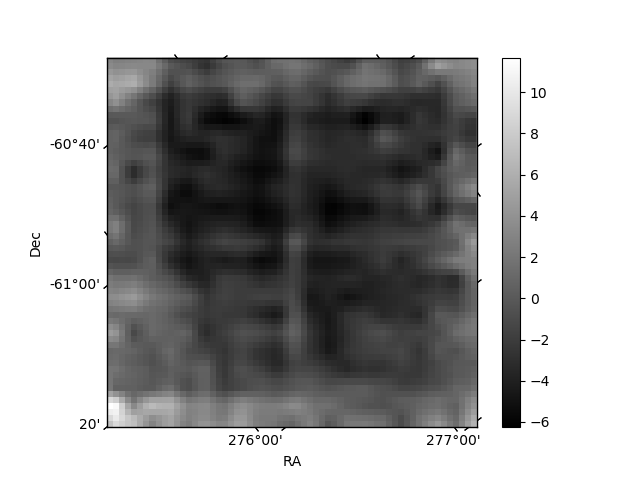
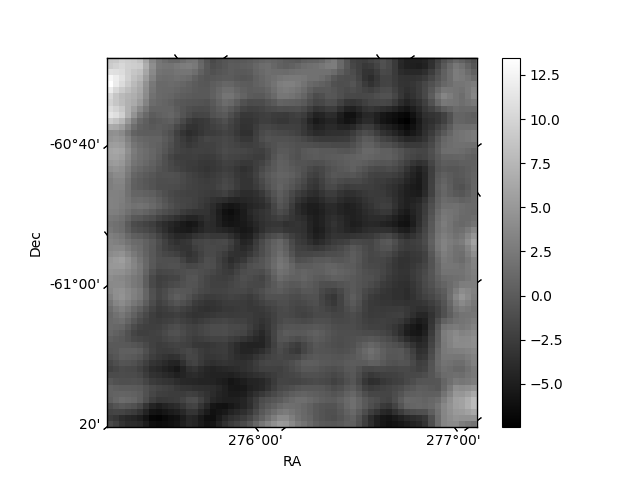
Histogram calculated using DETX and DETY for each event in the final _common_clean file
| Quadrant A | 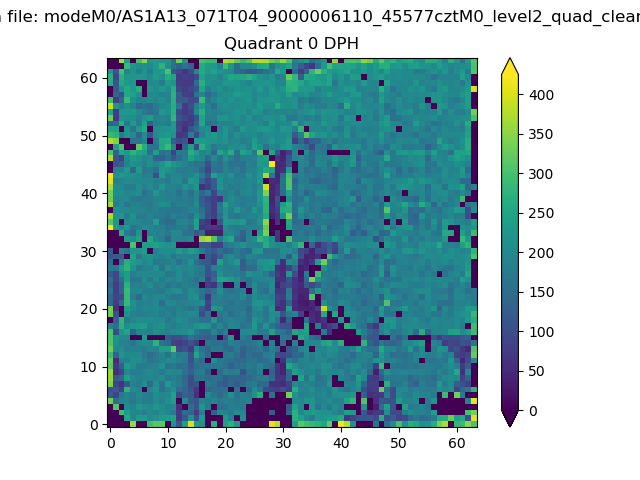 |
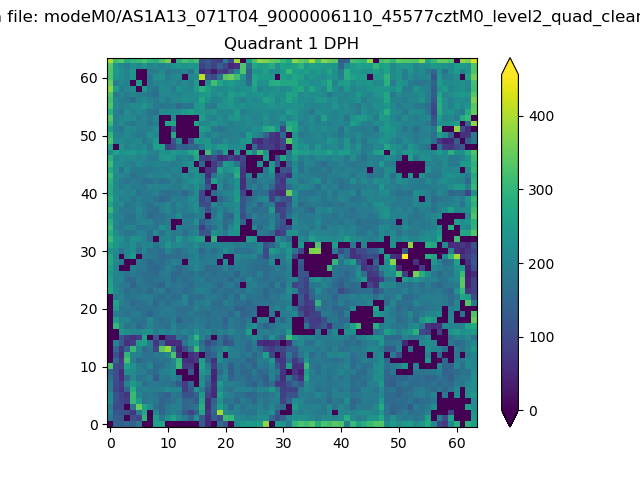 |
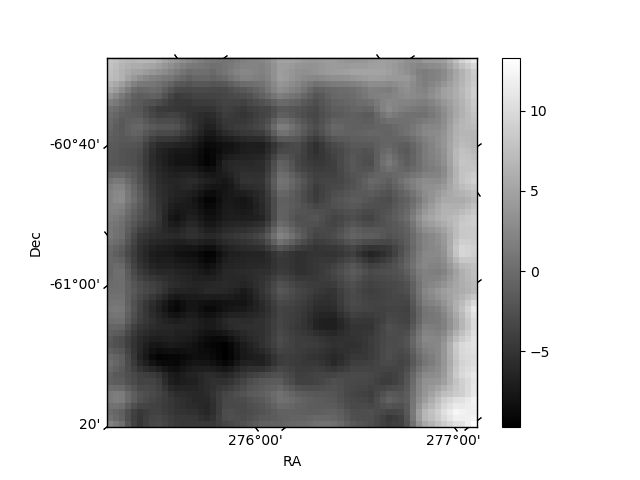
Quadrant B |
|---|---|---|---|
| Quadrant D | 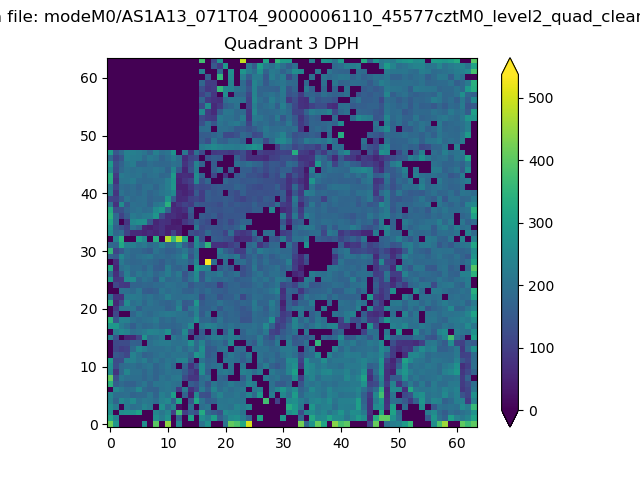 |
 |
Quadrant C |
| Plot type | Count rate plots | Images |
|---|---|---|
| Comparison with Poisson distribution Blue bars denote a histogram of data divided into 1 sec bins. Red curve is a Poisson curve with rate = median count rate of data. |
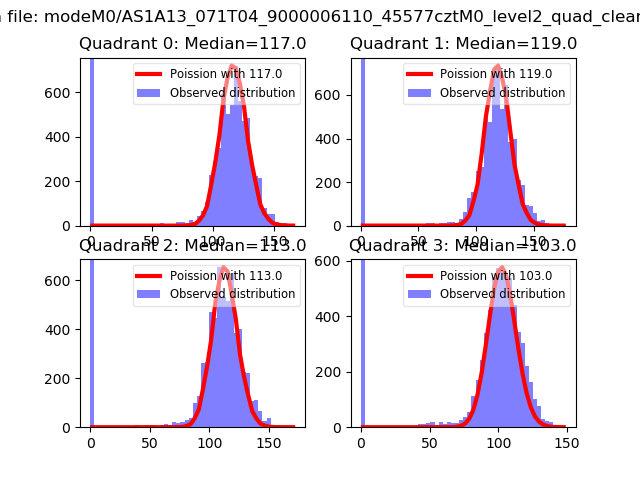 |
 |
| Quadrant-wise count rates Data is divided into 100 sec bins |
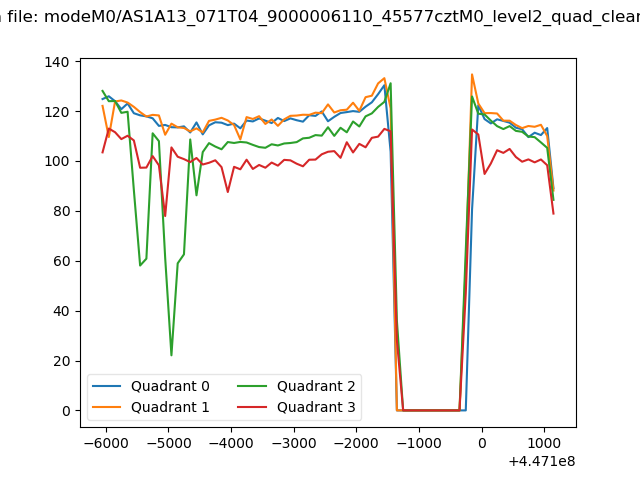 |
|
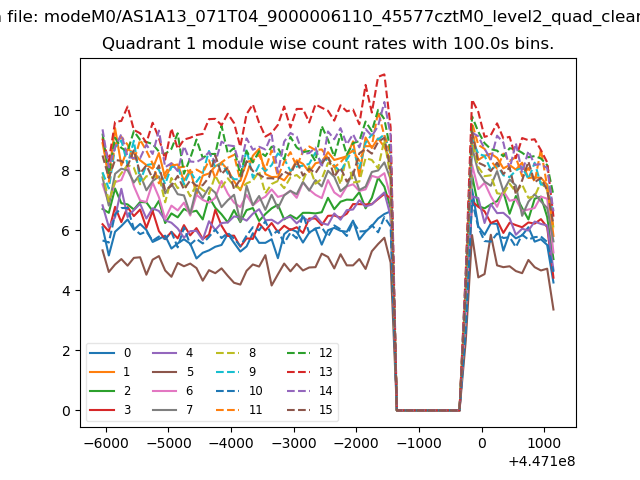
| Module-wise count rates for Quadrant A Data is divided into 100 sec bins |
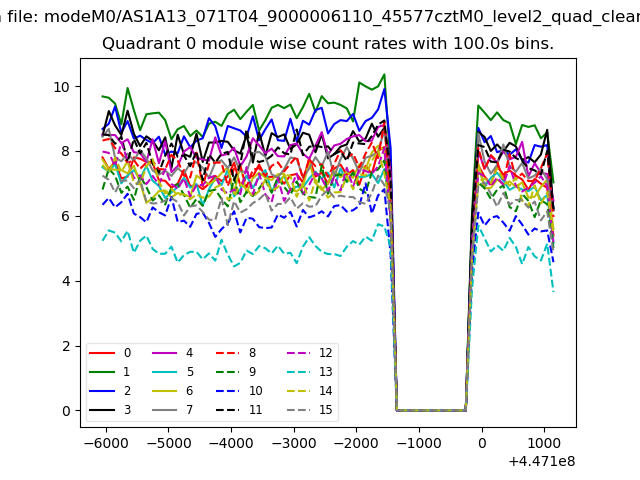 |
 |
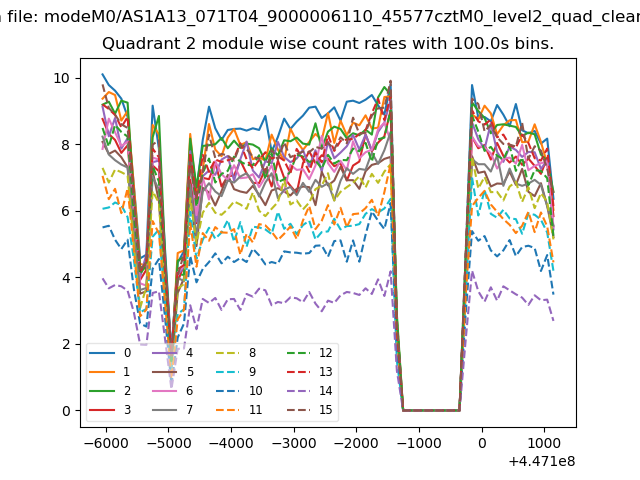
| Module-wise count rates for Quadrant B Data is divided into 100 sec bins |
 |
 |
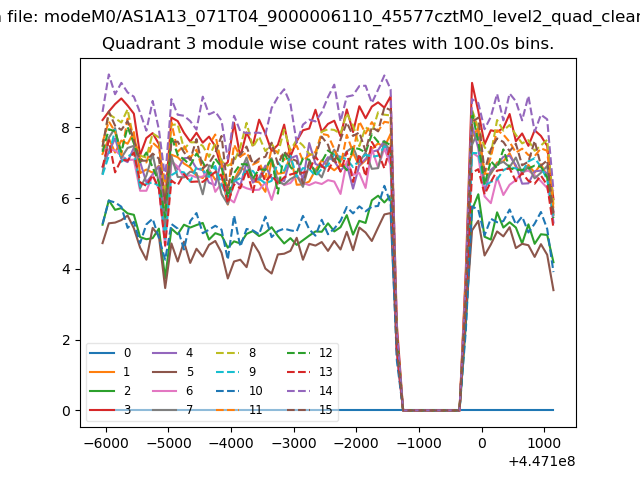
| Module-wise count rates for Quadrant C Data is divided into 100 sec bins |
 |
 |
| Module-wise count rates for Quadrant D Data is divided into 100 sec bins |
 |
 |
| Parameter | Plot |
|---|---|
| CZT HV Monitor | 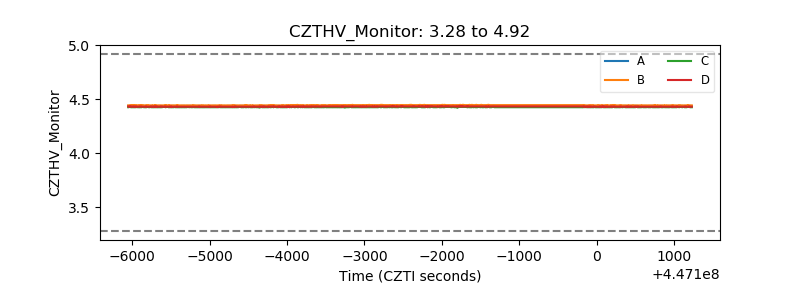 |
| D_VDD | 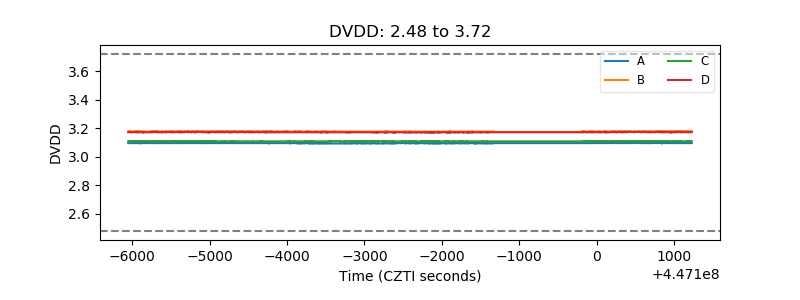 |
| Temperature 1 | 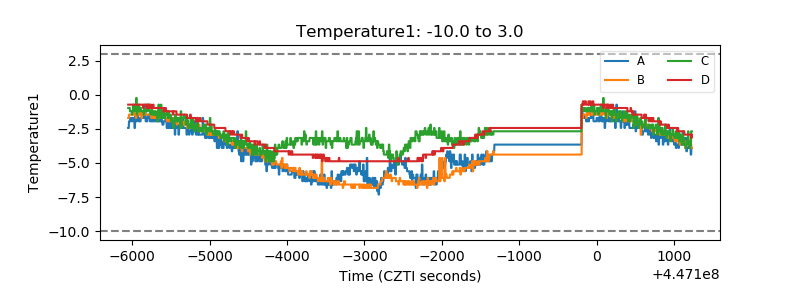 |
| Veto HV Monitor | 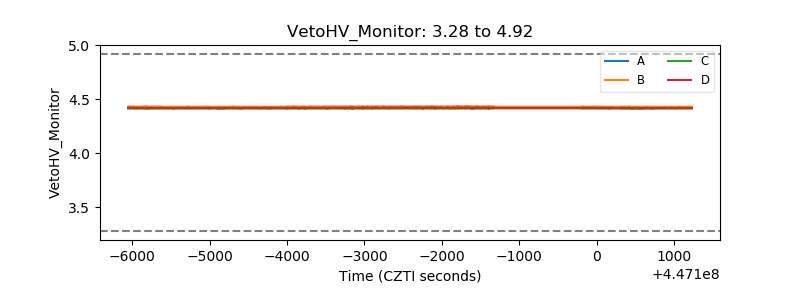 |
| Veto LLD | 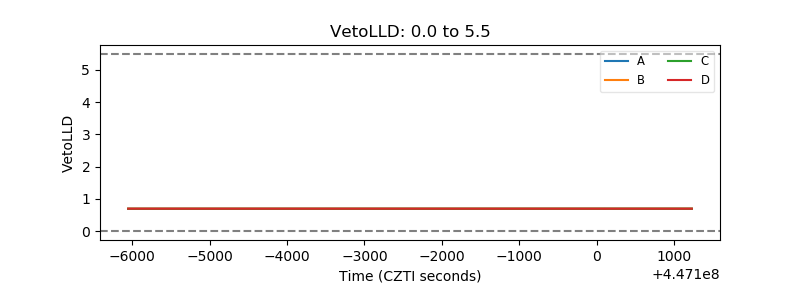 |
| Alpha Counter | 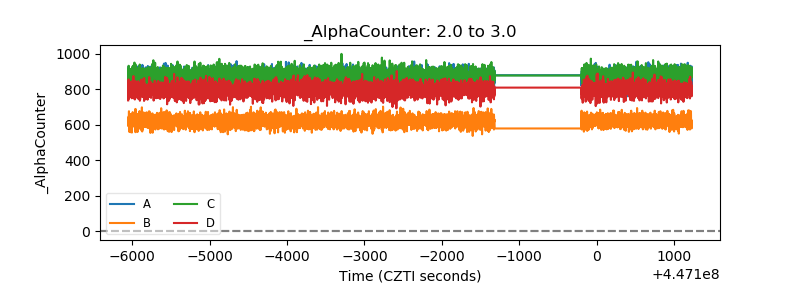 |
| _CPM_Rate | 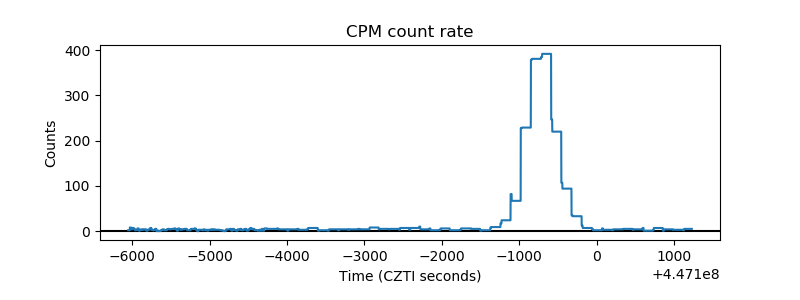 |
| CZT Counter | 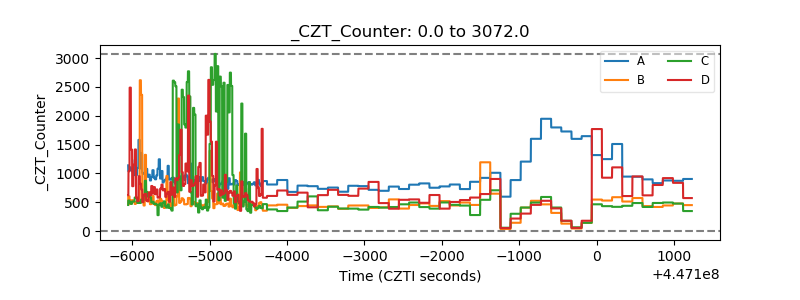 |
| +2.5 Volts monitor | 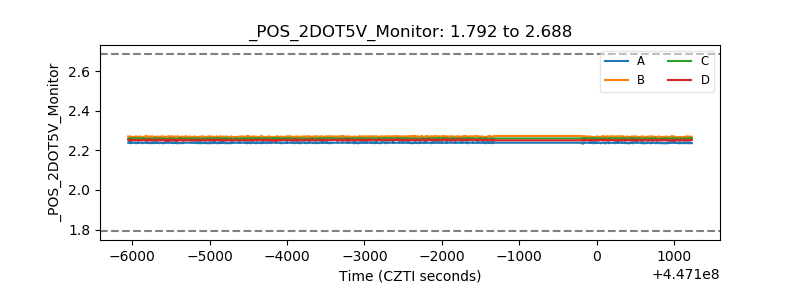 |
| +5 Volts monitor | 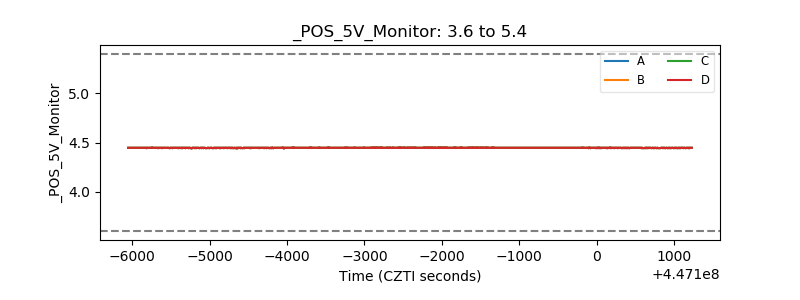 |
| _ROLL_ROT | 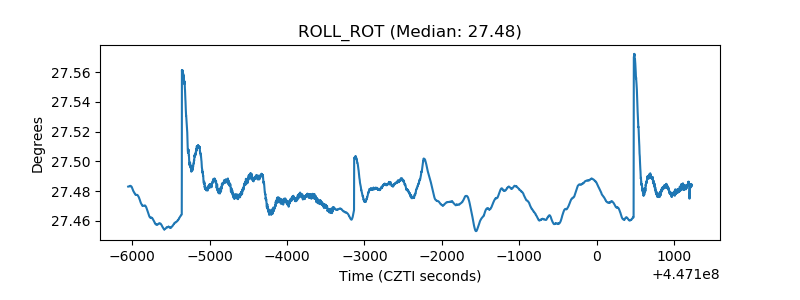 |
| _Roll_DEC | 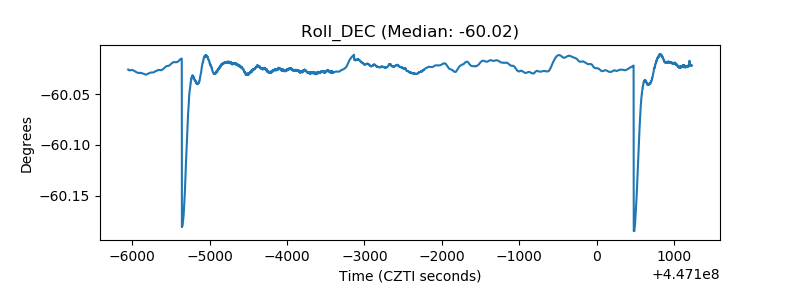 |
| _Roll_RA | 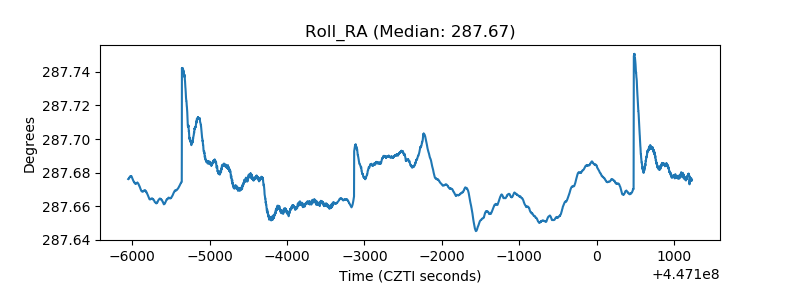 |
| Veto Counter | 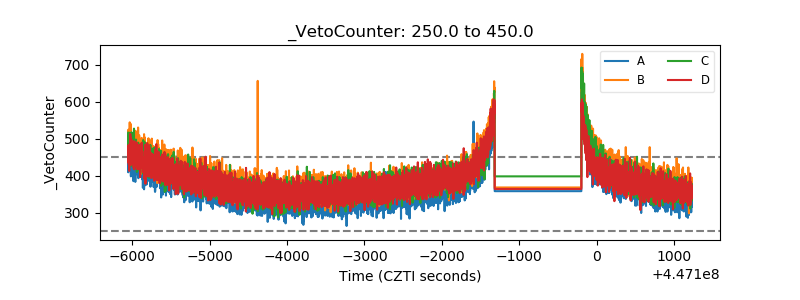 |