| Param | Original file | Final file |
|---|---|---|
| Filename | modeM0/AS1A13_071T04_9000006110_45589cztM0_level2.fits | modeM0/AS1A13_071T04_9000006110_45589cztM0_level2_quad_clean.evt |
| Size (bytes) | 456,747,840 | 108,970,560 |
| Size | 435.6 MB | 103.9 MB |
| Events in quadrant A | 5,442,383 | 736,949 |
| Events in quadrant B | 3,339,741 | 753,724 |
| Events in quadrant C | 2,935,992 | 723,353 |
| Events in quadrant D | 4,713,290 | 657,275 |
| Mode M9 | |||
|---|---|---|---|
| Quadrant | BADHDUFLAG | Total packets | Discarded packets |
| A | 0 | 11 | 0 |
| B | 0 | 11 | 0 |
| C | 0 | 11 | 0 |
| D | 0 | 11 | 0 |
| Mode M0 | |||
|---|---|---|---|
| Quadrant | BADHDUFLAG | Total packets | Discarded packets |
| A | 0 | 19787 | 4 |
| B | 0 | 13885 | 2 |
| C | 0 | 13042 | 10 |
| D | 0 | 18157 | 2 |
| Mode SS | |||
|---|---|---|---|
| Quadrant | BADHDUFLAG | Total packets | Discarded packets |
| A | 0 | 126 | 0 |
| B | 0 | 126 | 0 |
| C | 0 | 126 | 0 |
| D | 0 | 126 | 0 |
| Quadrant | Total seconds | Saturated seconds | Saturation percentage |
|---|---|---|---|
| A | 6131 | 164 | 2.674931% |
| B | 6132 | 180 | 2.935421% |
| C | 6128 | 60 | 0.979112% |
| D | 6132 | 209 | 3.408350% |
Noise dominated data is calculated using 1-second bins in cleaned event files. If a bin has >2000 counts, and if more than 50% of those come from <1% of pixels, then it is considered to be noise-dominated and hence unusable.
| Quadrant | # 1 sec bins | Bins with >0 counts | Bins with >2000 counts | High rate bins dominated by noise | Noise dominated (total time) | Noise dominated (detector-on time) | Marked lightcurve |
|---|---|---|---|---|---|---|---|
| A | 7316 | 6133 | 2 | 2 | 0.03% | 0.03% | 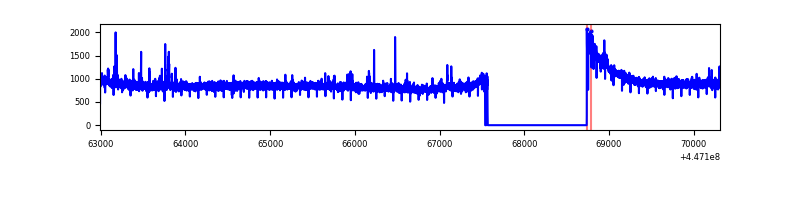 |
| B | 7317 | 6134 | 75 | 75 | 1.03% | 1.22% | 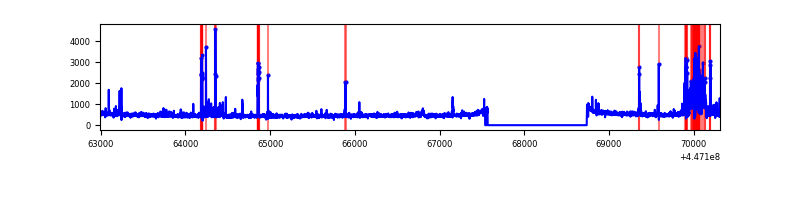 |
| C | 7317 | 6131 | 33 | 33 | 0.45% | 0.54% | 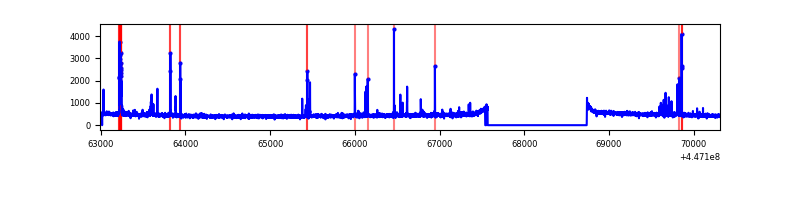 |
| D | 7317 | 6134 | 156 | 156 | 2.13% | 2.54% | 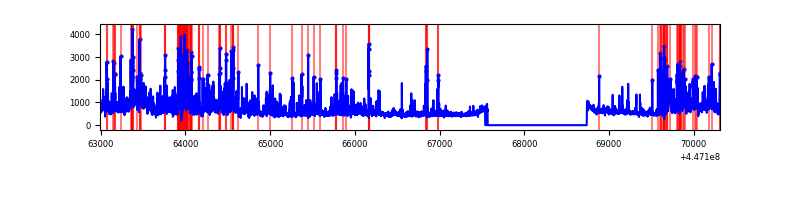 |
Top three noisy pixels from each quadrant. If the there are fewer than three noisy pixels in the level2.evt file, extra rows are filled as -1
| Pixel properties | Quadrant properties | ||||||
|---|---|---|---|---|---|---|---|
| Quadrant | DetID | PixID | Counts | Sigma | Mean | Median | Sigma |
| A | 10 | 83 | 2554598 | 17235.01 | 726 | 711 | 148.2 |
| A | 0 | 243 | 43288 | 287.33 | 726 | 711 | 148.2 |
| A | 2 | 79 | 27931 | 183.7 | 726 | 711 | 148.2 |
| B | 15 | 201 | 256805 | 1864.64 | 716 | 697 | 137.3 |
| B | 5 | 172 | 84424 | 609.59 | 716 | 697 | 137.3 |
| B | 5 | 171 | 38367 | 274.26 | 716 | 697 | 137.3 |
| C | 14 | 254 | 183401 | 1111.68 | 703 | 707 | 164.3 |
| C | 12 | 2 | 10400 | 58.98 | 703 | 707 | 164.3 |
| C | 13 | 61 | 4772 | 24.74 | 703 | 707 | 164.3 |
| D | 1 | 52 | 889768 | 5074.66 | 704 | 682 | 175.2 |
| D | 2 | 249 | 590935 | 3369.01 | 704 | 682 | 175.2 |
| D | 11 | 241 | 325207 | 1852.3 | 704 | 682 | 175.2 |
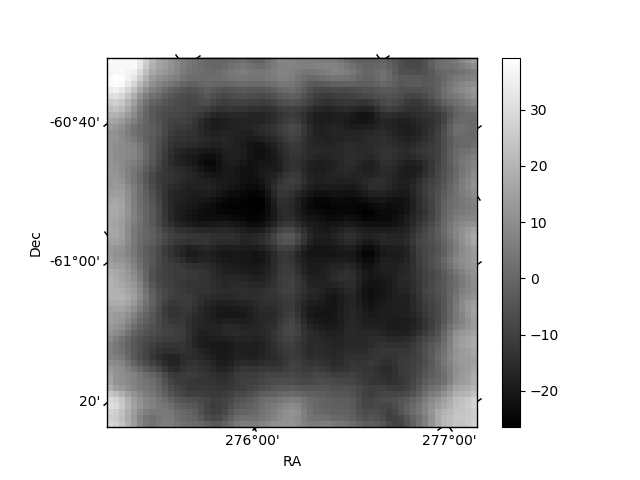
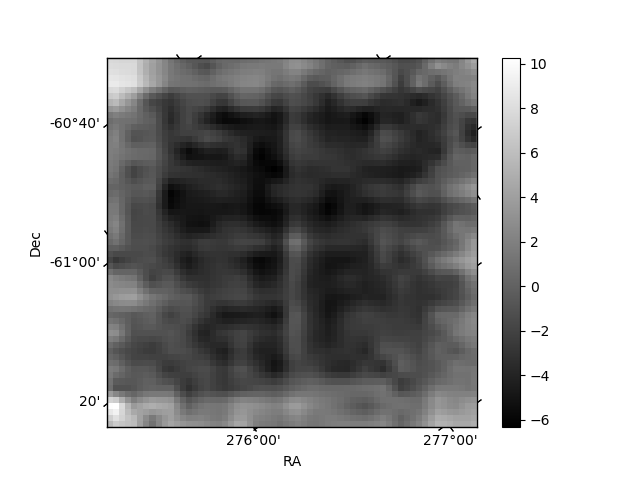
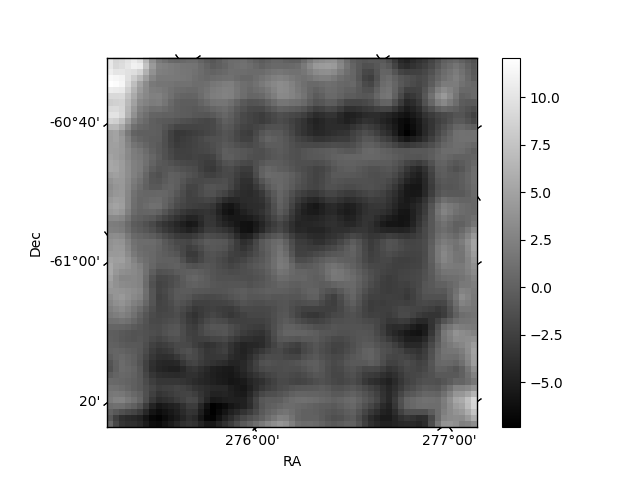
Histogram calculated using DETX and DETY for each event in the final _common_clean file
| Quadrant A | 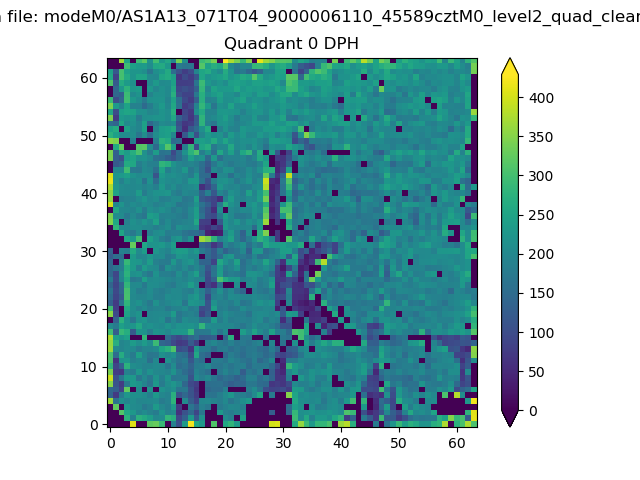 |
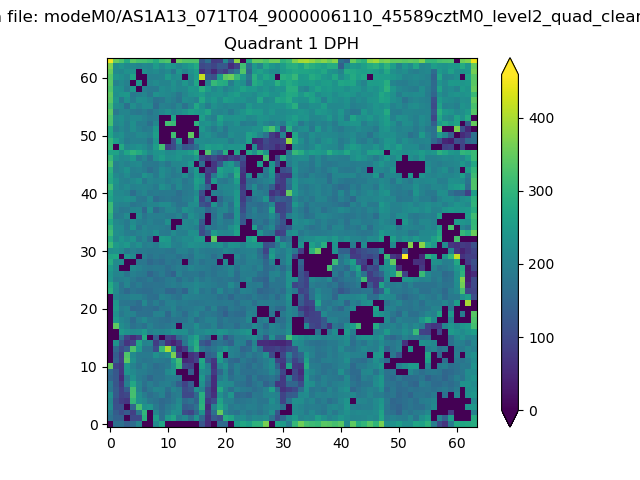 |
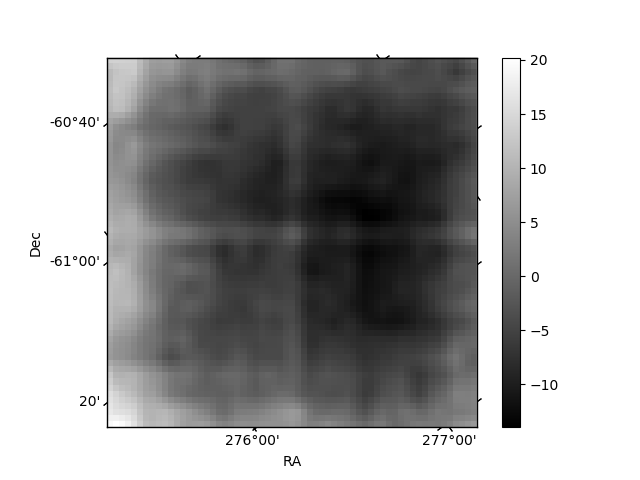
Quadrant B |
|---|---|---|---|
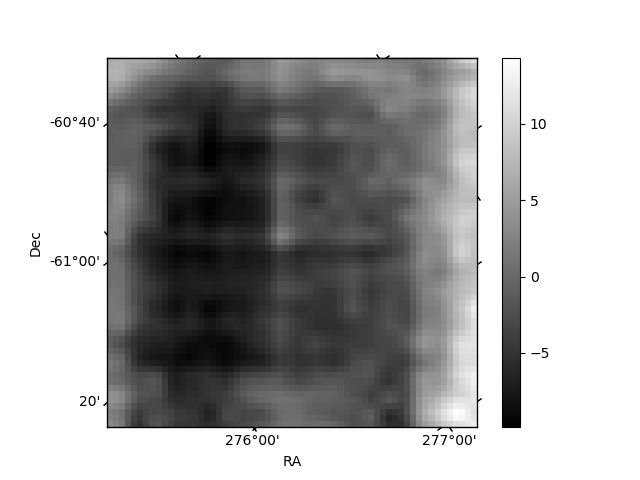
| Quadrant D | 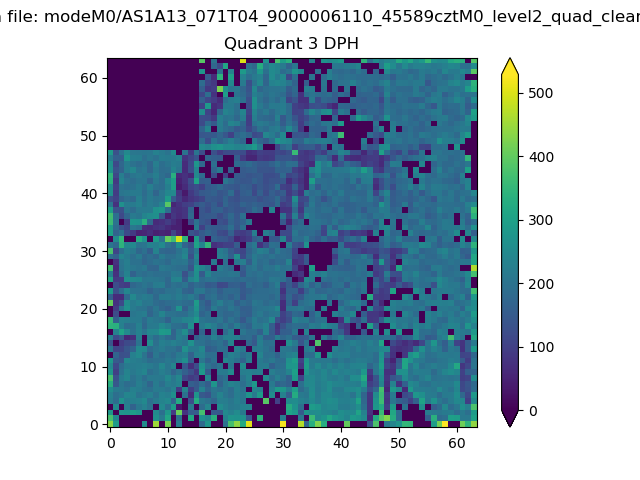 |
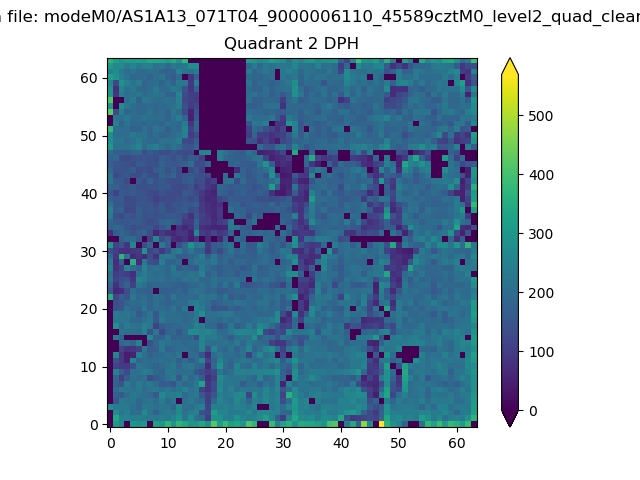 |
Quadrant C |
| Plot type | Count rate plots | Images |
|---|---|---|
| Comparison with Poisson distribution Blue bars denote a histogram of data divided into 1 sec bins. Red curve is a Poisson curve with rate = median count rate of data. |
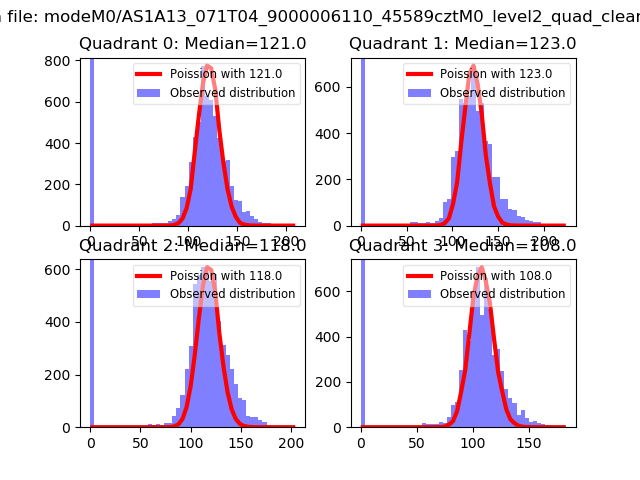 |
 |
| Quadrant-wise count rates Data is divided into 100 sec bins |
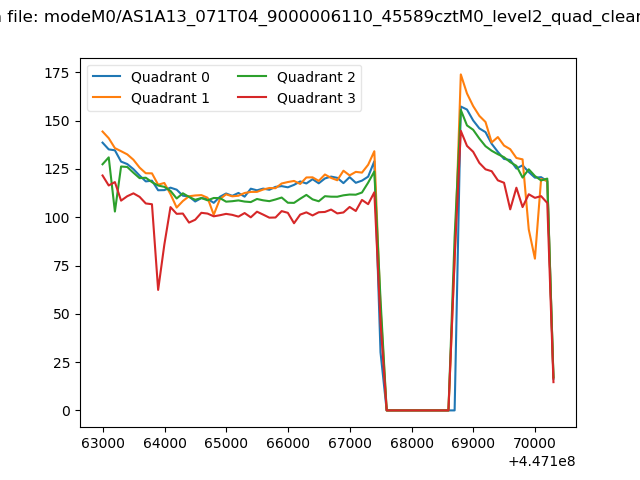 |
|
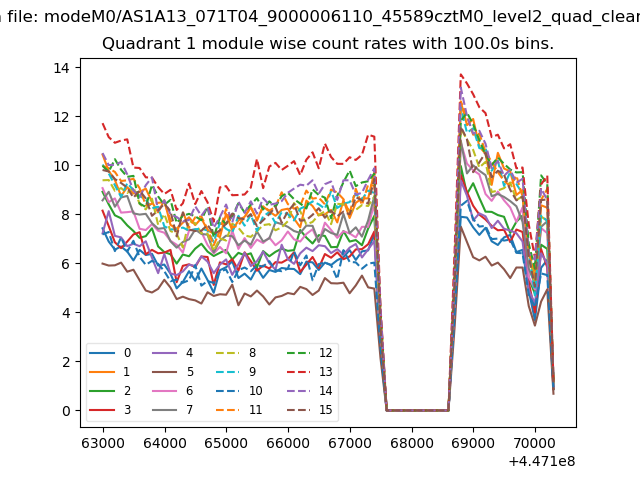
| Module-wise count rates for Quadrant A Data is divided into 100 sec bins |
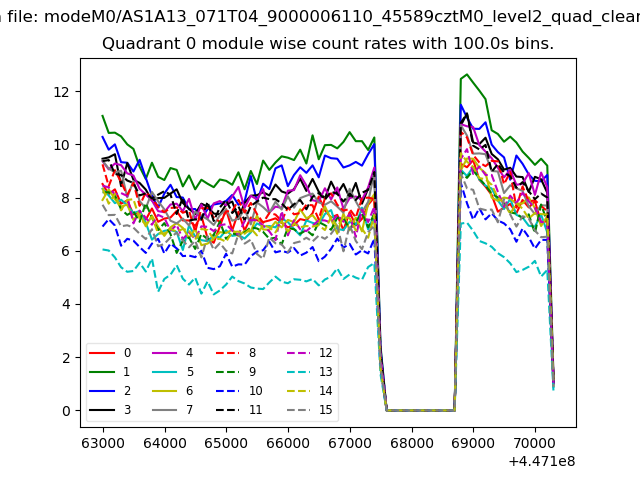 |
 |
| Module-wise count rates for Quadrant B Data is divided into 100 sec bins |
 |
 |
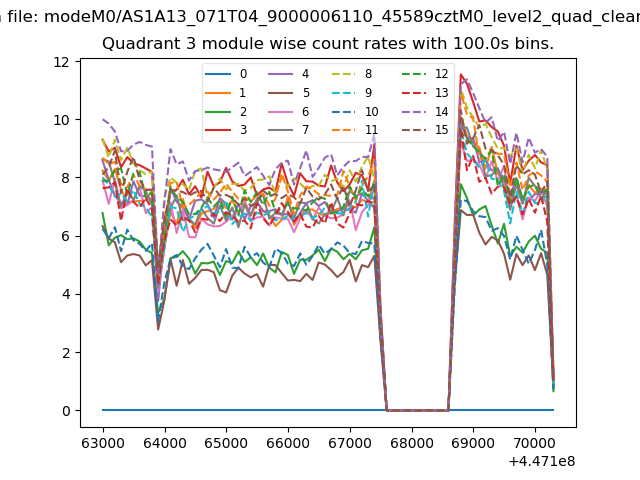
| Module-wise count rates for Quadrant C Data is divided into 100 sec bins |
 |
 |
| Module-wise count rates for Quadrant D Data is divided into 100 sec bins |
 |
 |
| Parameter | Plot |
|---|---|
| CZT HV Monitor | 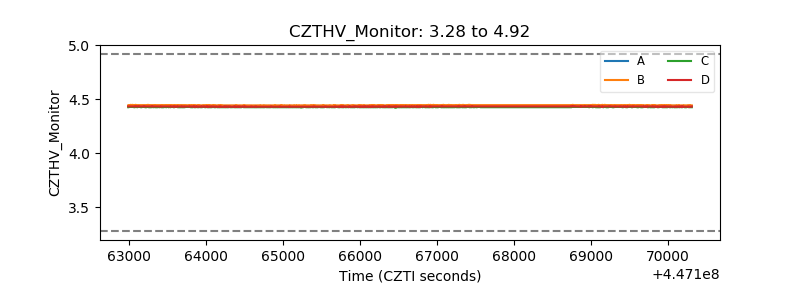 |
| D_VDD | 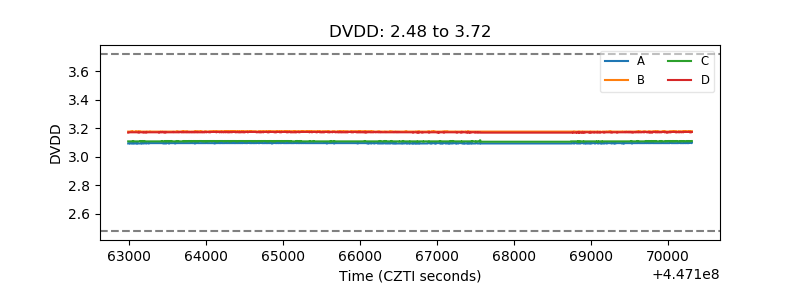 |
| Temperature 1 | 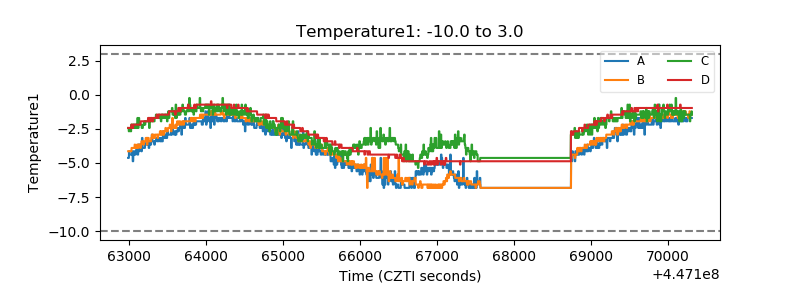 |
| Veto HV Monitor | 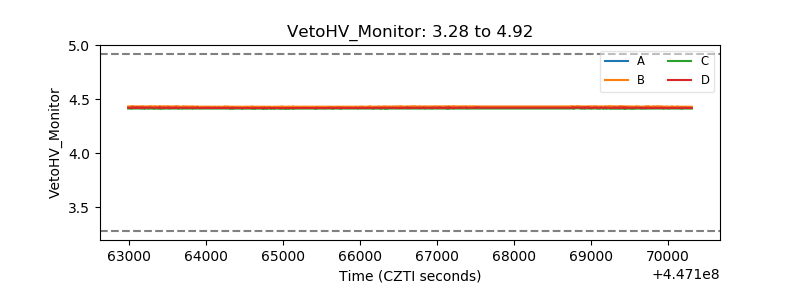 |
| Veto LLD | 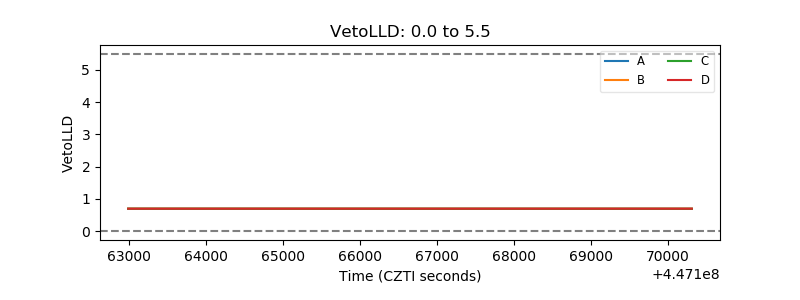 |
| Alpha Counter | 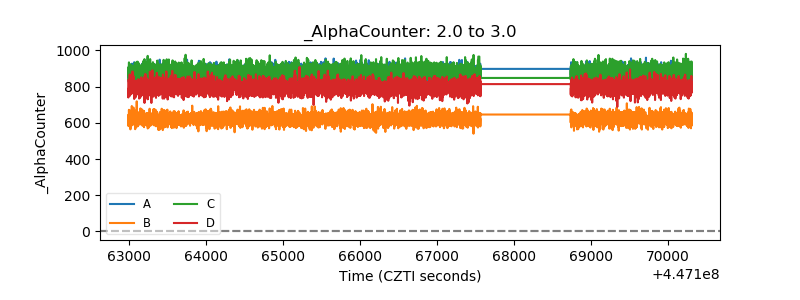 |
| _CPM_Rate | 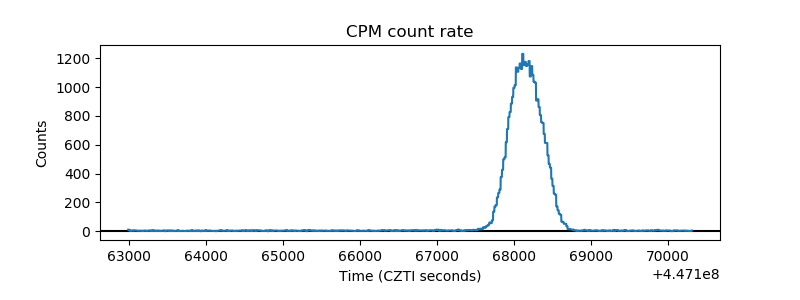 |
| CZT Counter | 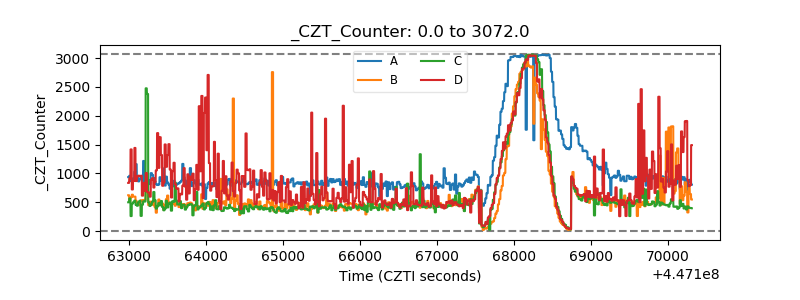 |
| +2.5 Volts monitor | 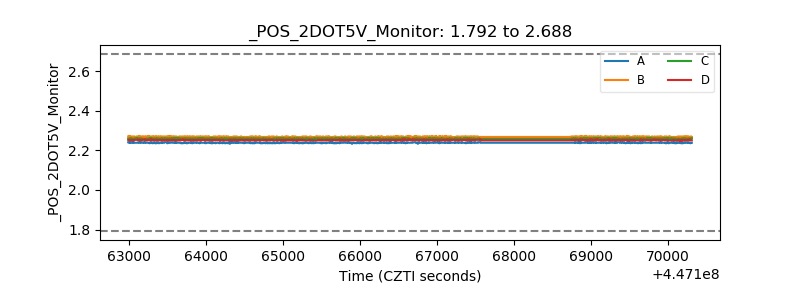 |
| +5 Volts monitor | 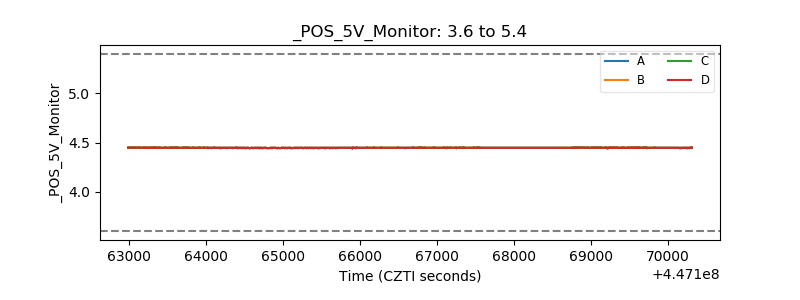 |
| _ROLL_ROT | 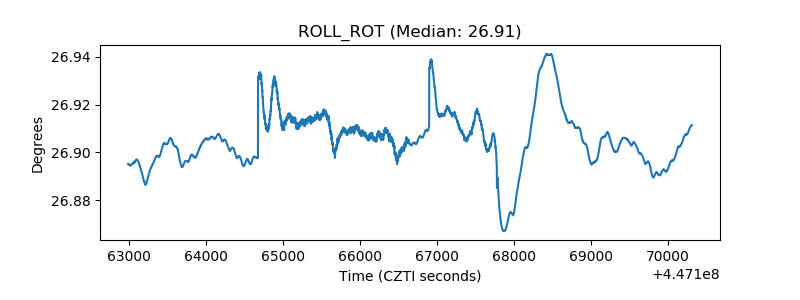 |
| _Roll_DEC | 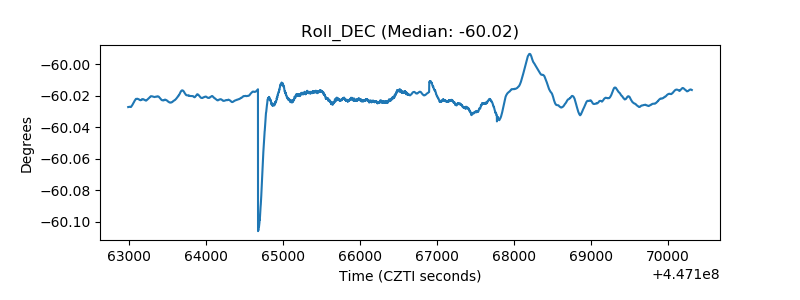 |
| _Roll_RA | 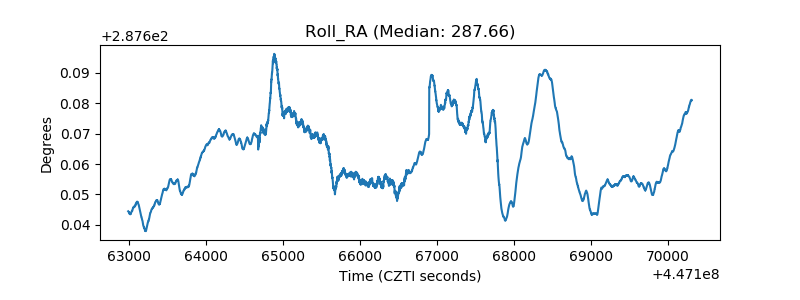 |
| Veto Counter | 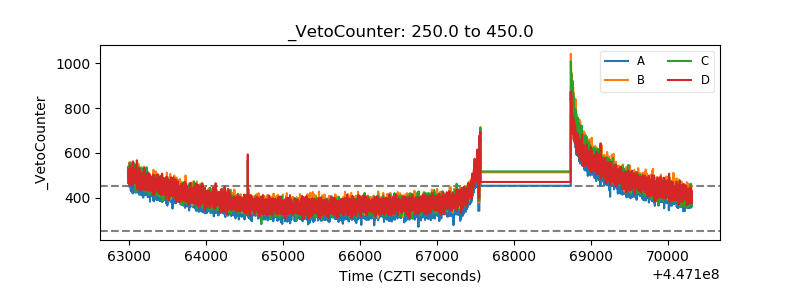 |