| Param | Original file | Final file |
|---|---|---|
| Filename | modeM0/AS1A13_071T04_9000006110_45590cztM0_level2.fits | modeM0/AS1A13_071T04_9000006110_45590cztM0_level2_quad_clean.evt |
| Size (bytes) | 505,514,880 | 112,573,440 |
| Size | 482.1 MB | 107.4 MB |
| Events in quadrant A | 5,723,823 | 769,616 |
| Events in quadrant B | 3,875,923 | 772,542 |
| Events in quadrant C | 3,039,920 | 753,430 |
| Events in quadrant D | 5,580,444 | 670,153 |
| Mode M9 | |||
|---|---|---|---|
| Quadrant | BADHDUFLAG | Total packets | Discarded packets |
| A | 0 | 12 | 0 |
| B | 0 | 12 | 0 |
| C | 0 | 12 | 0 |
| D | 0 | 12 | 0 |
| Mode M0 | |||
|---|---|---|---|
| Quadrant | BADHDUFLAG | Total packets | Discarded packets |
| A | 0 | 20801 | 1 |
| B | 0 | 15552 | 5 |
| C | 0 | 13386 | 1 |
| D | 0 | 20965 | 1 |
| Mode SS | |||
|---|---|---|---|
| Quadrant | BADHDUFLAG | Total packets | Discarded packets |
| A | 0 | 128 | 0 |
| B | 0 | 128 | 0 |
| C | 0 | 128 | 0 |
| D | 0 | 128 | 0 |
| Quadrant | Total seconds | Saturated seconds | Saturation percentage |
|---|---|---|---|
| A | 6353 | 186 | 2.927751% |
| B | 6353 | 296 | 4.659216% |
| C | 6353 | 74 | 1.164804% |
| D | 6353 | 385 | 6.060129% |
Noise dominated data is calculated using 1-second bins in cleaned event files. If a bin has >2000 counts, and if more than 50% of those come from <1% of pixels, then it is considered to be noise-dominated and hence unusable.
| Quadrant | # 1 sec bins | Bins with >0 counts | Bins with >2000 counts | High rate bins dominated by noise | Noise dominated (total time) | Noise dominated (detector-on time) | Marked lightcurve |
|---|---|---|---|---|---|---|---|
| A | 7528 | 6353 | 14 | 14 | 0.19% | 0.22% |  |
| B | 7528 | 6354 | 138 | 138 | 1.83% | 2.17% | 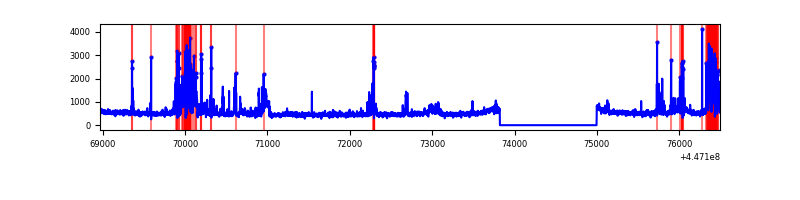 |
| C | 7528 | 6354 | 19 | 19 | 0.25% | 0.30% | 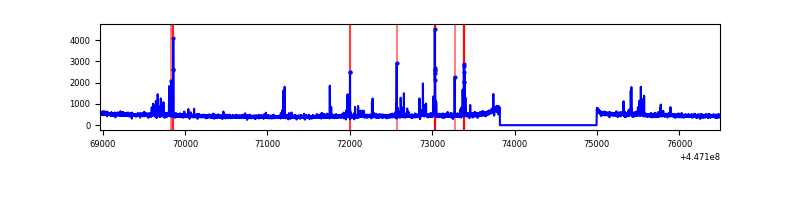 |
| D | 7528 | 6354 | 282 | 282 | 3.75% | 4.44% | 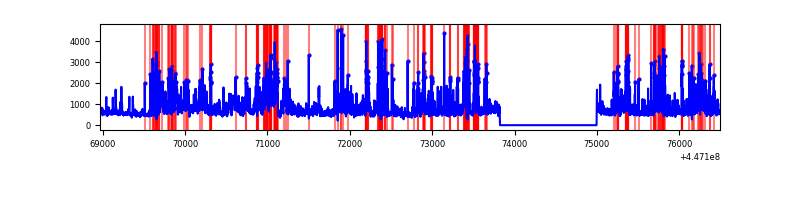 |
Top three noisy pixels from each quadrant. If the there are fewer than three noisy pixels in the level2.evt file, extra rows are filled as -1
| Pixel properties | Quadrant properties | ||||||
|---|---|---|---|---|---|---|---|
| Quadrant | DetID | PixID | Counts | Sigma | Mean | Median | Sigma |
| A | 10 | 83 | 2734123 | 17717.78 | 759 | 743 | 154.3 |
| A | 0 | 243 | 32856 | 208.16 | 759 | 743 | 154.3 |
| A | 0 | 227 | 10353 | 62.29 | 759 | 743 | 154.3 |
| B | 15 | 201 | 614809 | 4272.25 | 745 | 725 | 143.7 |
| B | 5 | 172 | 91932 | 634.54 | 745 | 725 | 143.7 |
| B | 0 | 183 | 74760 | 515.07 | 745 | 725 | 143.7 |
| C | 14 | 254 | 162368 | 949.16 | 734 | 737 | 170.3 |
| C | 12 | 249 | 13020 | 72.13 | 734 | 737 | 170.3 |
| C | 13 | 61 | 4883 | 24.35 | 734 | 737 | 170.3 |
| D | 1 | 52 | 1525234 | 8351.48 | 730 | 707 | 182.5 |
| D | 2 | 249 | 620582 | 3395.72 | 730 | 707 | 182.5 |
| D | 11 | 241 | 356003 | 1946.34 | 730 | 707 | 182.5 |
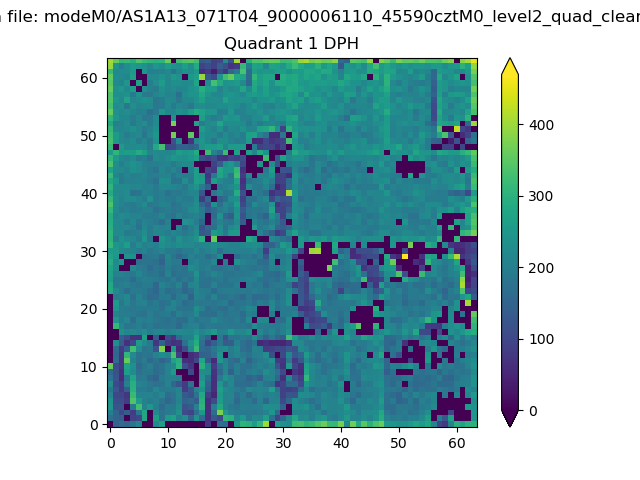
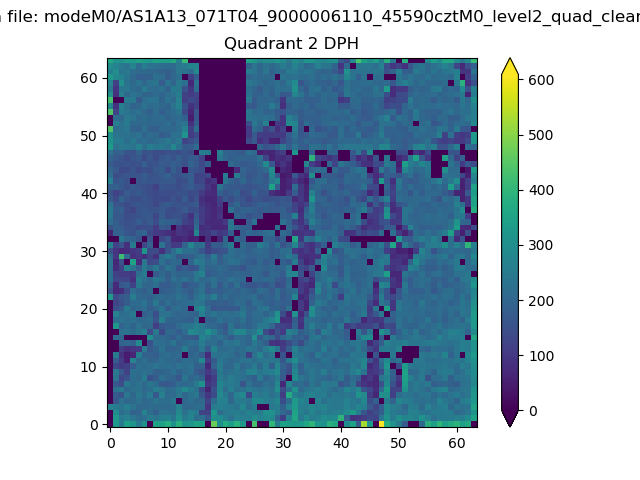
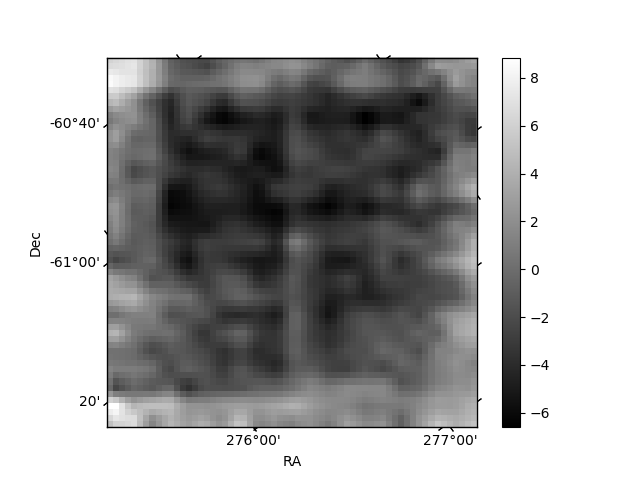
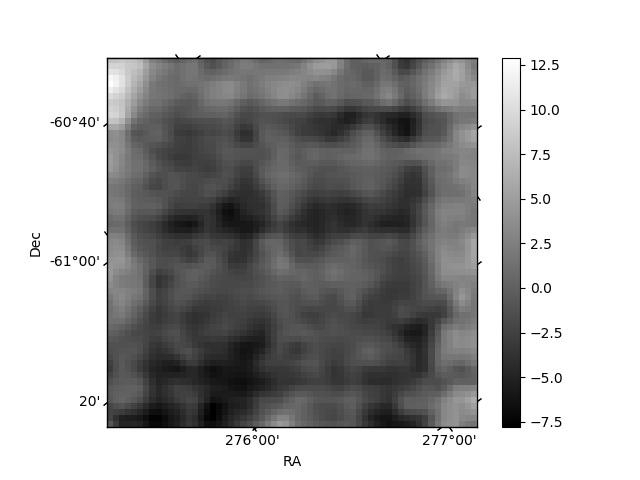
Histogram calculated using DETX and DETY for each event in the final _common_clean file
| Quadrant A |  |
 |
Quadrant B |
|---|---|---|---|
| Quadrant D | 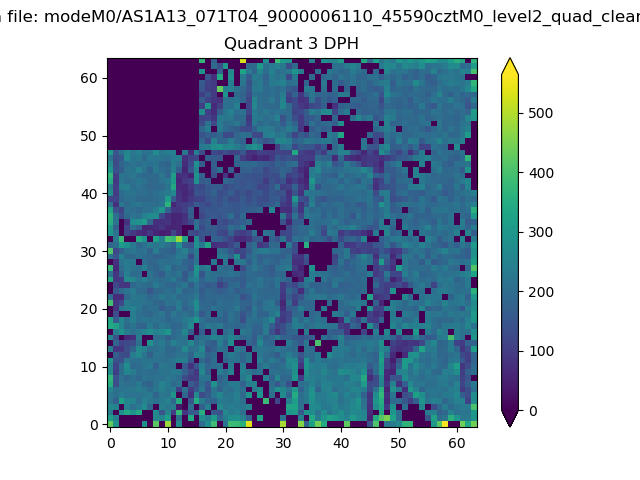 |
 |
Quadrant C |
| Plot type | Count rate plots | Images |
|---|---|---|
| Comparison with Poisson distribution Blue bars denote a histogram of data divided into 1 sec bins. Red curve is a Poisson curve with rate = median count rate of data. |
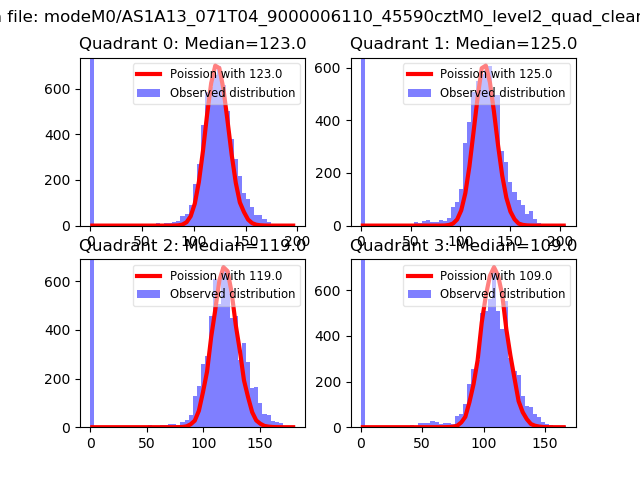 |
 |
| Quadrant-wise count rates Data is divided into 100 sec bins |
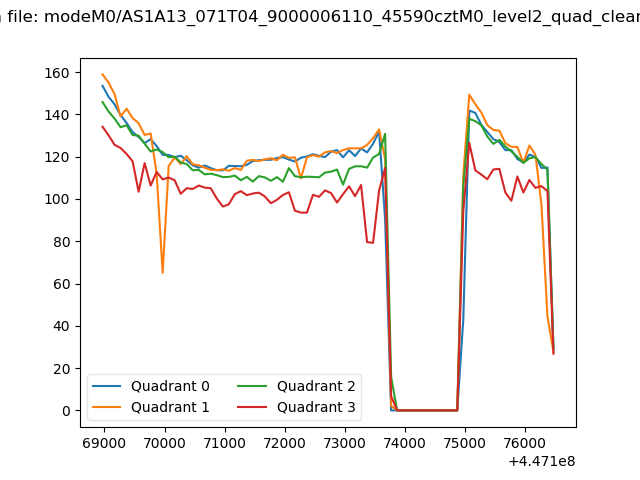 |
|
| Module-wise count rates for Quadrant A Data is divided into 100 sec bins |
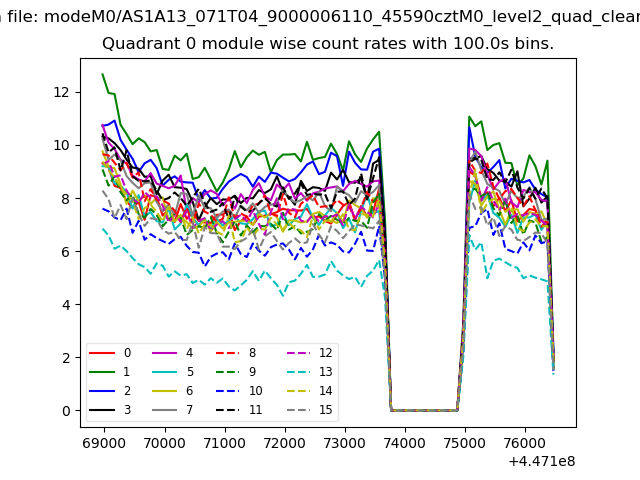 |
 |
| Module-wise count rates for Quadrant B Data is divided into 100 sec bins |
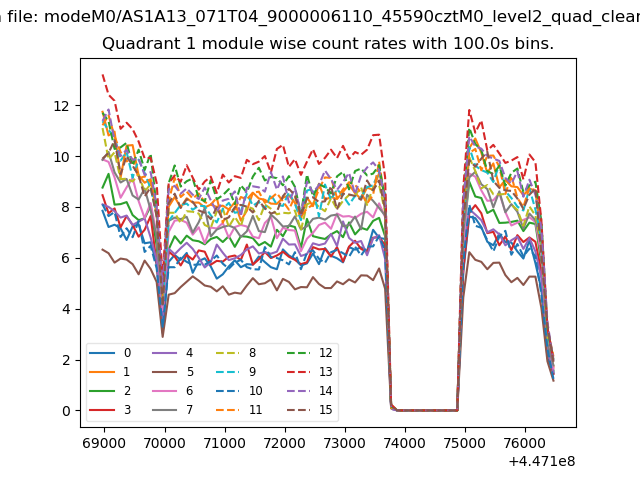 |
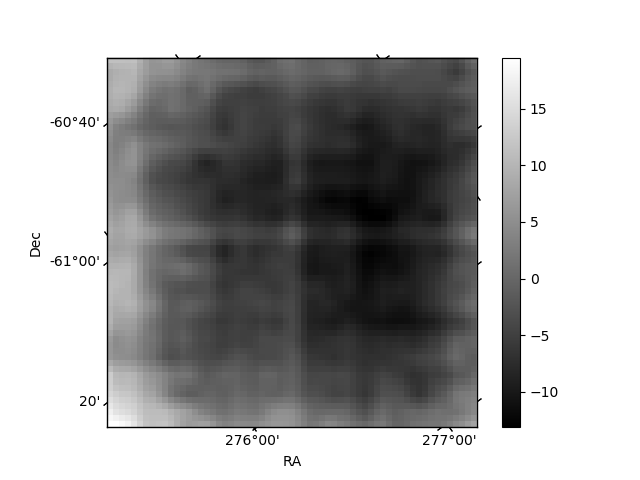 |
| Module-wise count rates for Quadrant C Data is divided into 100 sec bins |
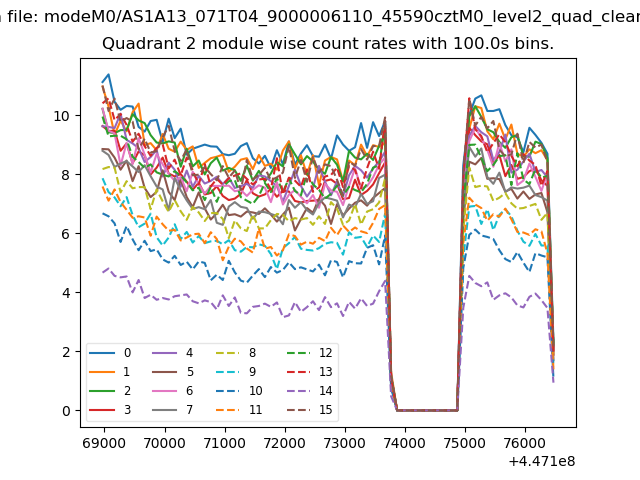 |
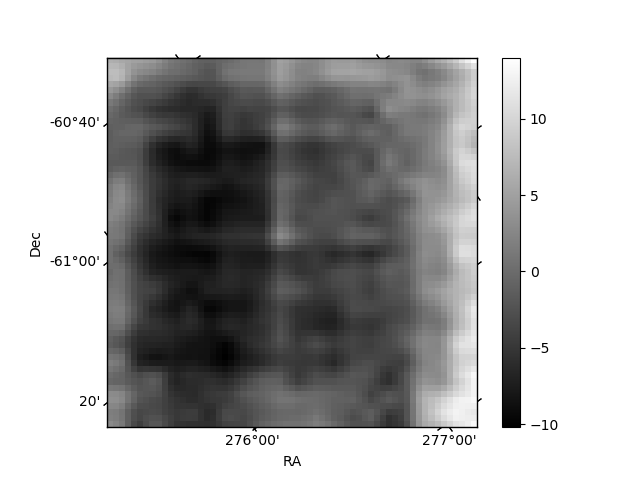 |
| Module-wise count rates for Quadrant D Data is divided into 100 sec bins |
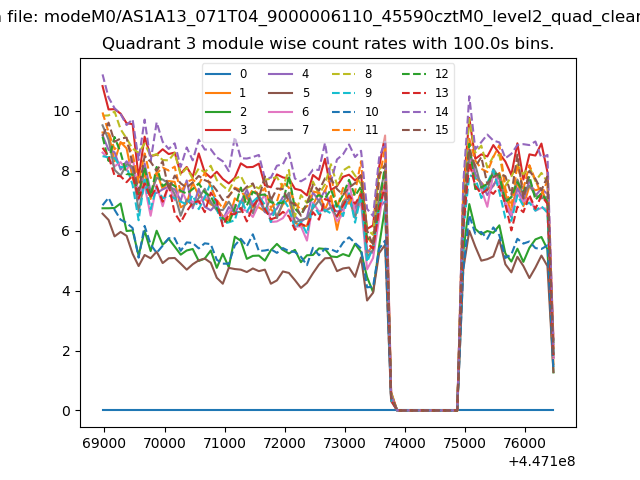 |
 |
| Parameter | Plot |
|---|---|
| CZT HV Monitor | 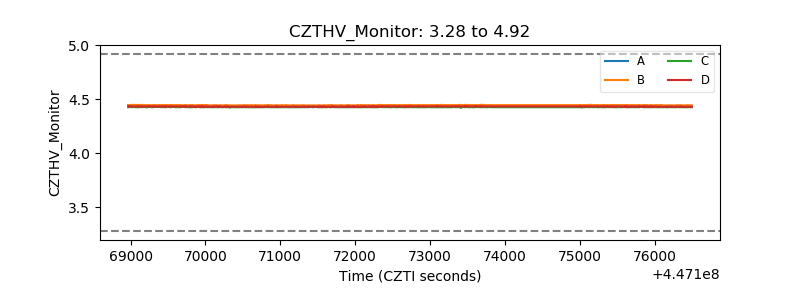 |
| D_VDD | 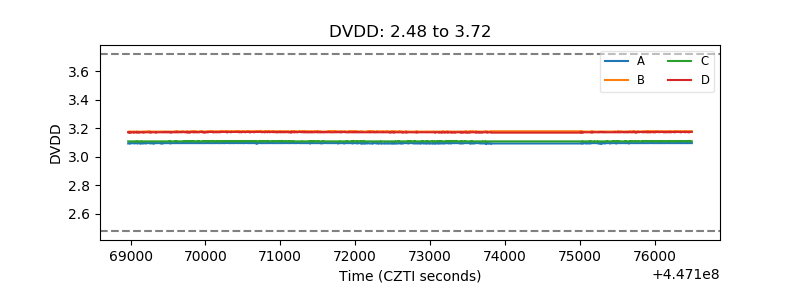 |
| Temperature 1 | 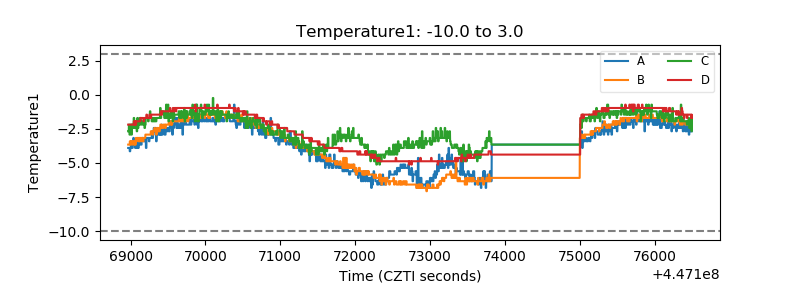 |
| Veto HV Monitor | 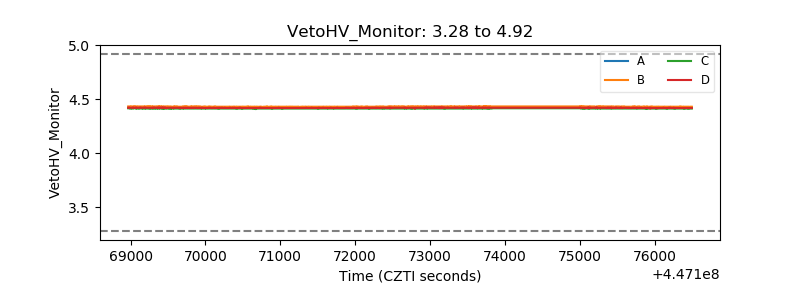 |
| Veto LLD | 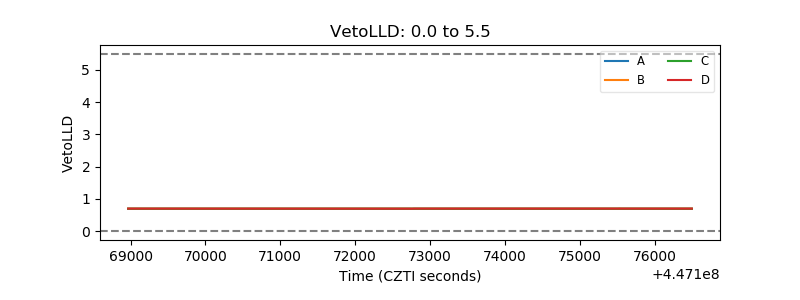 |
| Alpha Counter | 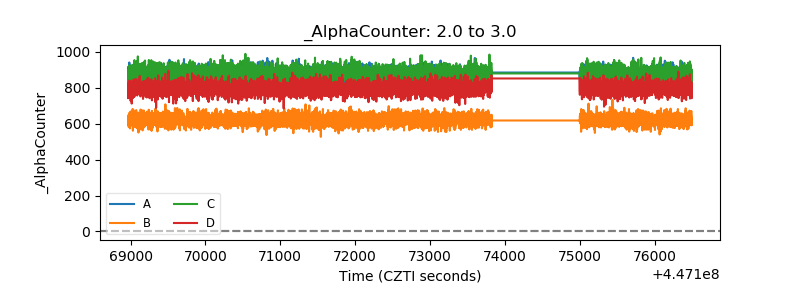 |
| _CPM_Rate |  |
| CZT Counter | 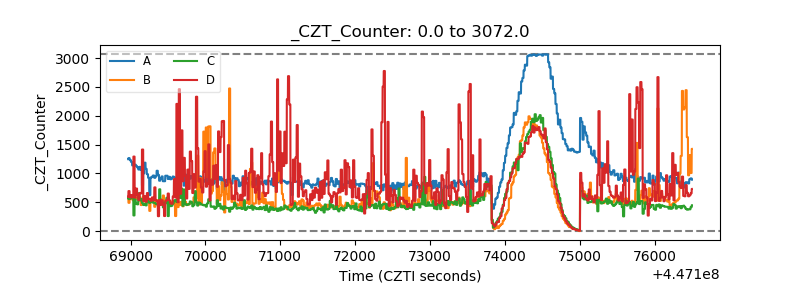 |
| +2.5 Volts monitor | 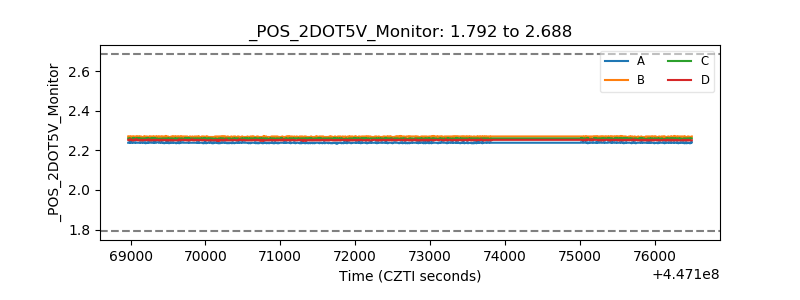 |
| +5 Volts monitor | 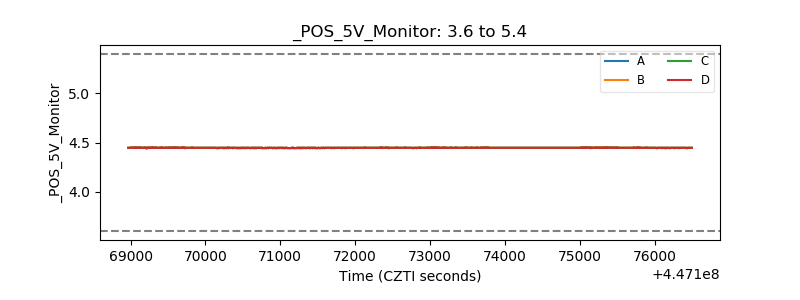 |
| _ROLL_ROT | 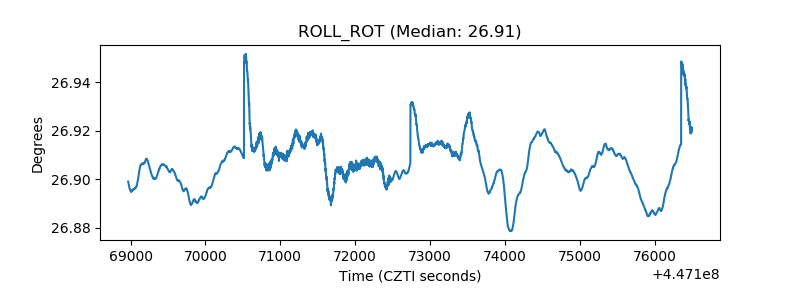 |
| _Roll_DEC | 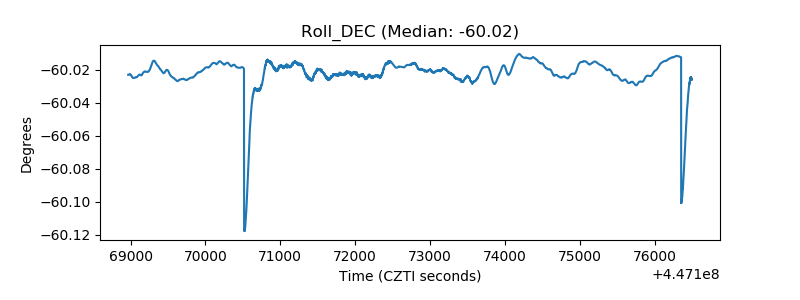 |
| _Roll_RA | 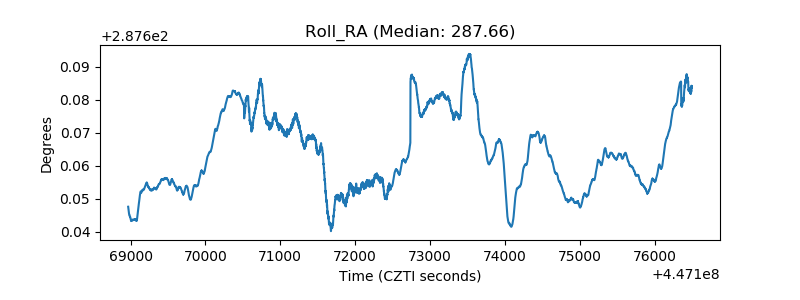 |
| Veto Counter | 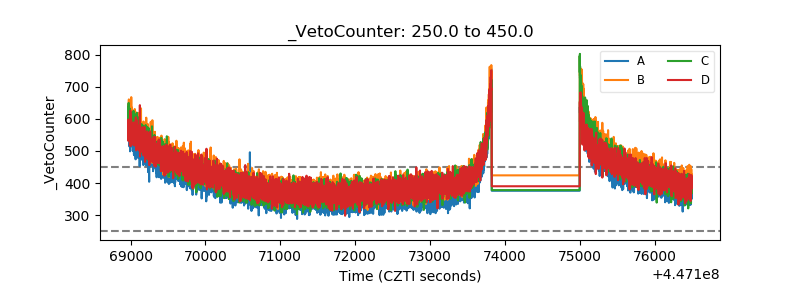 |