| Param | Original file | Final file |
|---|---|---|
| Filename | modeM0/AS1A13_071T04_9000006110_45591cztM0_level2.fits | modeM0/AS1A13_071T04_9000006110_45591cztM0_level2_quad_clean.evt |
| Size (bytes) | 438,016,320 | 101,707,200 |
| Size | 417.7 MB | 97.0 MB |
| Events in quadrant A | 5,216,369 | 686,763 |
| Events in quadrant B | 3,311,108 | 695,867 |
| Events in quadrant C | 2,695,480 | 674,730 |
| Events in quadrant D | 4,530,111 | 607,440 |
| Mode M9 | |||
|---|---|---|---|
| Quadrant | BADHDUFLAG | Total packets | Discarded packets |
| A | 0 | 11 | 0 |
| B | 0 | 11 | 0 |
| C | 0 | 11 | 0 |
| D | 0 | 11 | 0 |
| Mode M0 | |||
|---|---|---|---|
| Quadrant | BADHDUFLAG | Total packets | Discarded packets |
| A | 0 | 19185 | 1 |
| B | 0 | 13711 | 1 |
| C | 0 | 12252 | 1 |
| D | 0 | 17605 | 1 |
| Mode SS | |||
|---|---|---|---|
| Quadrant | BADHDUFLAG | Total packets | Discarded packets |
| A | 0 | 122 | 0 |
| B | 0 | 122 | 0 |
| C | 0 | 122 | 0 |
| D | 0 | 122 | 0 |
| Quadrant | Total seconds | Saturated seconds | Saturation percentage |
|---|---|---|---|
| A | 5935 | 183 | 3.083404% |
| B | 5936 | 222 | 3.739892% |
| C | 5935 | 52 | 0.876158% |
| D | 5935 | 252 | 4.245998% |
Noise dominated data is calculated using 1-second bins in cleaned event files. If a bin has >2000 counts, and if more than 50% of those come from <1% of pixels, then it is considered to be noise-dominated and hence unusable.
| Quadrant | # 1 sec bins | Bins with >0 counts | Bins with >2000 counts | High rate bins dominated by noise | Noise dominated (total time) | Noise dominated (detector-on time) | Marked lightcurve |
|---|---|---|---|---|---|---|---|
| A | 7075 | 5936 | 17 | 17 | 0.24% | 0.29% | 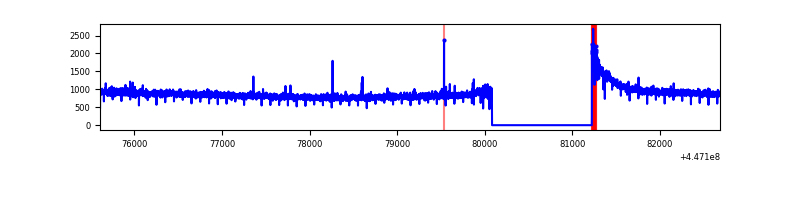 |
| B | 7076 | 5937 | 96 | 96 | 1.36% | 1.62% | 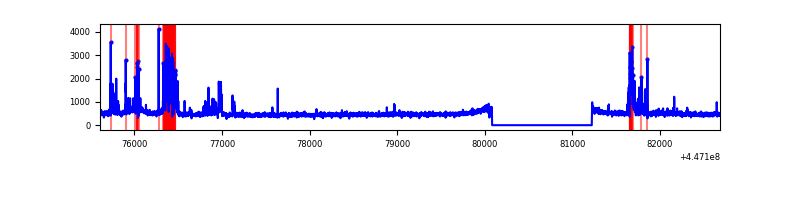 |
| C | 7075 | 5936 | 7 | 7 | 0.10% | 0.12% | 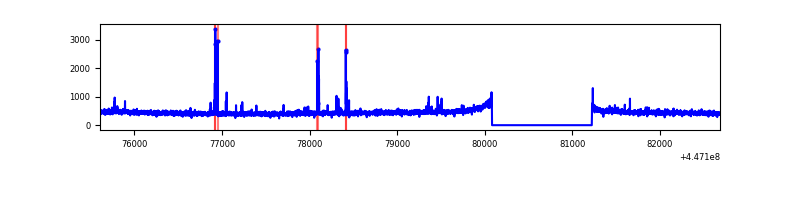 |
| D | 7075 | 5936 | 169 | 169 | 2.39% | 2.85% | 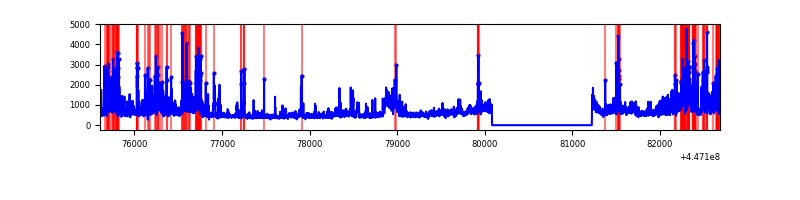 |
Top three noisy pixels from each quadrant. If the there are fewer than three noisy pixels in the level2.evt file, extra rows are filled as -1
| Pixel properties | Quadrant properties | ||||||
|---|---|---|---|---|---|---|---|
| Quadrant | DetID | PixID | Counts | Sigma | Mean | Median | Sigma |
| A | 10 | 83 | 2527439 | 17820.48 | 687 | 672 | 141.8 |
| A | 0 | 243 | 27992 | 192.68 | 687 | 672 | 141.8 |
| A | 3 | 137 | 7805 | 50.31 | 687 | 672 | 141.8 |
| B | 15 | 201 | 283865 | 2170.44 | 679 | 661 | 130.5 |
| B | 5 | 172 | 157688 | 1203.44 | 679 | 661 | 130.5 |
| B | 0 | 183 | 76444 | 580.79 | 679 | 661 | 130.5 |
| C | 14 | 254 | 62982 | 399.98 | 669 | 672 | 155.8 |
| C | 12 | 249 | 15491 | 95.13 | 669 | 672 | 155.8 |
| C | 13 | 61 | 4480 | 24.44 | 669 | 672 | 155.8 |
| D | 1 | 52 | 1021662 | 6199.72 | 664 | 642 | 164.7 |
| D | 11 | 224 | 314429 | 1905.34 | 664 | 642 | 164.7 |
| D | 11 | 241 | 185061 | 1119.81 | 664 | 642 | 164.7 |
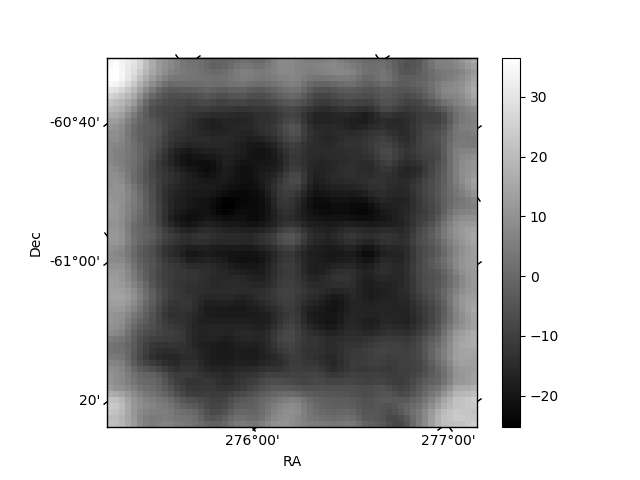
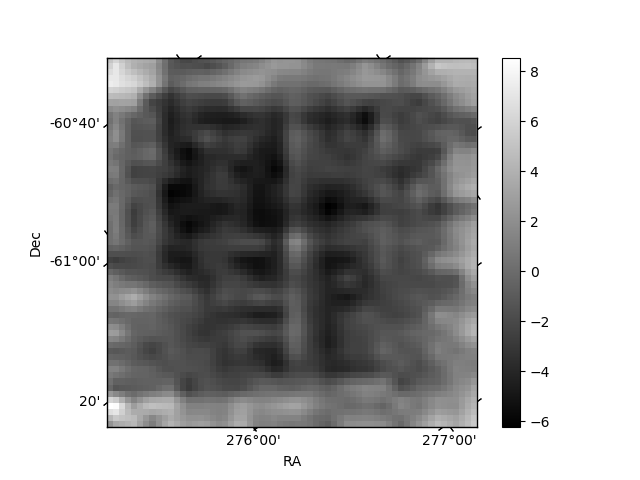
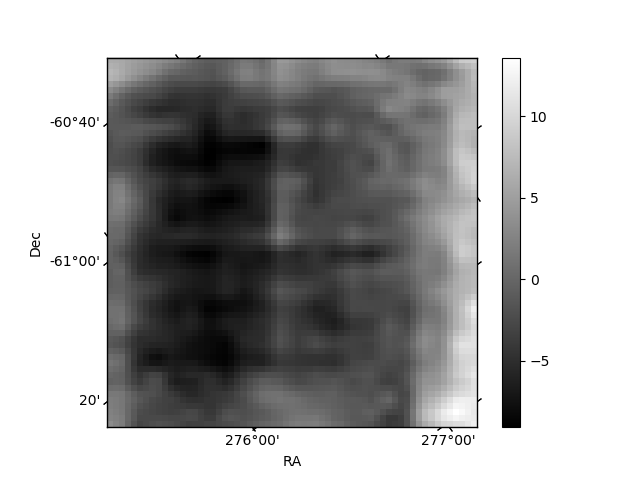
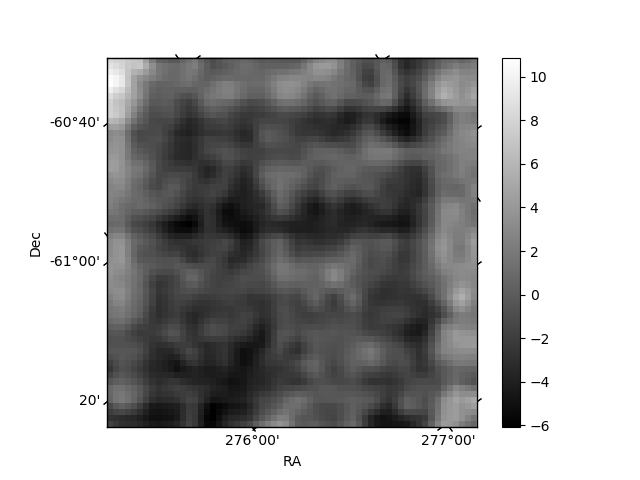
Histogram calculated using DETX and DETY for each event in the final _common_clean file
| Quadrant A | 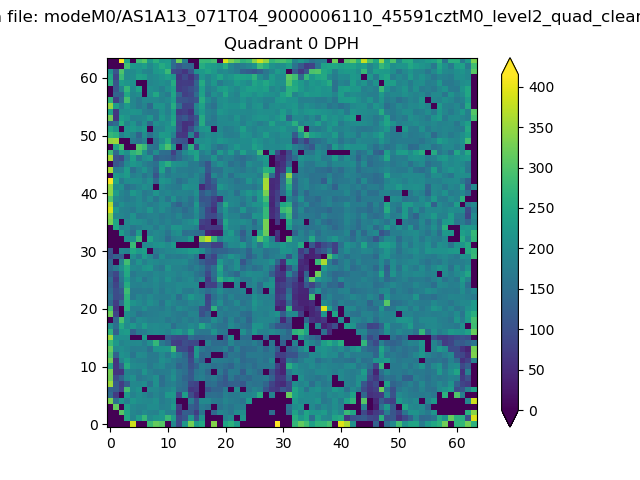 |
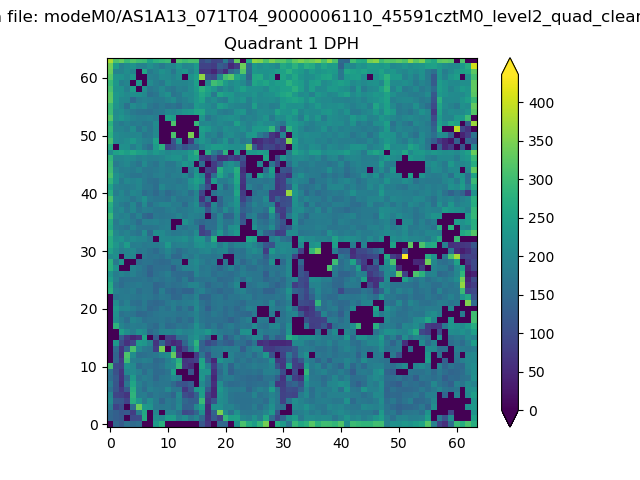 |
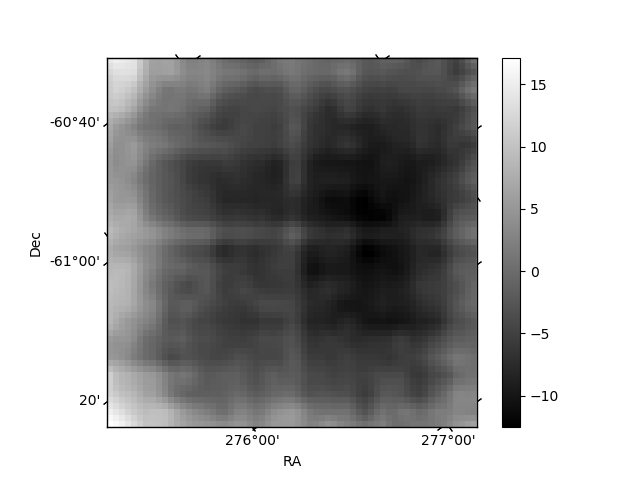
Quadrant B |
|---|---|---|---|
| Quadrant D | 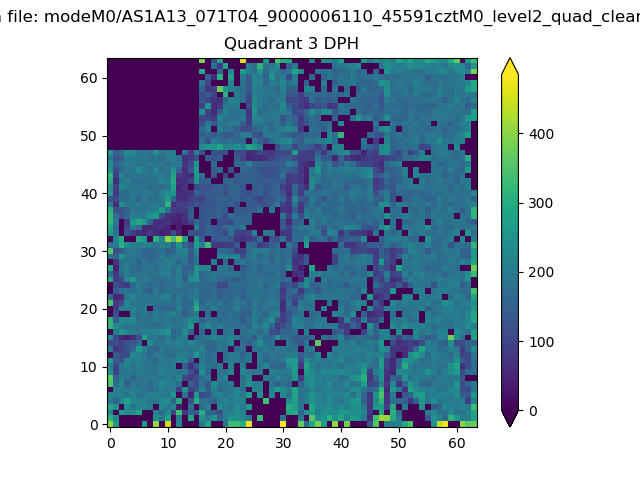 |
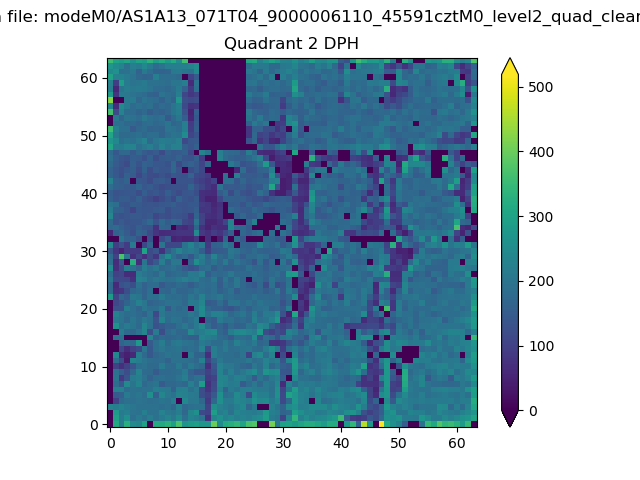 |
Quadrant C |
| Plot type | Count rate plots | Images |
|---|---|---|
| Comparison with Poisson distribution Blue bars denote a histogram of data divided into 1 sec bins. Red curve is a Poisson curve with rate = median count rate of data. |
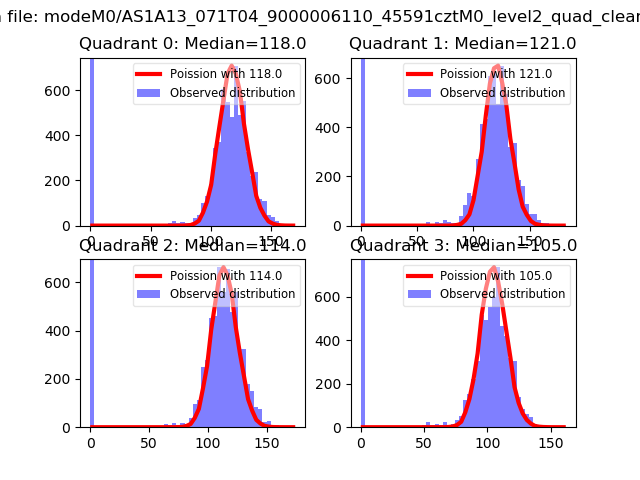 |
 |
| Quadrant-wise count rates Data is divided into 100 sec bins |
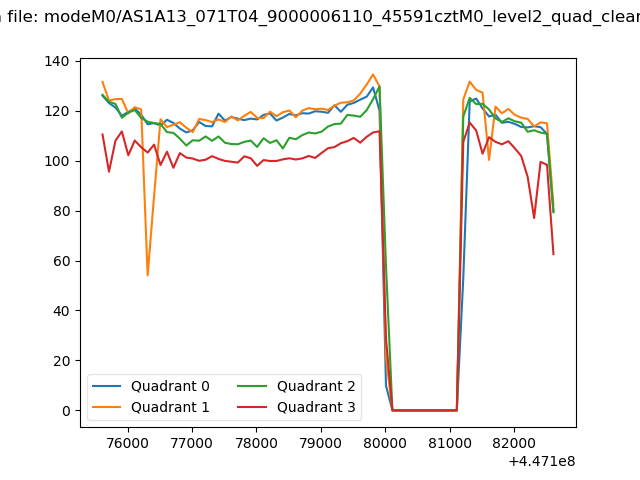 |
|
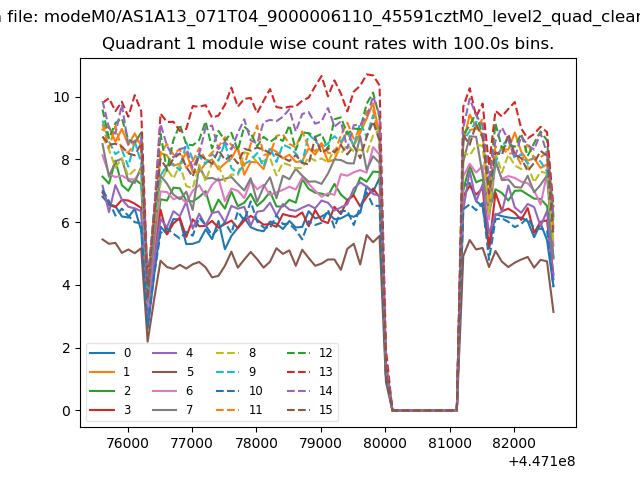
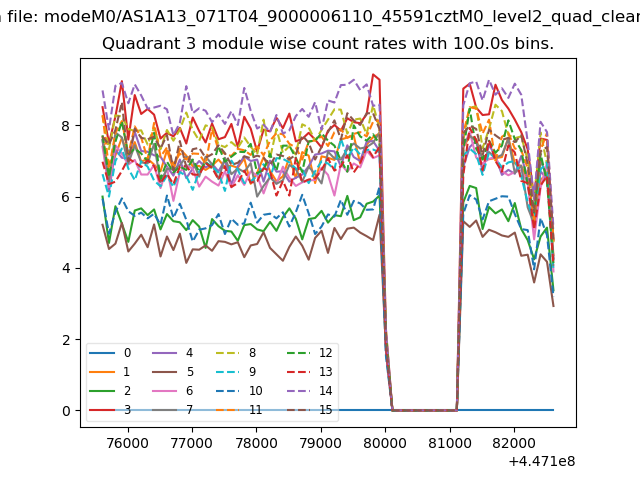
| Module-wise count rates for Quadrant A Data is divided into 100 sec bins |
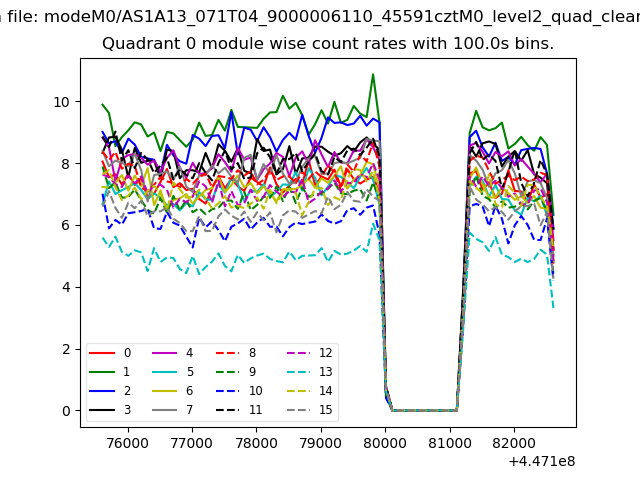 |
 |
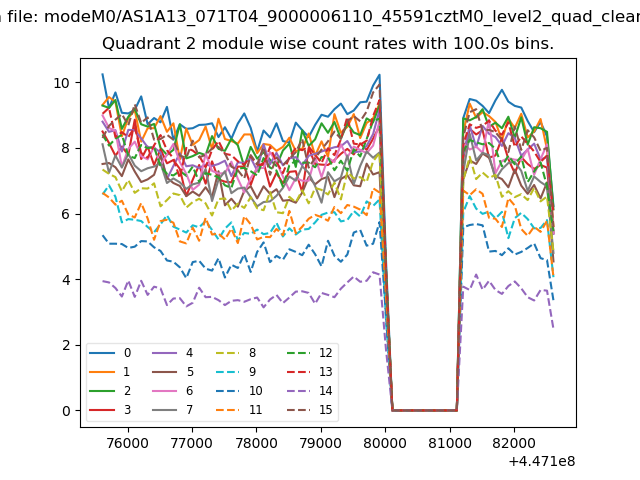
| Module-wise count rates for Quadrant B Data is divided into 100 sec bins |
 |
 |
| Module-wise count rates for Quadrant C Data is divided into 100 sec bins |
 |
 |
| Module-wise count rates for Quadrant D Data is divided into 100 sec bins |
 |
 |
| Parameter | Plot |
|---|---|
| CZT HV Monitor | 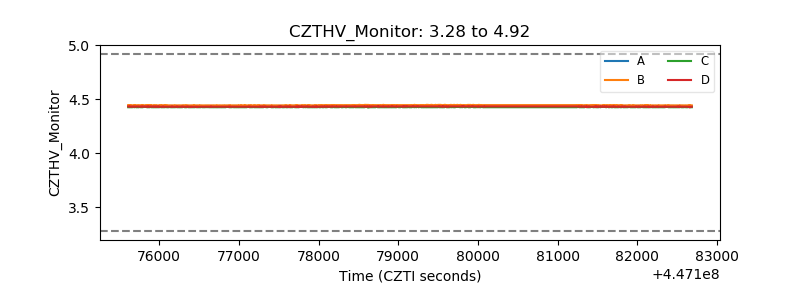 |
| D_VDD | 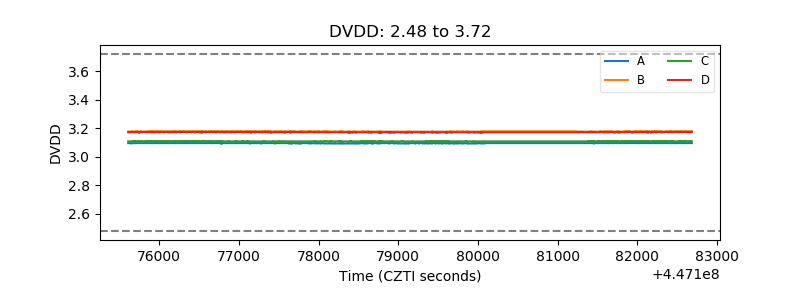 |
| Temperature 1 | 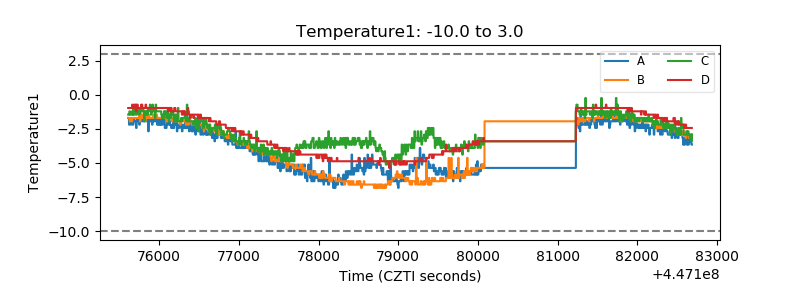 |
| Veto HV Monitor | 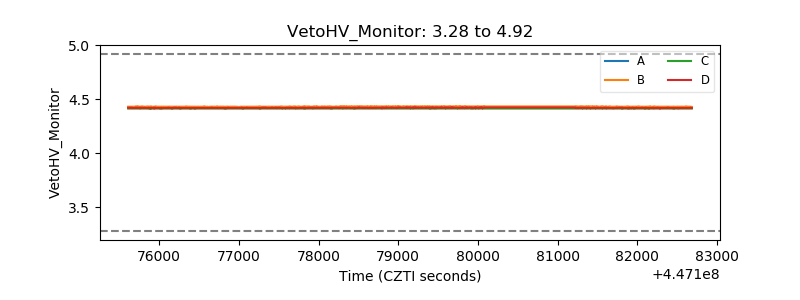 |
| Veto LLD | 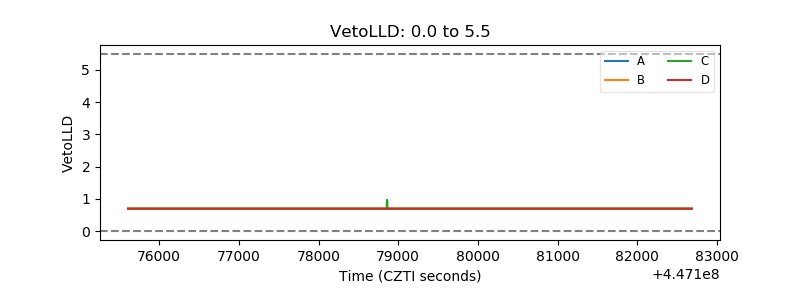 |
| Alpha Counter | 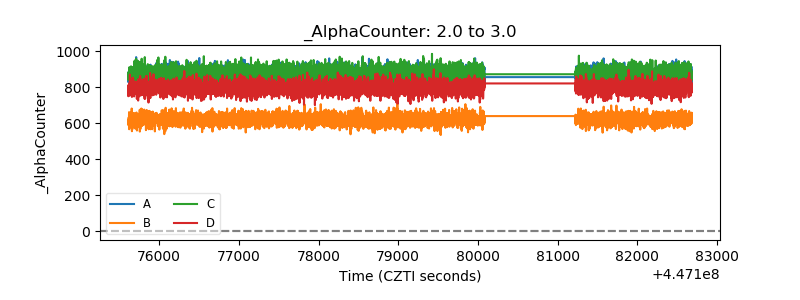 |
| _CPM_Rate | 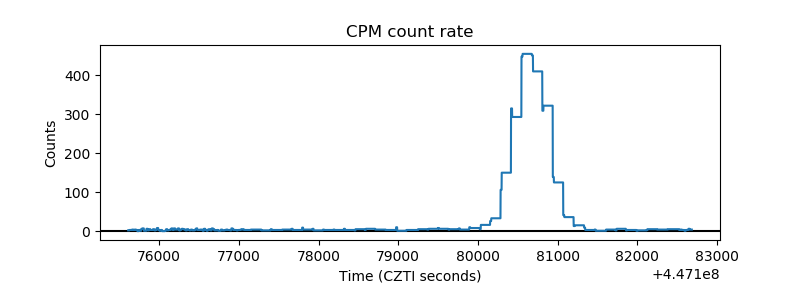 |
| CZT Counter | 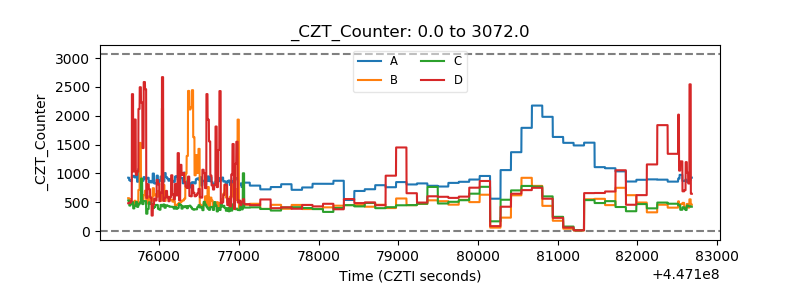 |
| +2.5 Volts monitor | 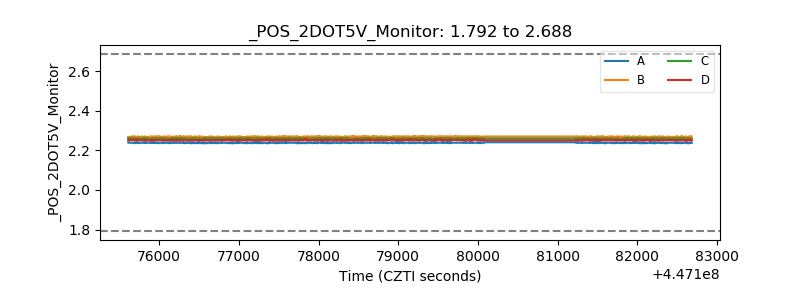 |
| +5 Volts monitor | 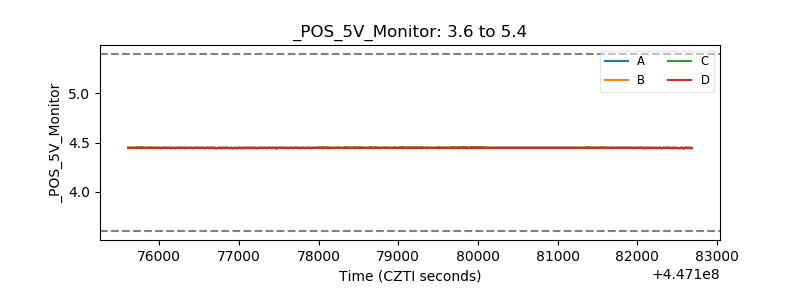 |
| _ROLL_ROT | 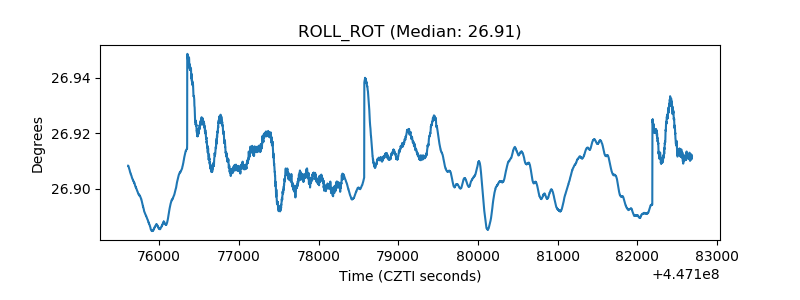 |
| _Roll_DEC | 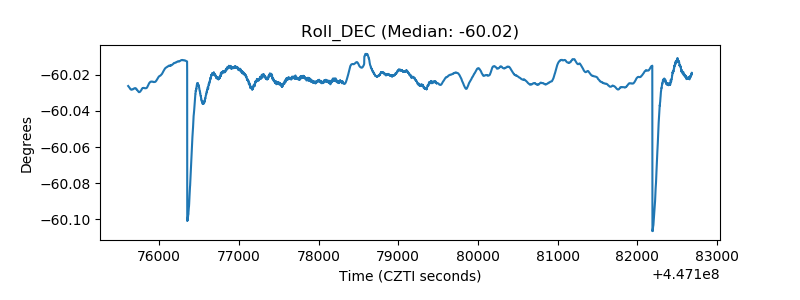 |
| _Roll_RA | 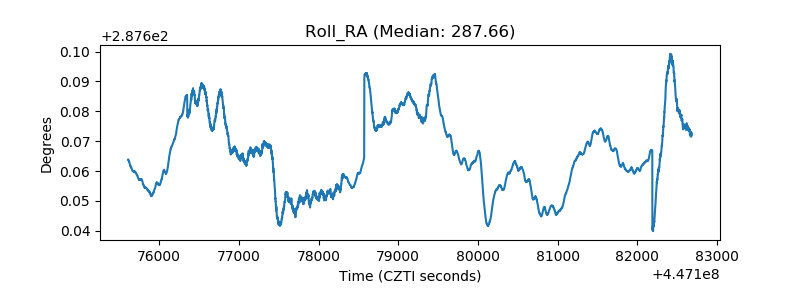 |
| Veto Counter | 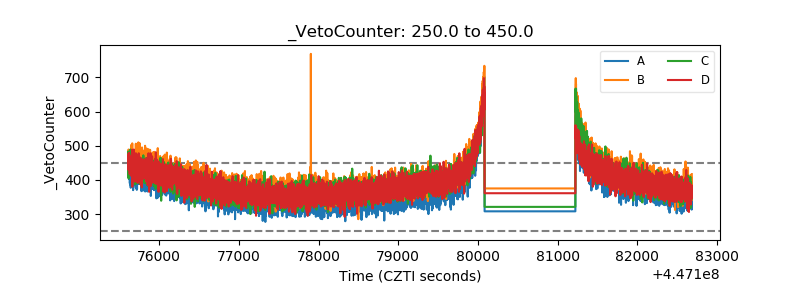 |