| Param | Original file | Final file |
|---|---|---|
| Filename | modeM0/AS1A13_071T04_9000006110_45594cztM0_level2.fits | modeM0/AS1A13_071T04_9000006110_45594cztM0_level2_quad_clean.evt |
| Size (bytes) | 160,545,600 | 34,513,920 |
| Size | 153.1 MB | 32.9 MB |
| Events in quadrant A | 2,025,193 | 222,122 |
| Events in quadrant B | 1,059,025 | 237,428 |
| Events in quadrant C | 922,973 | 227,800 |
| Events in quadrant D | 1,765,414 | 201,550 |
| Mode M9 | |||
|---|---|---|---|
| Quadrant | BADHDUFLAG | Total packets | Discarded packets |
| A | 0 | 4 | 0 |
| B | 0 | 5 | 0 |
| C | 0 | 5 | 0 |
| D | 0 | 5 | 0 |
| Mode M0 | |||
|---|---|---|---|
| Quadrant | BADHDUFLAG | Total packets | Discarded packets |
| A | 0 | 7481 | 1 |
| B | 0 | 4673 | 1 |
| C | 0 | 4435 | 1 |
| D | 0 | 6771 | 1 |
| Mode SS | |||
|---|---|---|---|
| Quadrant | BADHDUFLAG | Total packets | Discarded packets |
| A | 0 | 44 | 0 |
| B | 0 | 44 | 0 |
| C | 0 | 44 | 0 |
| D | 0 | 44 | 0 |
| Quadrant | Total seconds | Saturated seconds | Saturation percentage |
|---|---|---|---|
| A | 2162 | 134 | 6.197965% |
| B | 2162 | 36 | 1.665125% |
| C | 2162 | 7 | 0.323774% |
| D | 2162 | 138 | 6.382979% |
Noise dominated data is calculated using 1-second bins in cleaned event files. If a bin has >2000 counts, and if more than 50% of those come from <1% of pixels, then it is considered to be noise-dominated and hence unusable.
| Quadrant | # 1 sec bins | Bins with >0 counts | Bins with >2000 counts | High rate bins dominated by noise | Noise dominated (total time) | Noise dominated (detector-on time) | Marked lightcurve |
|---|---|---|---|---|---|---|---|
| A | 2162 | 2162 | 2 | 2 | 0.09% | 0.09% | 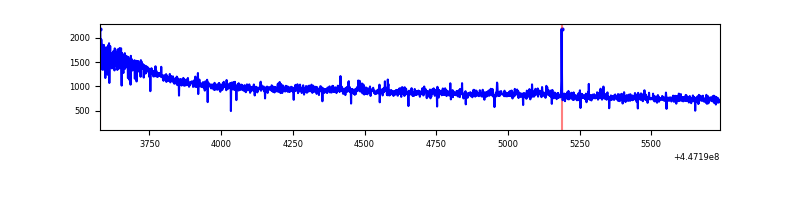 |
| B | 2162 | 2162 | 5 | 5 | 0.23% | 0.23% | 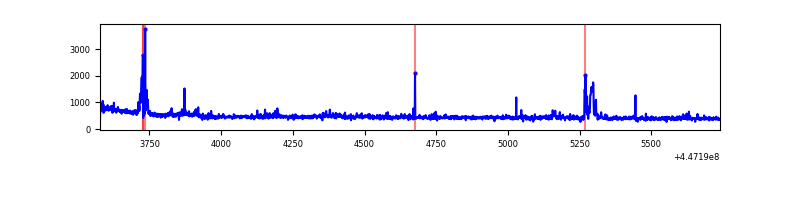 |
| C | 2162 | 2162 | 0 | 0 | 0.00% | 0.00% | 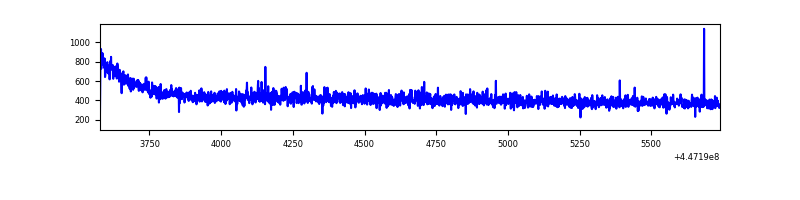 |
| D | 2162 | 2162 | 87 | 87 | 4.02% | 4.02% | 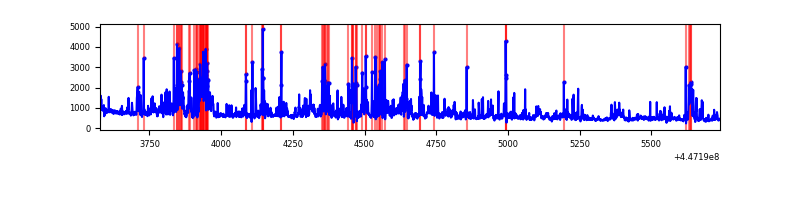 |
Top three noisy pixels from each quadrant. If the there are fewer than three noisy pixels in the level2.evt file, extra rows are filled as -1
| Pixel properties | Quadrant properties | ||||||
|---|---|---|---|---|---|---|---|
| Quadrant | DetID | PixID | Counts | Sigma | Mean | Median | Sigma |
| A | 10 | 83 | 1077054 | 20923.23 | 239 | 233 | 51.5 |
| A | 0 | 243 | 12302 | 234.51 | 239 | 233 | 51.5 |
| A | 13 | 248 | 5480 | 101.95 | 239 | 233 | 51.5 |
| B | 15 | 201 | 36156 | 716.86 | 243 | 236 | 50.1 |
| B | 0 | 186 | 33062 | 655.11 | 243 | 236 | 50.1 |
| B | 3 | 112 | 20497 | 404.35 | 243 | 236 | 50.1 |
| C | 12 | 2 | 3232 | 53.11 | 234 | 234 | 56.4 |
| C | 8 | 128 | 1822 | 28.13 | 234 | 234 | 56.4 |
| C | 13 | 61 | 1640 | 24.91 | 234 | 234 | 56.4 |
| D | 1 | 52 | 460080 | 7828.2 | 227 | 218 | 58.7 |
| D | 11 | 241 | 215064 | 3657.31 | 227 | 218 | 58.7 |
| D | 5 | 171 | 72914 | 1237.5 | 227 | 218 | 58.7 |
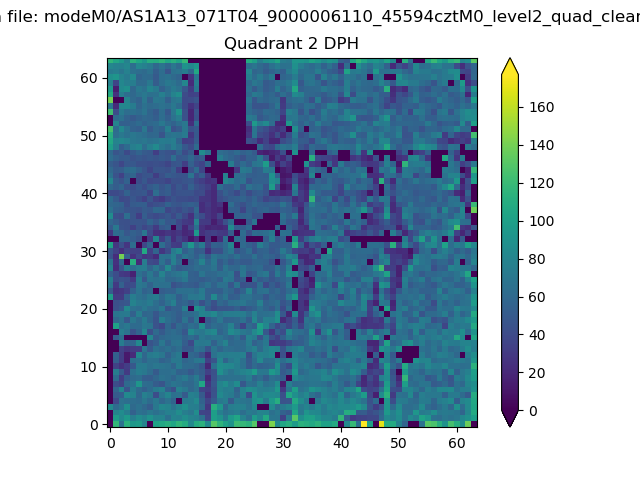
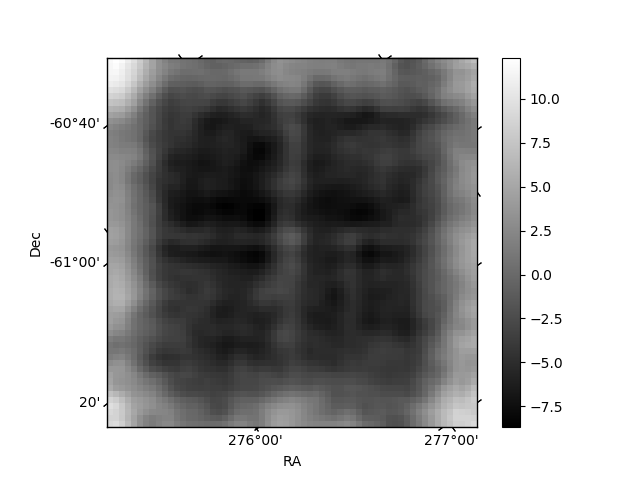
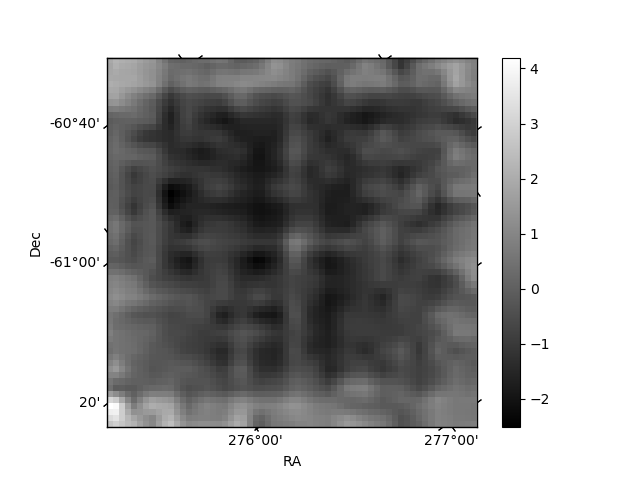
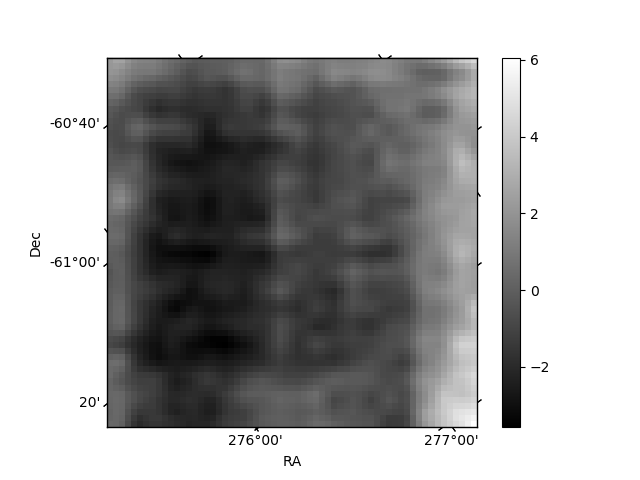
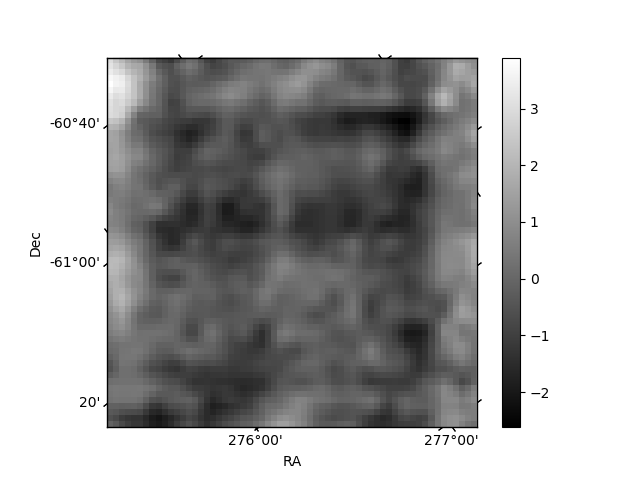
Histogram calculated using DETX and DETY for each event in the final _common_clean file
| Quadrant A | 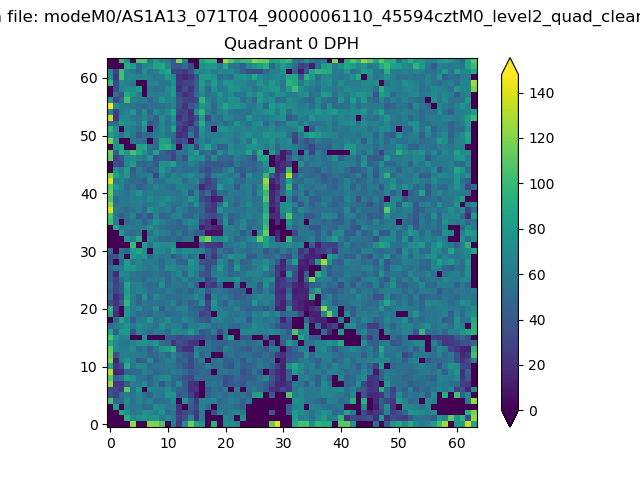 |
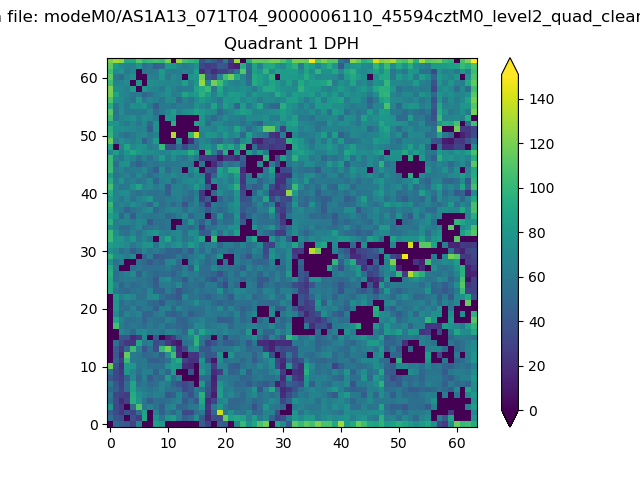 |
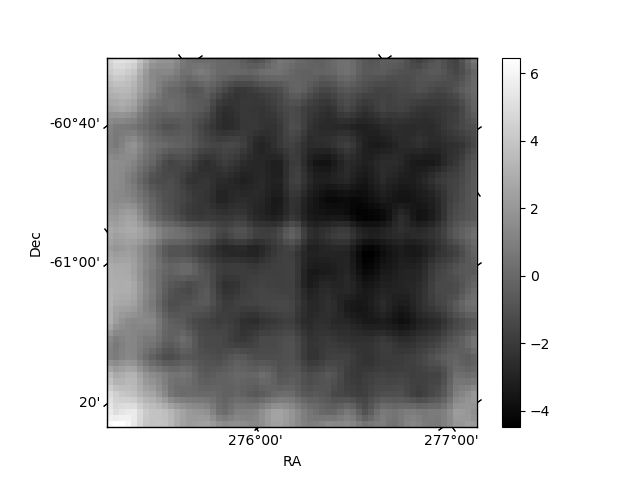
Quadrant B |
|---|---|---|---|
| Quadrant D | 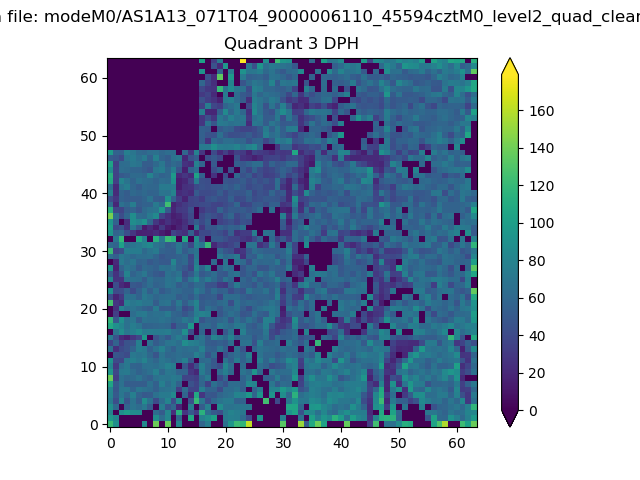 |
 |
Quadrant C |
| Plot type | Count rate plots | Images |
|---|---|---|
| Comparison with Poisson distribution Blue bars denote a histogram of data divided into 1 sec bins. Red curve is a Poisson curve with rate = median count rate of data. |
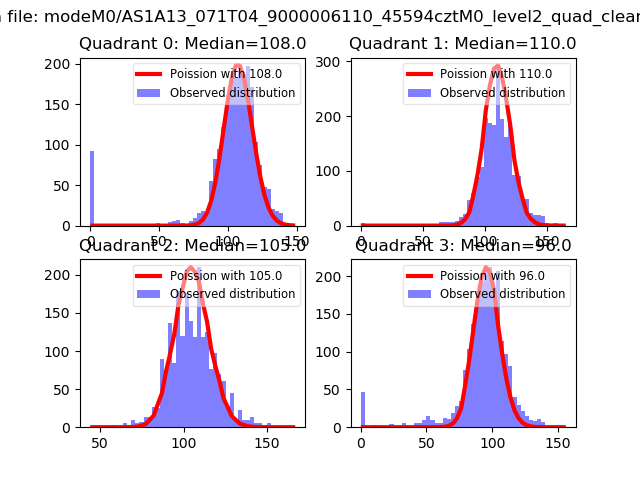 |
 |
| Quadrant-wise count rates Data is divided into 100 sec bins |
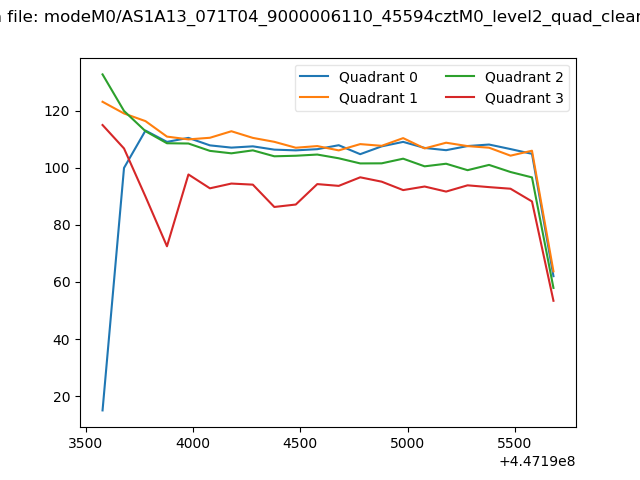 |
|
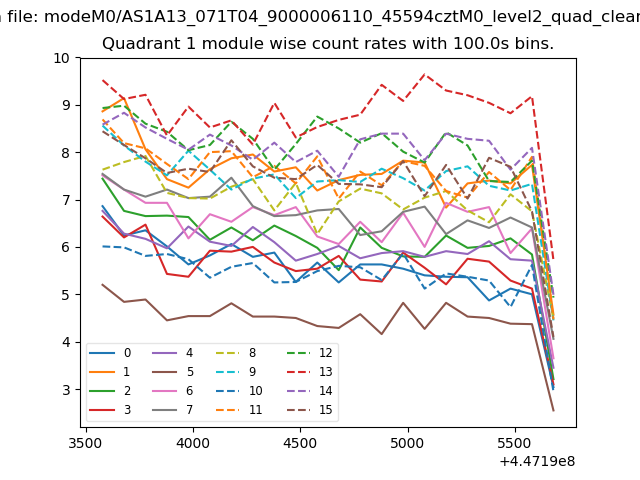
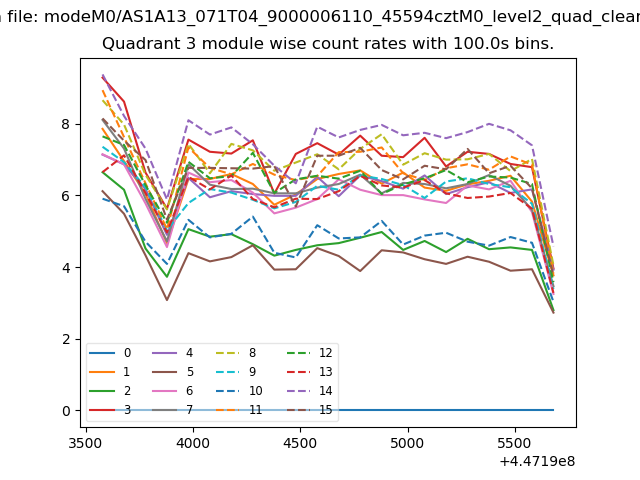
| Module-wise count rates for Quadrant A Data is divided into 100 sec bins |
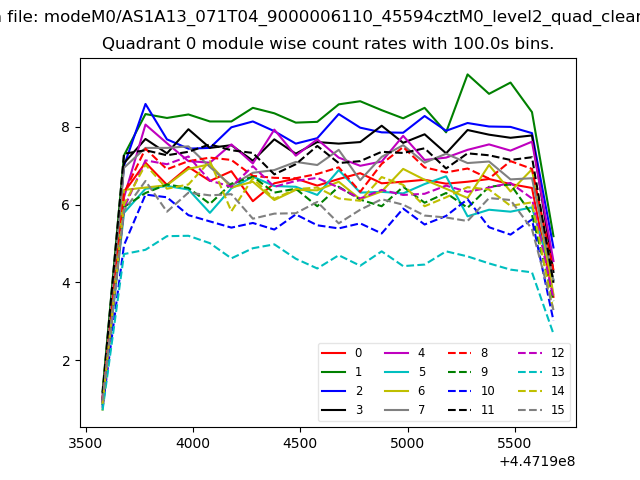 |
 |
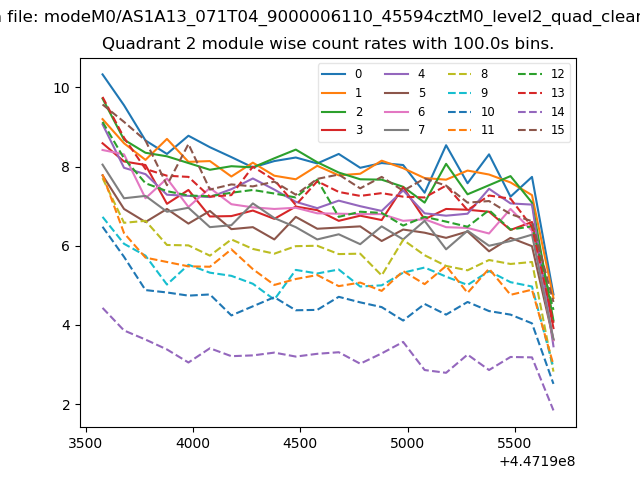
| Module-wise count rates for Quadrant B Data is divided into 100 sec bins |
 |
 |
| Module-wise count rates for Quadrant C Data is divided into 100 sec bins |
 |
 |
| Module-wise count rates for Quadrant D Data is divided into 100 sec bins |
 |
 |
| Parameter | Plot |
|---|---|
| CZT HV Monitor | 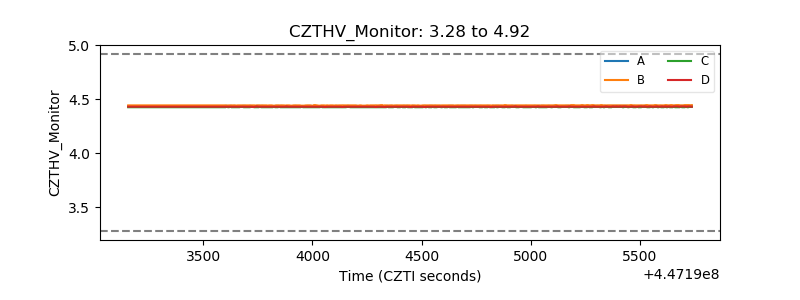 |
| D_VDD | 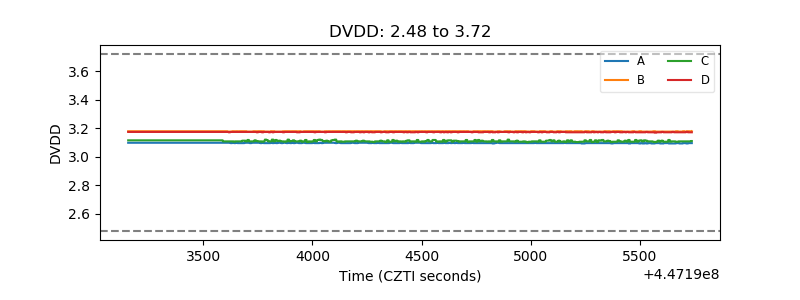 |
| Temperature 1 | 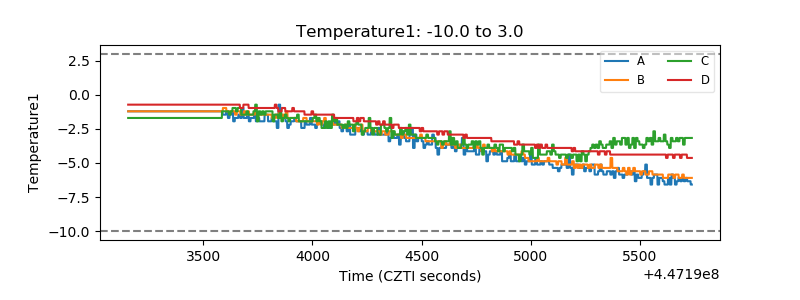 |
| Veto HV Monitor | 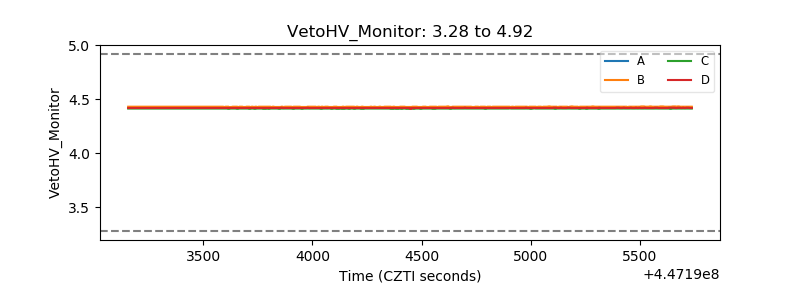 |
| Veto LLD | 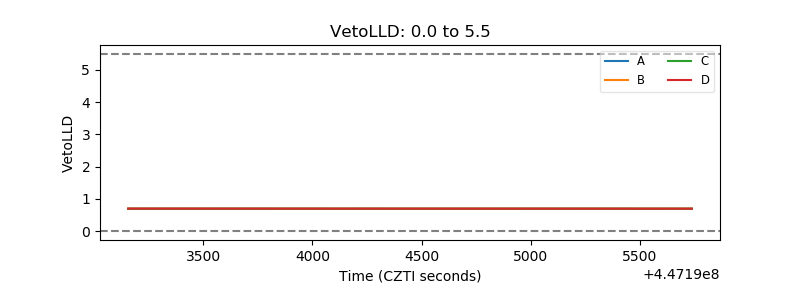 |
| Alpha Counter | 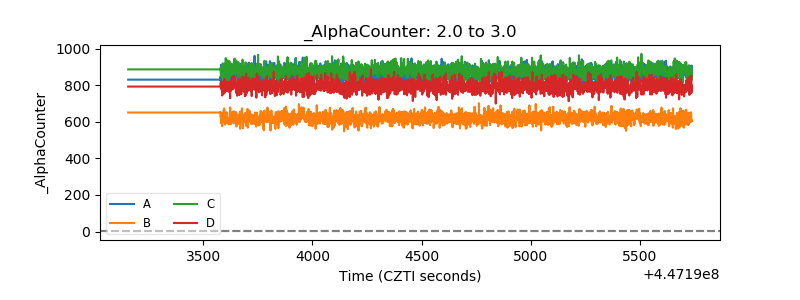 |
| _CPM_Rate | 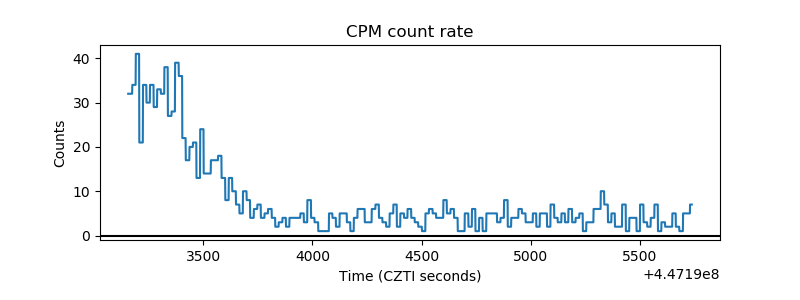 |
| CZT Counter |  |
| +2.5 Volts monitor | 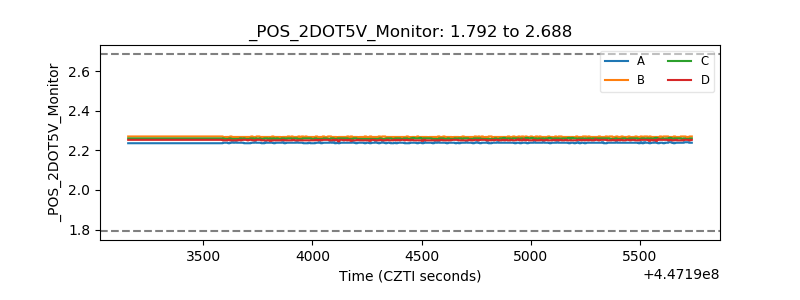 |
| +5 Volts monitor | 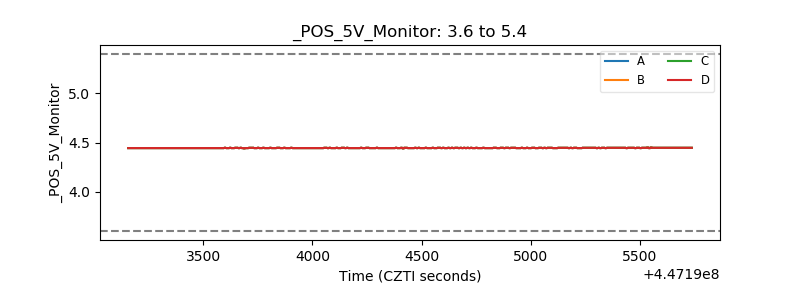 |
| _ROLL_ROT | 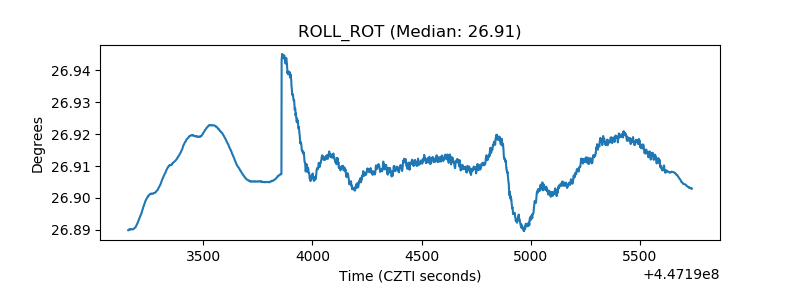 |
| _Roll_DEC | 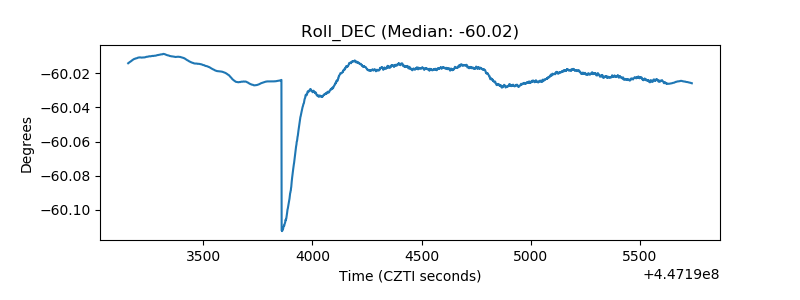 |
| _Roll_RA | 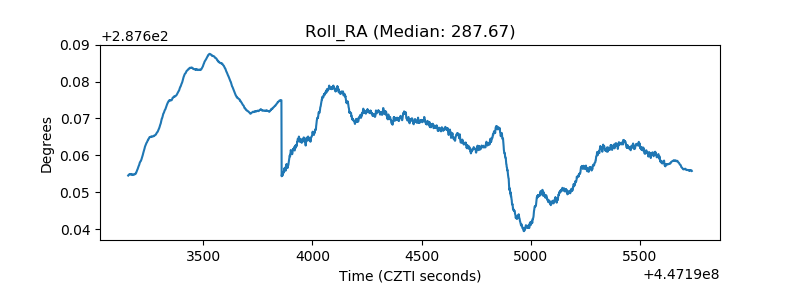 |
| Veto Counter | 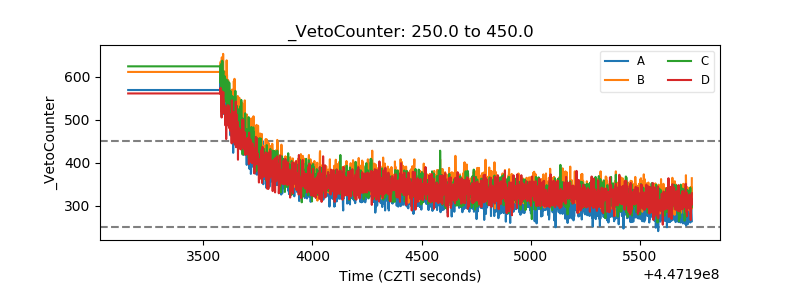 |