| Param | Original file | Final file |
|---|---|---|
| Filename | modeM0/AS1A13_082T02_9000006112_45595cztM0_level2.fits | modeM0/AS1A13_082T02_9000006112_45595cztM0_level2_quad_clean.evt |
| Size (bytes) | 550,684,800 | 129,133,440 |
| Size | 525.2 MB | 123.2 MB |
| Events in quadrant A | 6,464,048 | 854,345 |
| Events in quadrant B | 3,991,642 | 891,756 |
| Events in quadrant C | 3,883,970 | 846,254 |
| Events in quadrant D | 5,428,357 | 764,649 |
| Mode M0 | |||
|---|---|---|---|
| Quadrant | BADHDUFLAG | Total packets | Discarded packets |
| A | 0 | 24929 | 0 |
| B | 0 | 17431 | 0 |
| C | 0 | 17441 | 1 |
| D | 0 | 21723 | 0 |
| Mode SS | |||
|---|---|---|---|
| Quadrant | BADHDUFLAG | Total packets | Discarded packets |
| A | 0 | 158 | 0 |
| B | 0 | 158 | 0 |
| C | 0 | 158 | 0 |
| D | 0 | 158 | 0 |
| Quadrant | Total seconds | Saturated seconds | Saturation percentage |
|---|---|---|---|
| A | 7954 | 38 | 0.477747% |
| B | 7955 | 64 | 0.804525% |
| C | 7954 | 88 | 1.106362% |
| D | 7954 | 162 | 2.036711% |
Noise dominated data is calculated using 1-second bins in cleaned event files. If a bin has >2000 counts, and if more than 50% of those come from <1% of pixels, then it is considered to be noise-dominated and hence unusable.
| Quadrant | # 1 sec bins | Bins with >0 counts | Bins with >2000 counts | High rate bins dominated by noise | Noise dominated (total time) | Noise dominated (detector-on time) | Marked lightcurve |
|---|---|---|---|---|---|---|---|
| A | 7954 | 7954 | 2 | 2 | 0.03% | 0.03% | 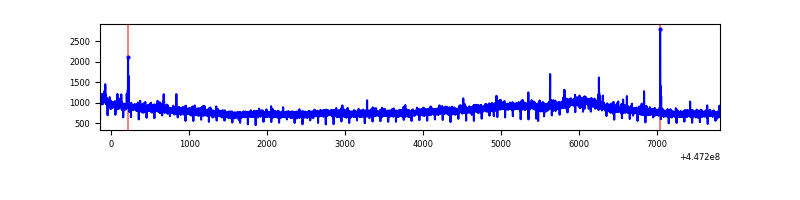 |
| B | 7955 | 7955 | 30 | 30 | 0.38% | 0.38% | 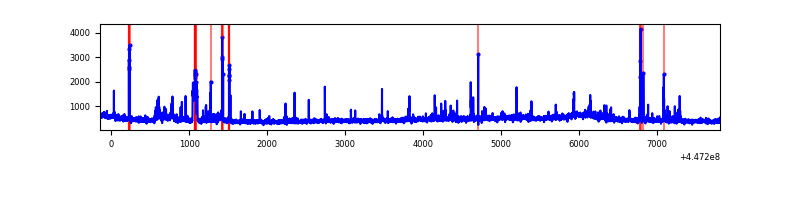 |
| C | 7954 | 7954 | 55 | 55 | 0.69% | 0.69% | 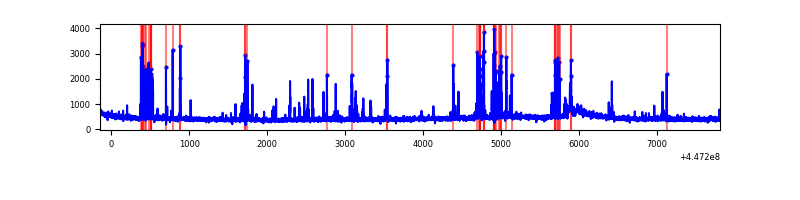 |
| D | 7954 | 7954 | 96 | 96 | 1.21% | 1.21% | 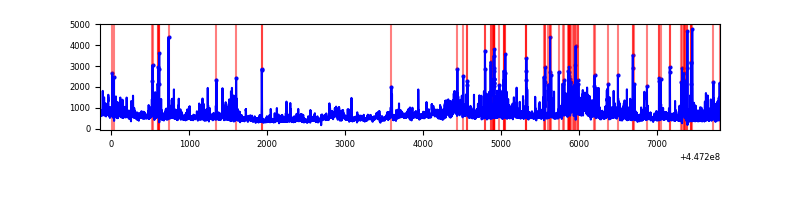 |
Top three noisy pixels from each quadrant. If the there are fewer than three noisy pixels in the level2.evt file, extra rows are filled as -1
| Pixel properties | Quadrant properties | ||||||
|---|---|---|---|---|---|---|---|
| Quadrant | DetID | PixID | Counts | Sigma | Mean | Median | Sigma |
| A | 10 | 83 | 3030282 | 16485.91 | 875 | 855 | 183.8 |
| A | 0 | 243 | 31646 | 167.56 | 875 | 855 | 183.8 |
| A | 0 | 227 | 10669 | 53.41 | 875 | 855 | 183.8 |
| B | 12 | 18 | 165073 | 948.38 | 885 | 859 | 173.2 |
| B | 5 | 172 | 66714 | 380.33 | 885 | 859 | 173.2 |
| B | 3 | 112 | 61976 | 352.97 | 885 | 859 | 173.2 |
| C | 14 | 254 | 462775 | 2238.98 | 872 | 876 | 206.3 |
| C | 13 | 61 | 5994 | 24.81 | 872 | 876 | 206.3 |
| C | 12 | 2 | 5571 | 22.76 | 872 | 876 | 206.3 |
| D | 1 | 52 | 911856 | 4183.85 | 862 | 832 | 217.7 |
| D | 11 | 241 | 633860 | 2907.16 | 862 | 832 | 217.7 |
| D | 2 | 249 | 176961 | 808.87 | 862 | 832 | 217.7 |
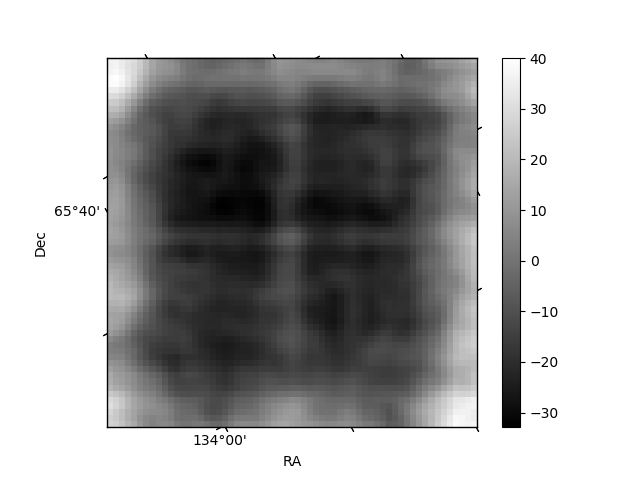
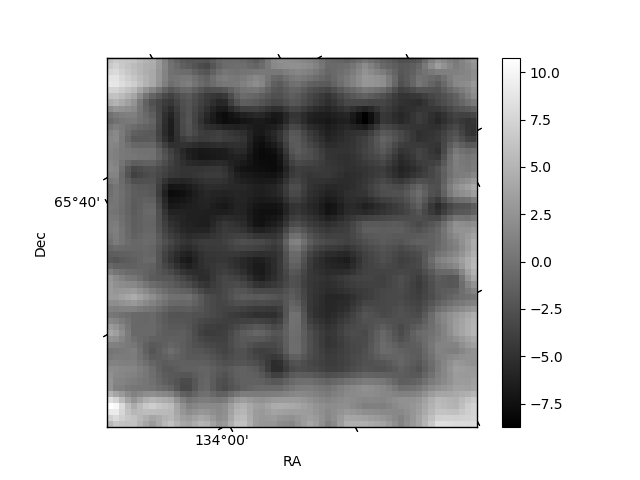
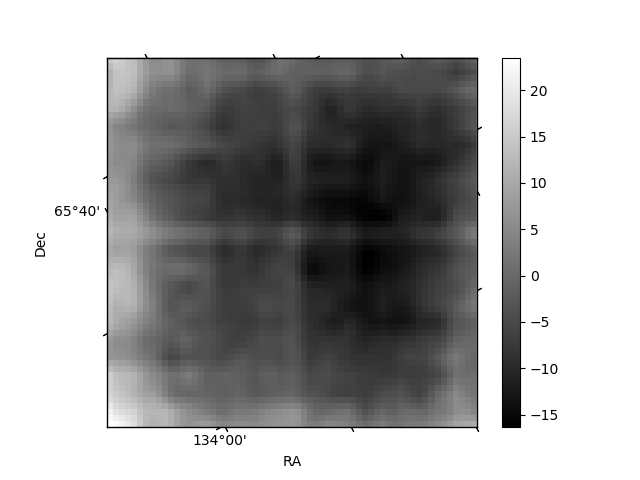
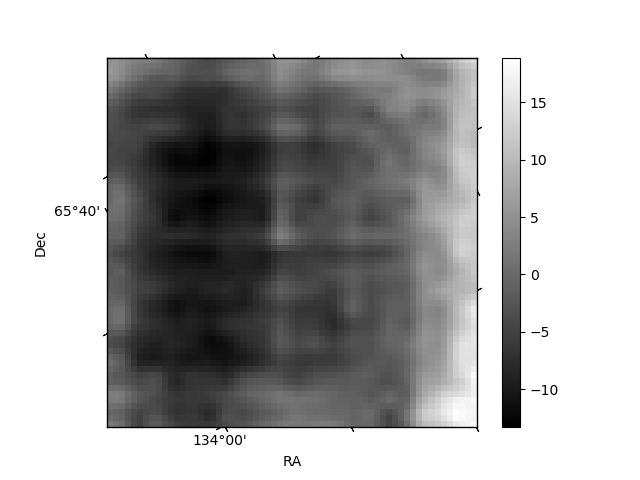
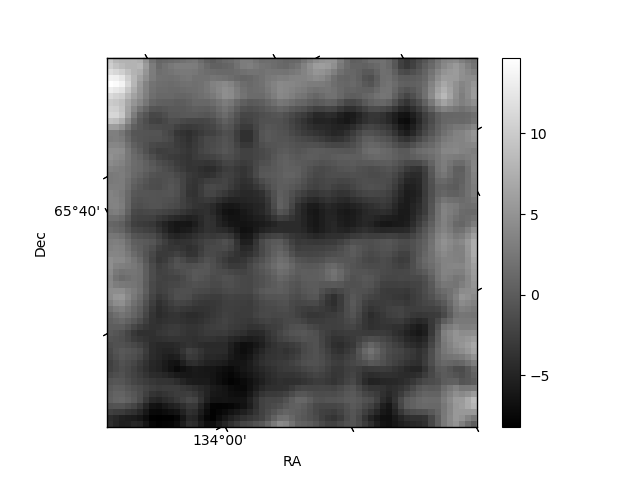
Histogram calculated using DETX and DETY for each event in the final _common_clean file
| Quadrant A | 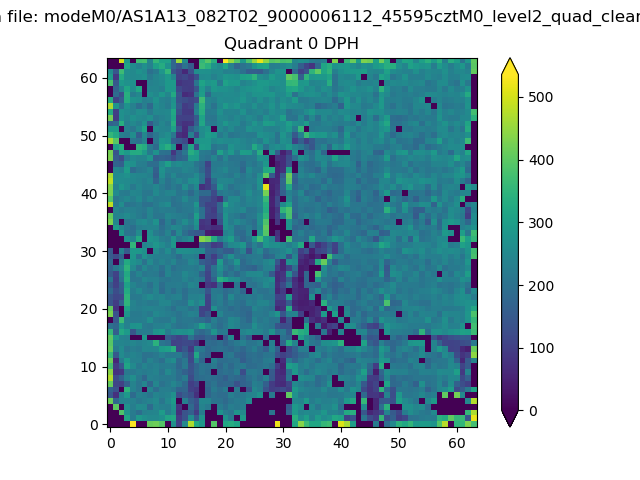 |
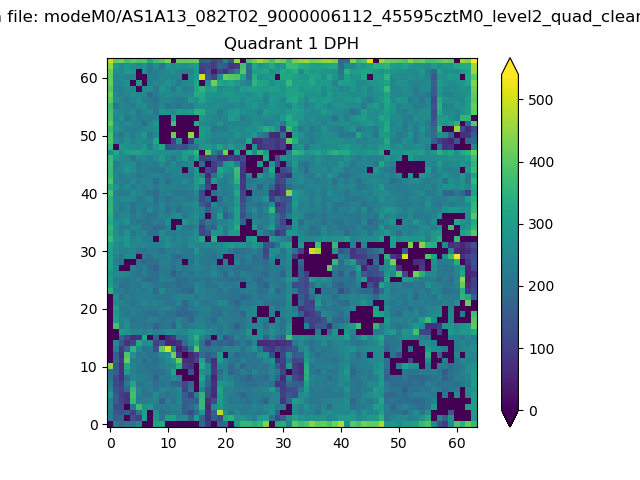 |
Quadrant B |
|---|---|---|---|
| Quadrant D | 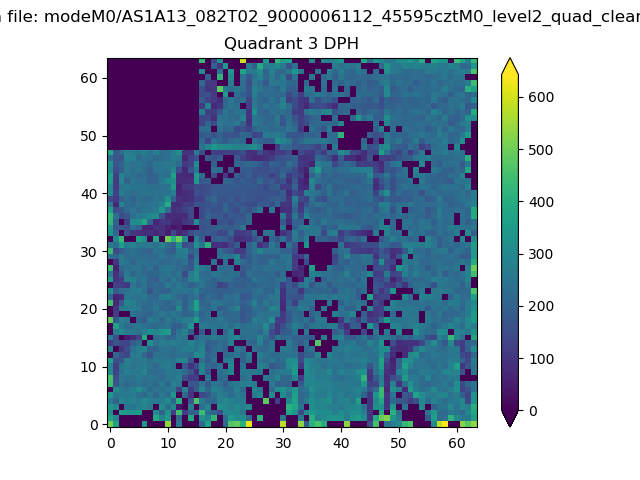 |
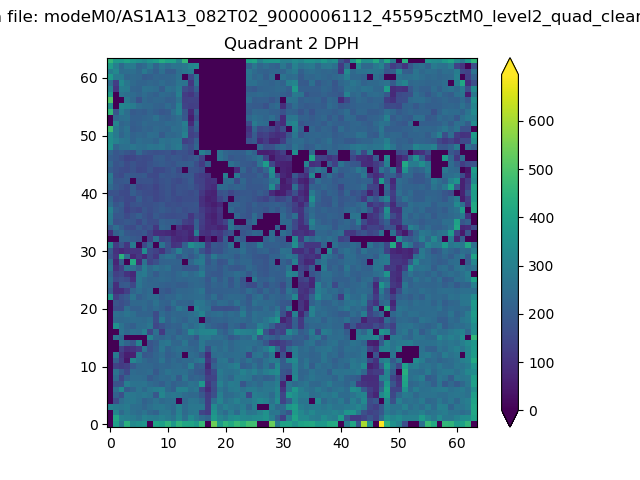 |
Quadrant C |
| Plot type | Count rate plots | Images |
|---|---|---|
| Comparison with Poisson distribution Blue bars denote a histogram of data divided into 1 sec bins. Red curve is a Poisson curve with rate = median count rate of data. |
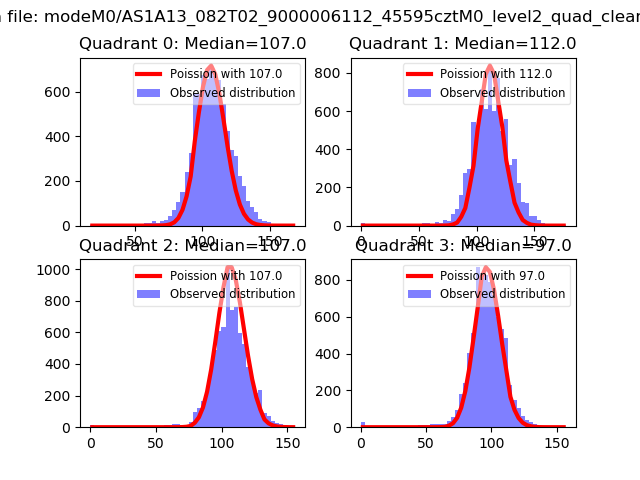 |
 |
| Quadrant-wise count rates Data is divided into 100 sec bins |
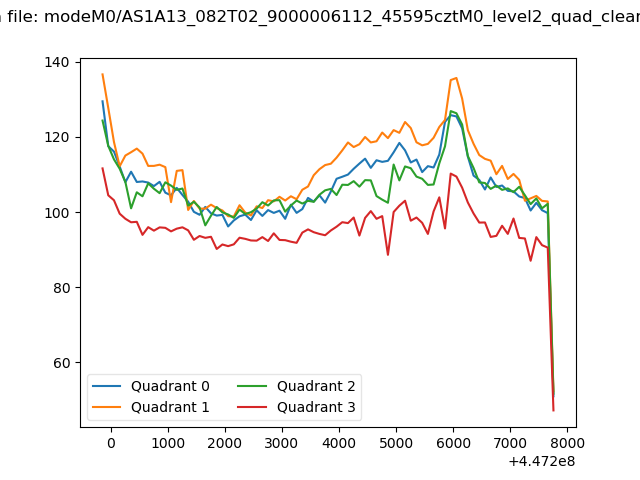 |
|
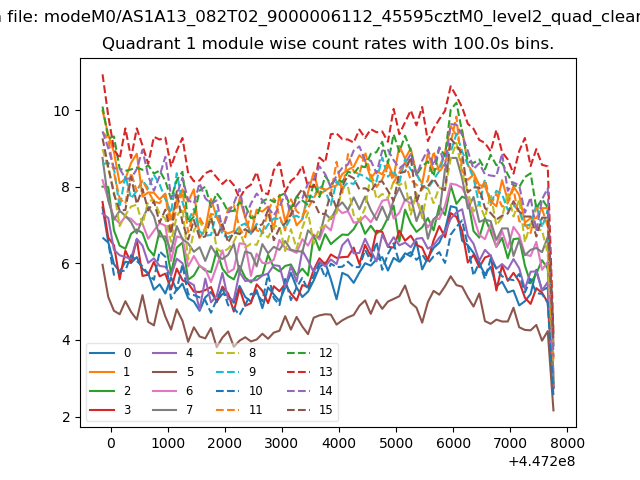
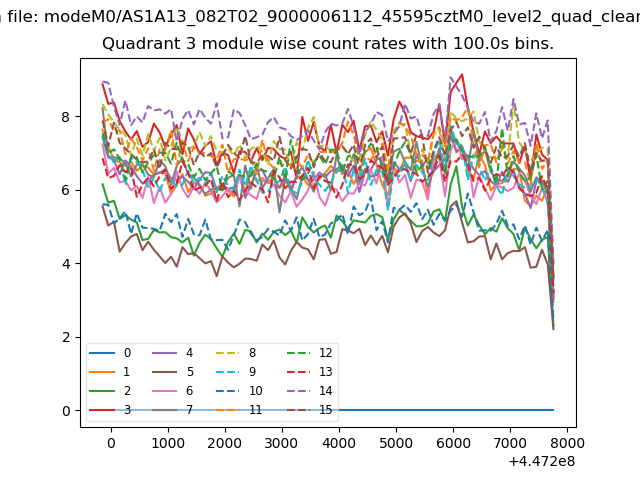
| Module-wise count rates for Quadrant A Data is divided into 100 sec bins |
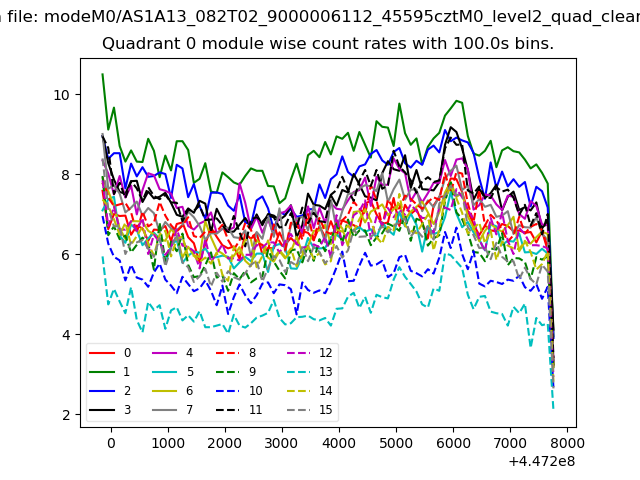 |
 |
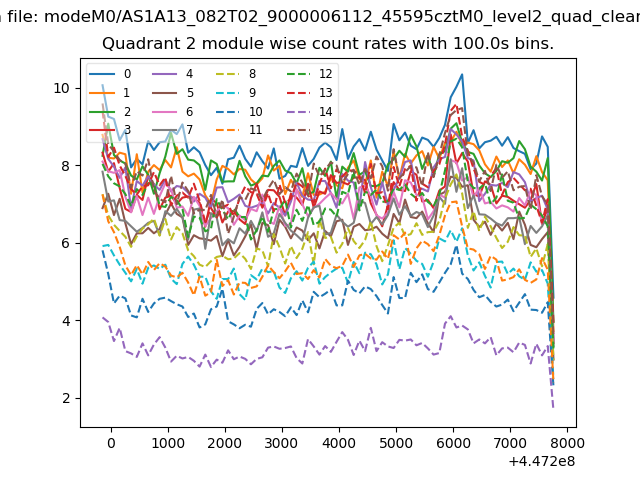
| Module-wise count rates for Quadrant B Data is divided into 100 sec bins |
 |
 |
| Module-wise count rates for Quadrant C Data is divided into 100 sec bins |
 |
 |
| Module-wise count rates for Quadrant D Data is divided into 100 sec bins |
 |
 |
| Parameter | Plot |
|---|---|
| CZT HV Monitor | 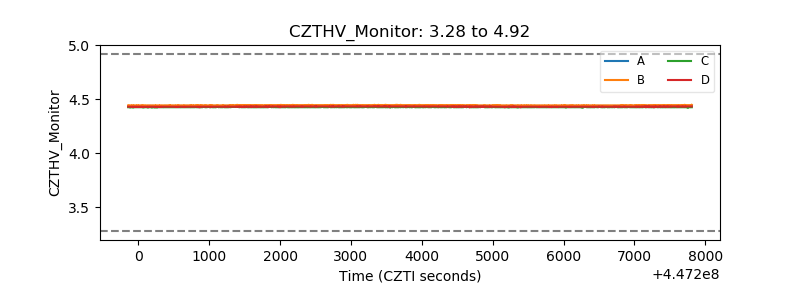 |
| D_VDD | 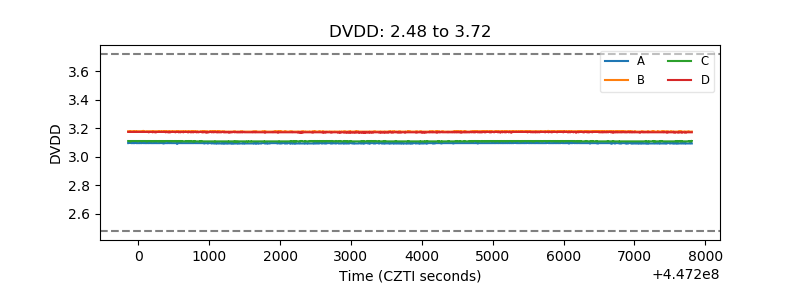 |
| Temperature 1 | 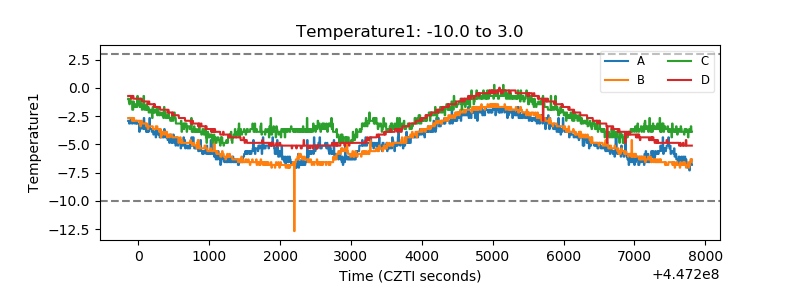 |
| Veto HV Monitor | 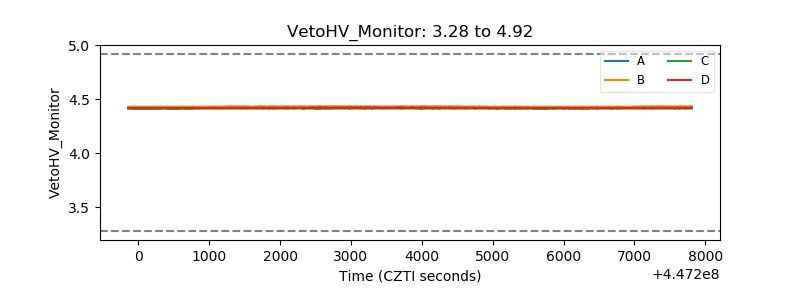 |
| Veto LLD | 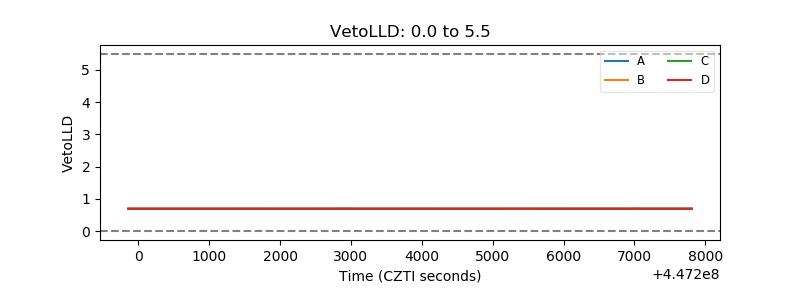 |
| Alpha Counter | 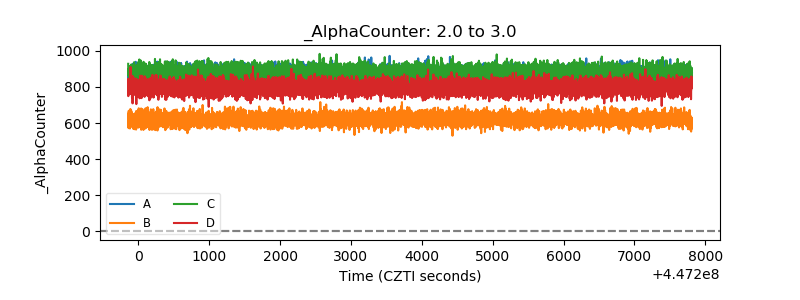 |
| _CPM_Rate | 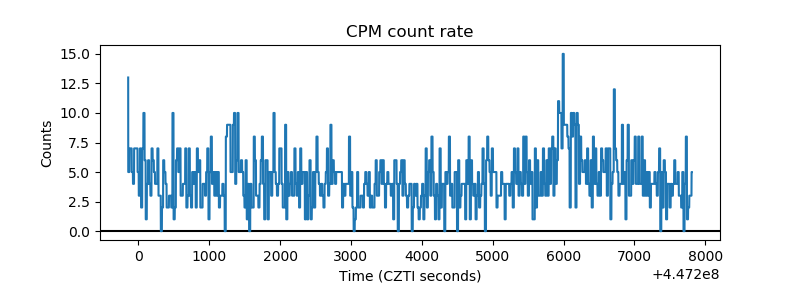 |
| CZT Counter | 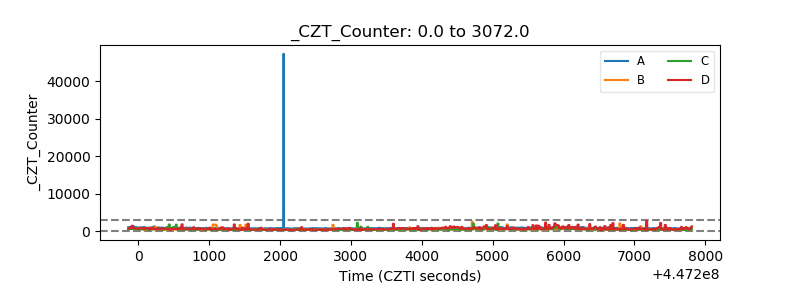 |
| +2.5 Volts monitor | 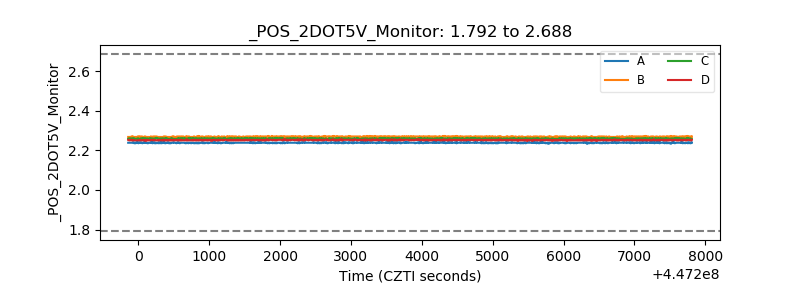 |
| +5 Volts monitor | 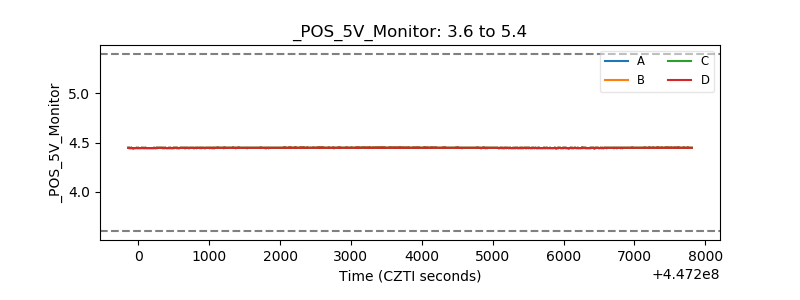 |
| _ROLL_ROT | 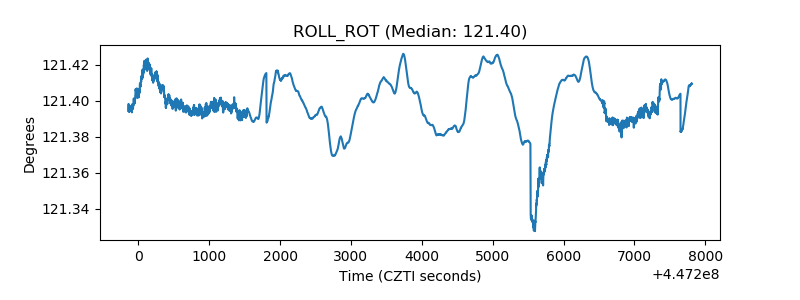 |
| _Roll_DEC | 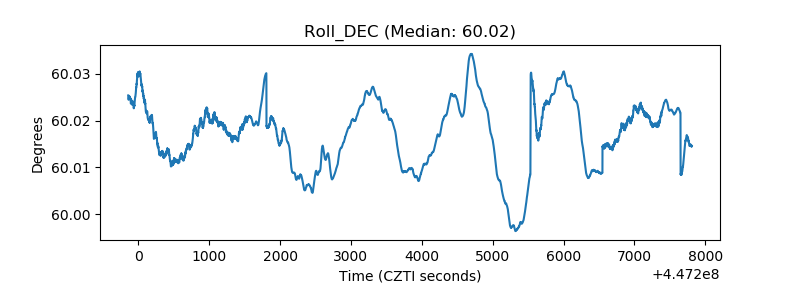 |
| _Roll_RA | 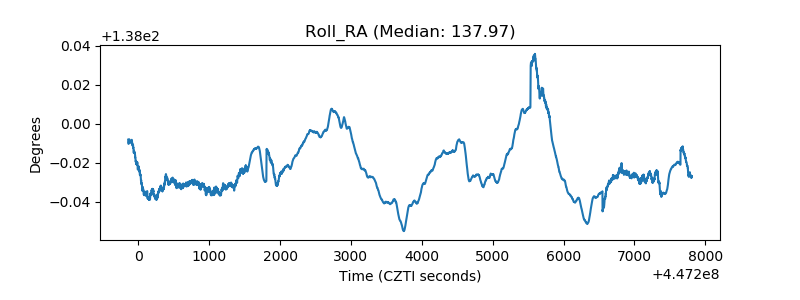 |
| Veto Counter | 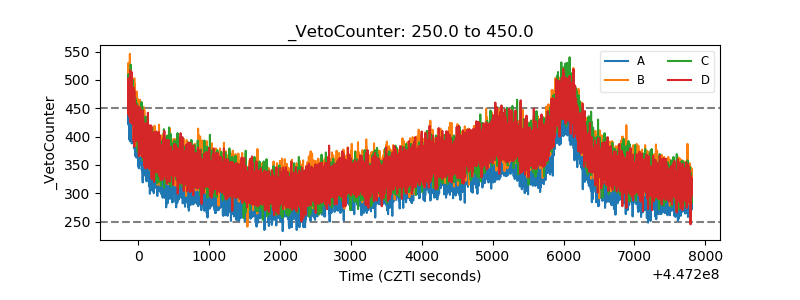 |