| Param | Original file | Final file |
|---|---|---|
| Filename | modeM0/AS1A13_082T02_9000006112_45596cztM0_level2.fits | modeM0/AS1A13_082T02_9000006112_45596cztM0_level2_quad_clean.evt |
| Size (bytes) | 546,076,800 | 132,799,680 |
| Size | 520.8 MB | 126.6 MB |
| Events in quadrant A | 6,558,758 | 874,895 |
| Events in quadrant B | 3,951,470 | 916,828 |
| Events in quadrant C | 3,777,398 | 878,959 |
| Events in quadrant D | 5,292,658 | 782,236 |
| Mode M0 | |||
|---|---|---|---|
| Quadrant | BADHDUFLAG | Total packets | Discarded packets |
| A | 0 | 25447 | 2 |
| B | 0 | 17575 | 0 |
| C | 0 | 17282 | 0 |
| D | 0 | 21550 | 0 |
| Mode SS | |||
|---|---|---|---|
| Quadrant | BADHDUFLAG | Total packets | Discarded packets |
| A | 0 | 164 | 0 |
| B | 0 | 164 | 0 |
| C | 0 | 164 | 0 |
| D | 0 | 164 | 0 |
| Quadrant | Total seconds | Saturated seconds | Saturation percentage |
|---|---|---|---|
| A | 8171 | 82 | 1.003549% |
| B | 8172 | 88 | 1.076848% |
| C | 8172 | 29 | 0.354870% |
| D | 8172 | 211 | 2.581987% |
Noise dominated data is calculated using 1-second bins in cleaned event files. If a bin has >2000 counts, and if more than 50% of those come from <1% of pixels, then it is considered to be noise-dominated and hence unusable.
| Quadrant | # 1 sec bins | Bins with >0 counts | Bins with >2000 counts | High rate bins dominated by noise | Noise dominated (total time) | Noise dominated (detector-on time) | Marked lightcurve |
|---|---|---|---|---|---|---|---|
| A | 8171 | 8171 | 1 | 1 | 0.01% | 0.01% | 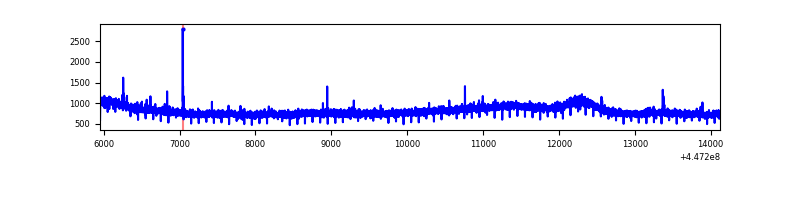 |
| B | 8172 | 8172 | 20 | 20 | 0.24% | 0.24% | 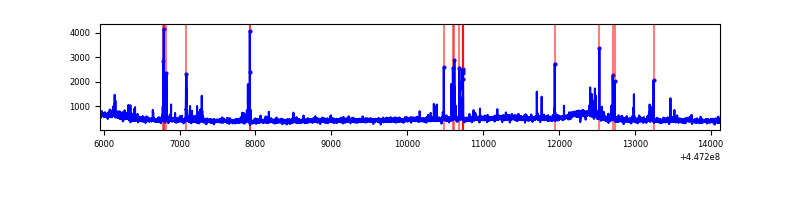 |
| C | 8172 | 8172 | 13 | 13 | 0.16% | 0.16% | 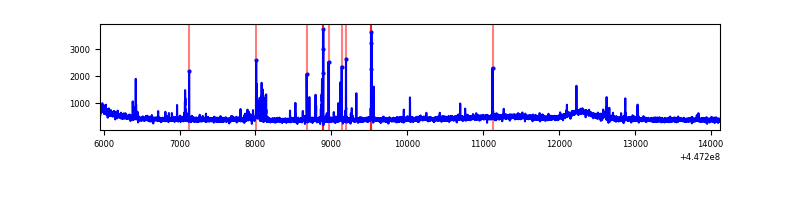 |
| D | 8172 | 8172 | 118 | 118 | 1.44% | 1.44% | 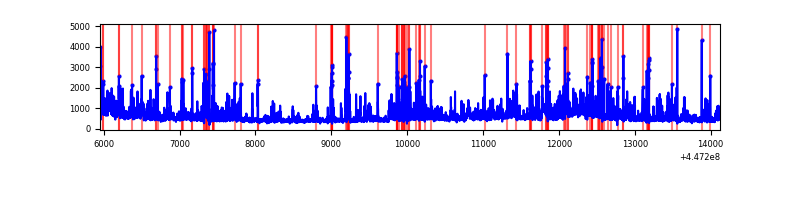 |
Top three noisy pixels from each quadrant. If the there are fewer than three noisy pixels in the level2.evt file, extra rows are filled as -1
| Pixel properties | Quadrant properties | ||||||
|---|---|---|---|---|---|---|---|
| Quadrant | DetID | PixID | Counts | Sigma | Mean | Median | Sigma |
| A | 10 | 83 | 3015475 | 15784.11 | 908 | 886 | 191.0 |
| A | 0 | 243 | 19065 | 95.18 | 908 | 886 | 191.0 |
| A | 3 | 137 | 10520 | 50.44 | 908 | 886 | 191.0 |
| B | 5 | 172 | 154555 | 857.25 | 917 | 889 | 179.3 |
| B | 3 | 112 | 42829 | 233.97 | 917 | 889 | 179.3 |
| B | 0 | 183 | 28737 | 155.35 | 917 | 889 | 179.3 |
| C | 14 | 254 | 151348 | 701.3 | 909 | 912 | 214.5 |
| C | 12 | 2 | 71222 | 327.77 | 909 | 912 | 214.5 |
| C | 3 | 233 | 9040 | 37.89 | 909 | 912 | 214.5 |
| D | 1 | 52 | 1163697 | 5195.04 | 891 | 861 | 223.8 |
| D | 2 | 249 | 205806 | 915.6 | 891 | 861 | 223.8 |
| D | 11 | 241 | 140885 | 625.57 | 891 | 861 | 223.8 |
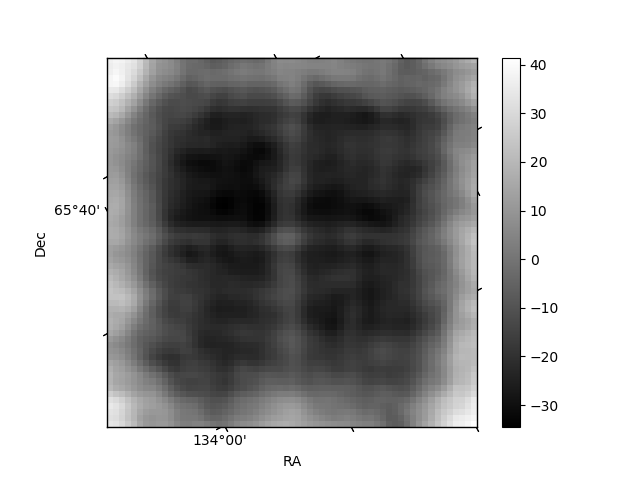
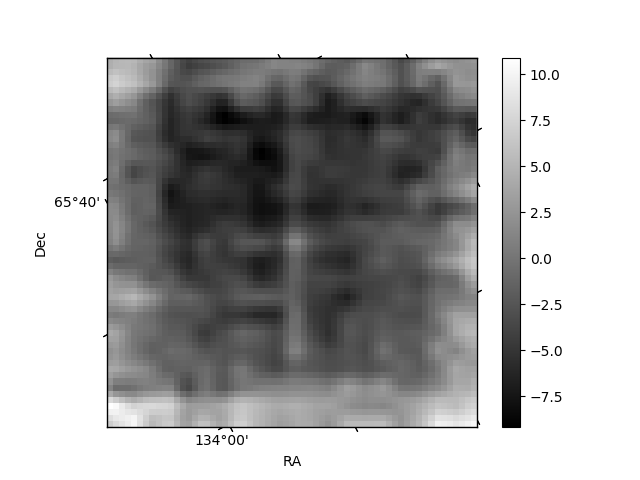
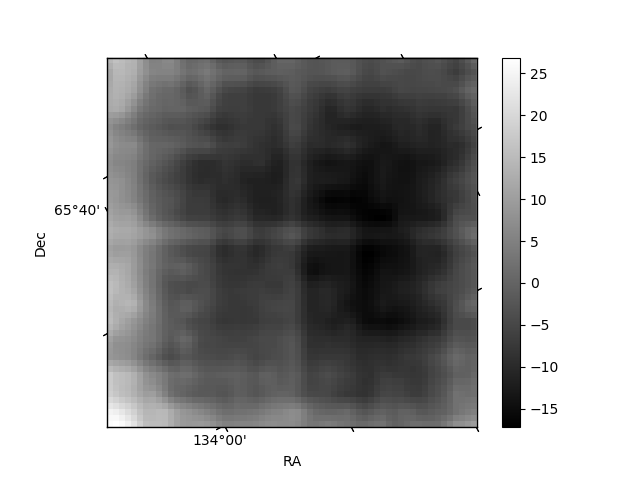
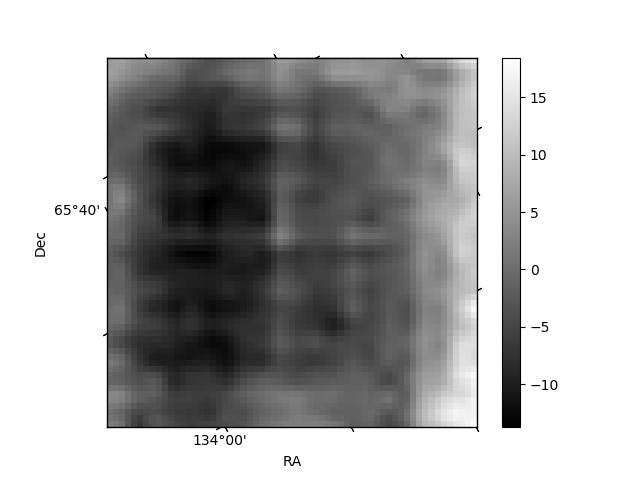
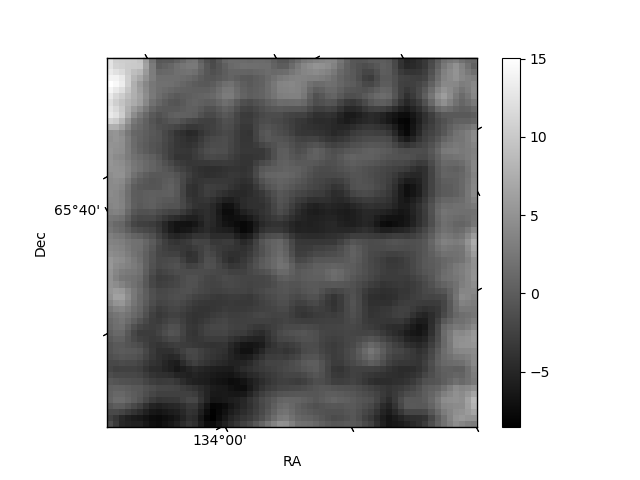
Histogram calculated using DETX and DETY for each event in the final _common_clean file
| Quadrant A | 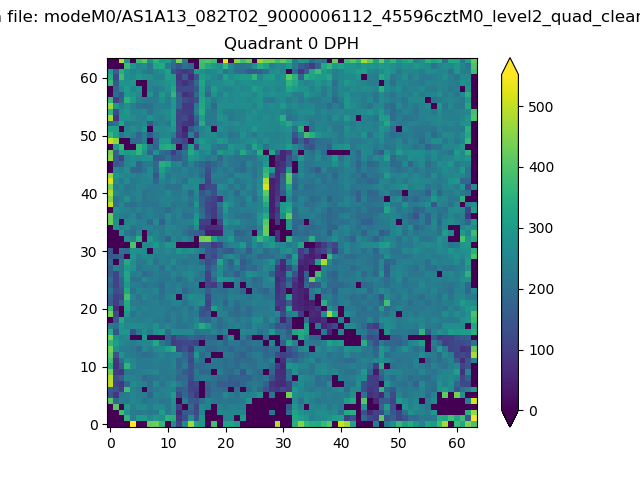 |
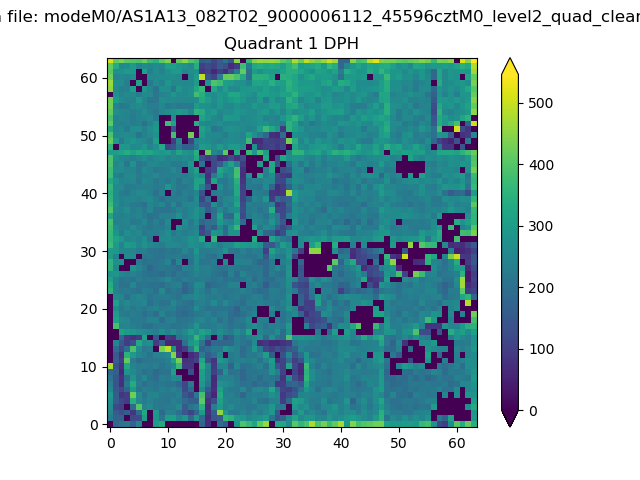 |
Quadrant B |
|---|---|---|---|
| Quadrant D | 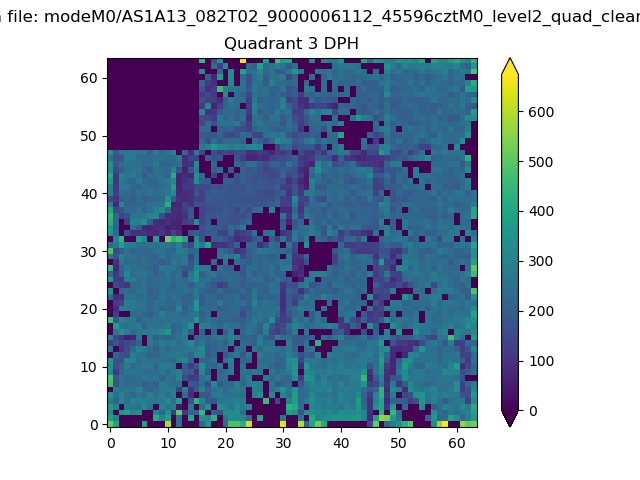 |
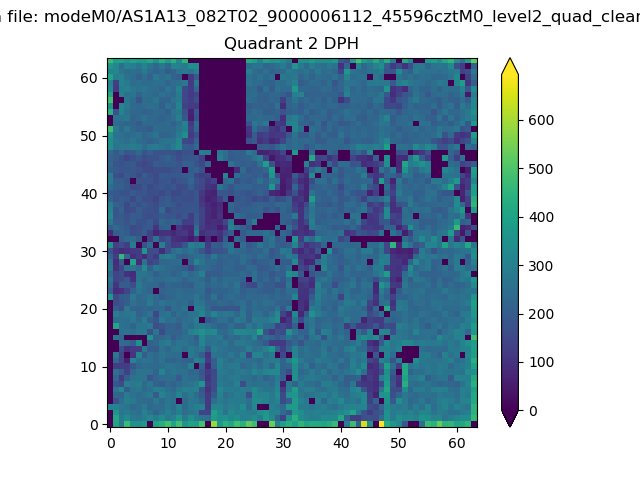 |
Quadrant C |
| Plot type | Count rate plots | Images |
|---|---|---|
| Comparison with Poisson distribution Blue bars denote a histogram of data divided into 1 sec bins. Red curve is a Poisson curve with rate = median count rate of data. |
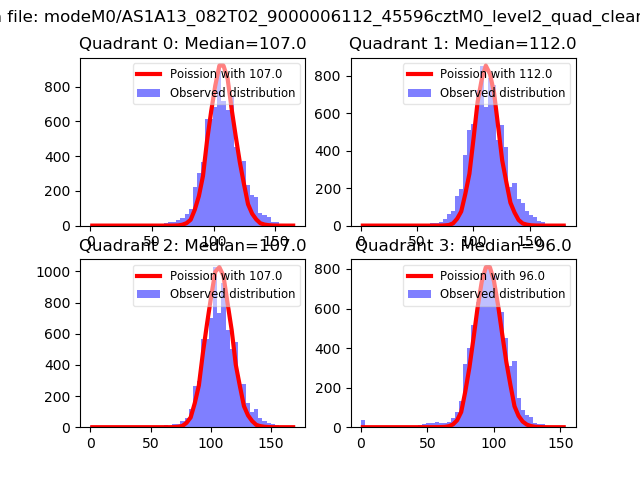 |
 |
| Quadrant-wise count rates Data is divided into 100 sec bins |
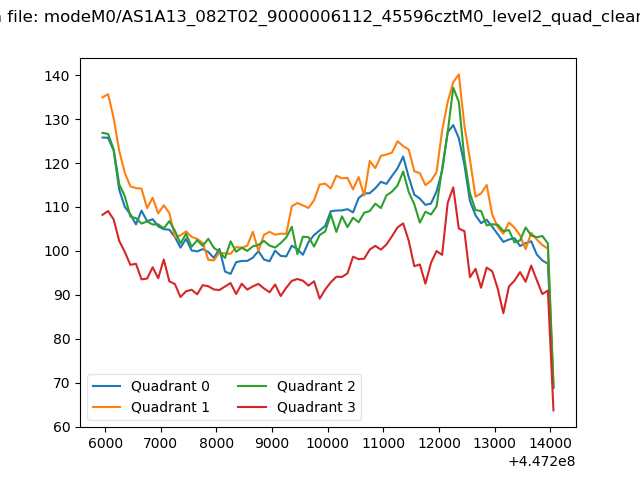 |
|
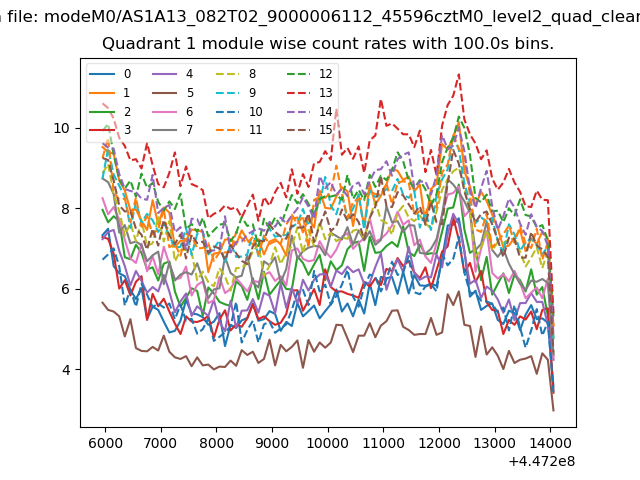
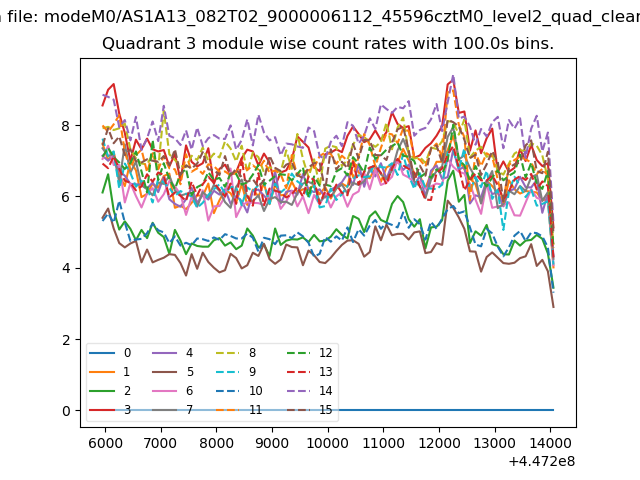
| Module-wise count rates for Quadrant A Data is divided into 100 sec bins |
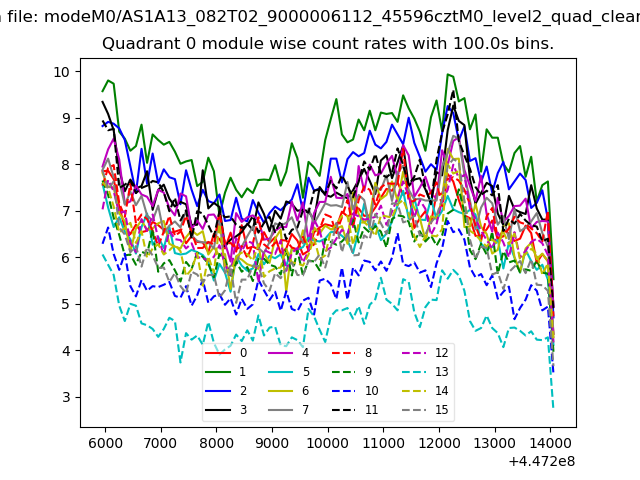 |
 |
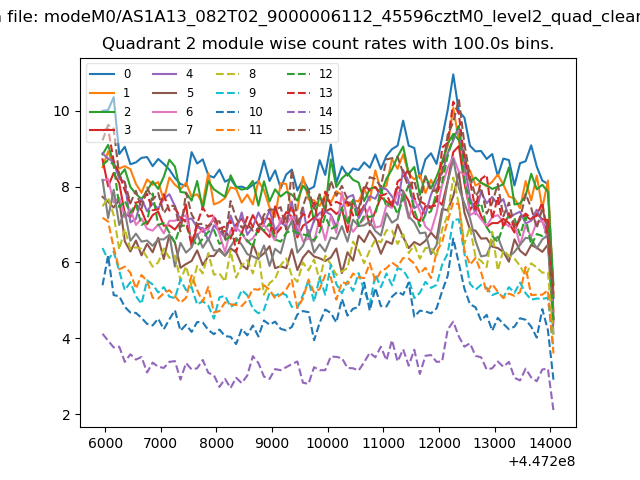
| Module-wise count rates for Quadrant B Data is divided into 100 sec bins |
 |
 |
| Module-wise count rates for Quadrant C Data is divided into 100 sec bins |
 |
 |
| Module-wise count rates for Quadrant D Data is divided into 100 sec bins |
 |
 |
| Parameter | Plot |
|---|---|
| CZT HV Monitor |  |
| D_VDD | 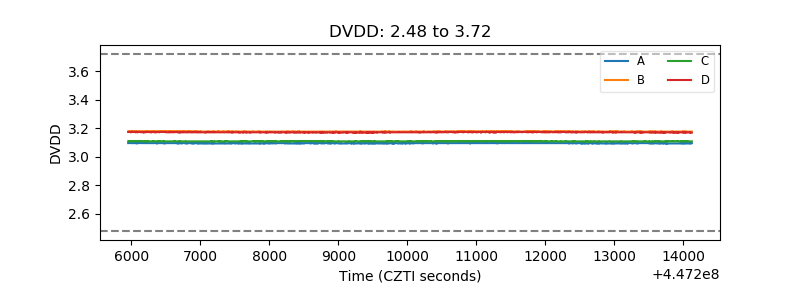 |
| Temperature 1 | 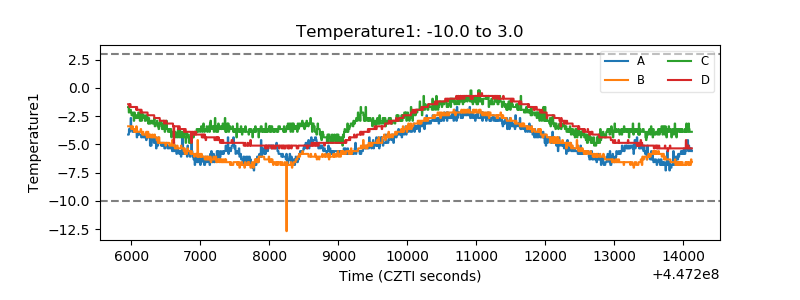 |
| Veto HV Monitor | 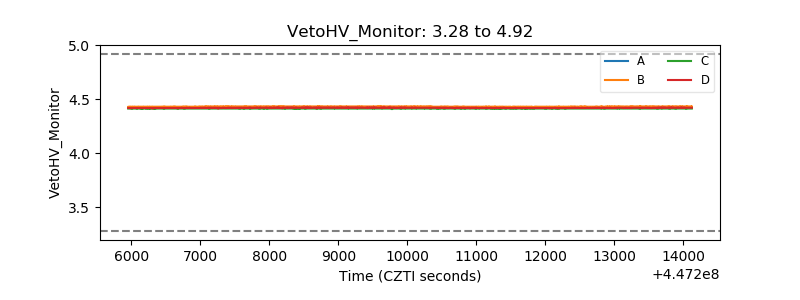 |
| Veto LLD | 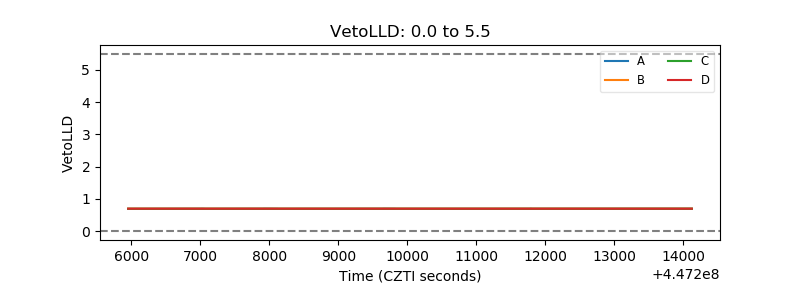 |
| Alpha Counter | 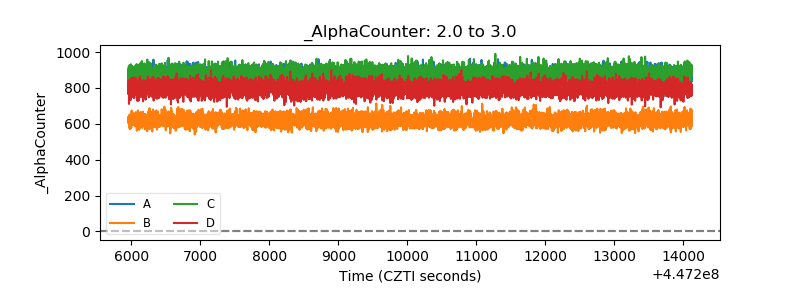 |
| _CPM_Rate | 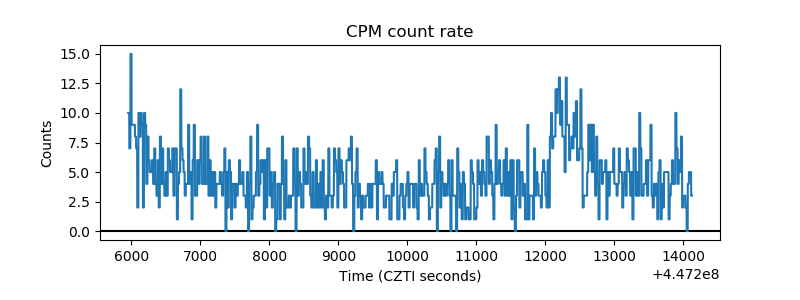 |
| CZT Counter | 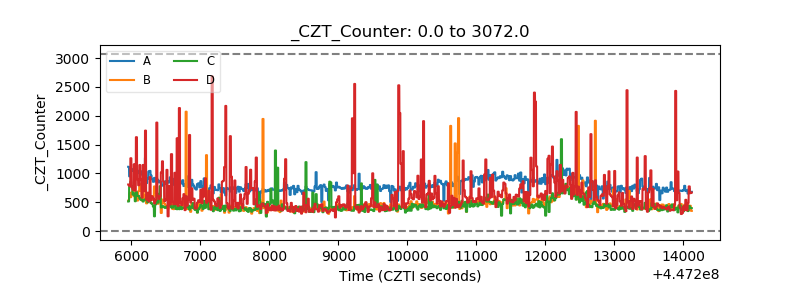 |
| +2.5 Volts monitor | 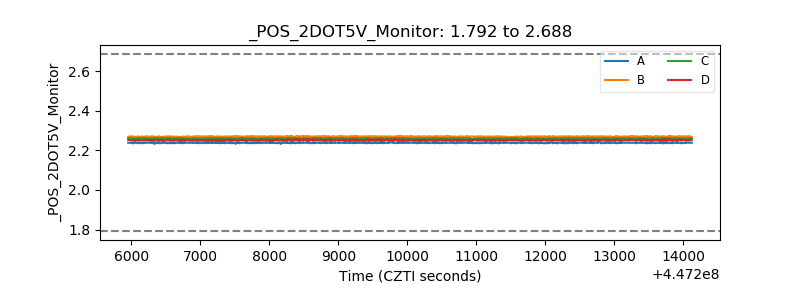 |
| +5 Volts monitor | 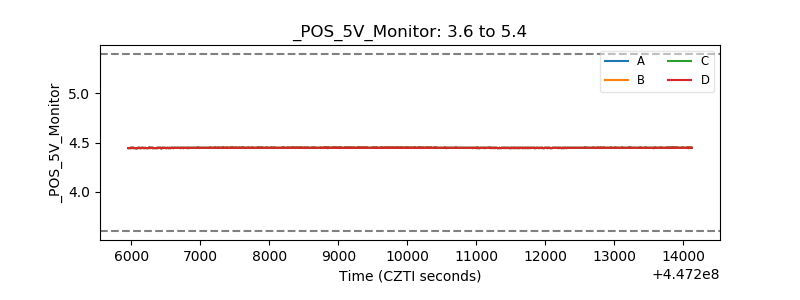 |
| _ROLL_ROT | 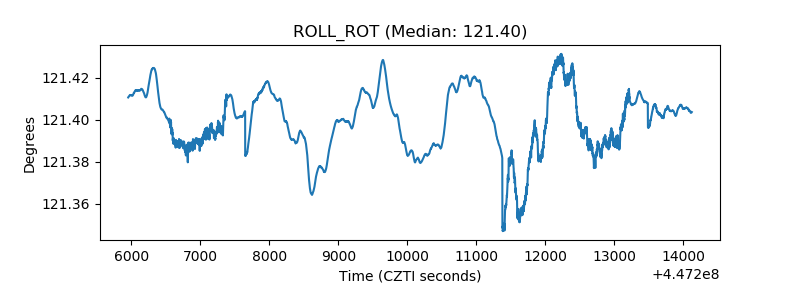 |
| _Roll_DEC | 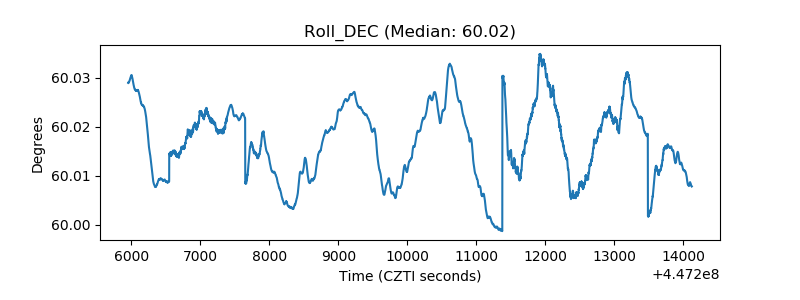 |
| _Roll_RA | 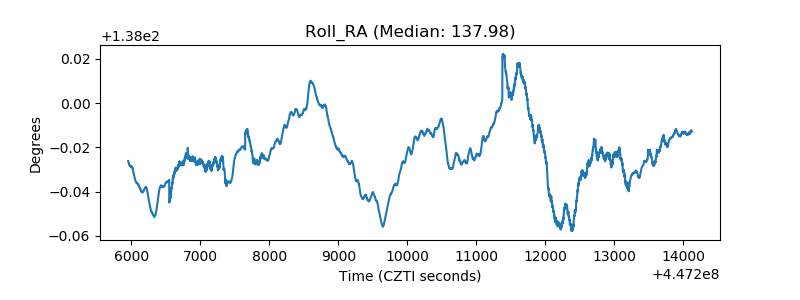 |
| Veto Counter | 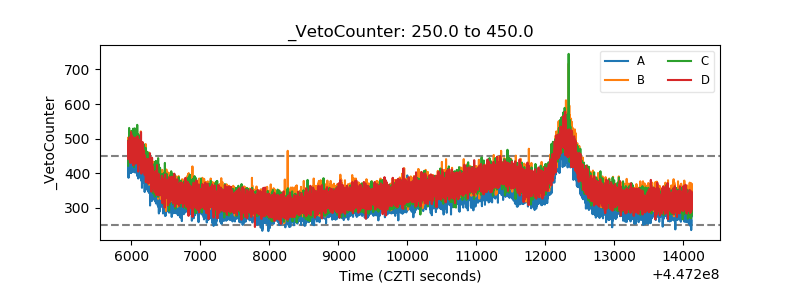 |