| Param | Original file | Final file |
|---|---|---|
| Filename | modeM0/AS1A13_082T02_9000006112_45598cztM0_level2.fits | modeM0/AS1A13_082T02_9000006112_45598cztM0_level2_quad_clean.evt |
| Size (bytes) | 791,735,040 | 182,692,800 |
| Size | 755.1 MB | 174.2 MB |
| Events in quadrant A | 9,208,380 | 1,206,571 |
| Events in quadrant B | 6,154,869 | 1,235,582 |
| Events in quadrant C | 5,352,422 | 1,215,106 |
| Events in quadrant D | 7,699,142 | 1,076,445 |
| Mode M0 | |||
|---|---|---|---|
| Quadrant | BADHDUFLAG | Total packets | Discarded packets |
| A | 0 | 35362 | 1 |
| B | 0 | 26581 | 2 |
| C | 0 | 24506 | 1 |
| D | 0 | 31064 | 1 |
| Mode M9 | |||
|---|---|---|---|
| Quadrant | BADHDUFLAG | Total packets | Discarded packets |
| A | 0 | 3 | 0 |
| B | 0 | 3 | 0 |
| C | 0 | 3 | 0 |
| D | 0 | 3 | 0 |
| Mode SS | |||
|---|---|---|---|
| Quadrant | BADHDUFLAG | Total packets | Discarded packets |
| A | 0 | 232 | 0 |
| B | 0 | 232 | 0 |
| C | 0 | 232 | 0 |
| D | 0 | 232 | 0 |
| Quadrant | Total seconds | Saturated seconds | Saturation percentage |
|---|---|---|---|
| A | 11529 | 186 | 1.613323% |
| B | 11529 | 446 | 3.868506% |
| C | 11529 | 105 | 0.910747% |
| D | 11529 | 428 | 3.712377% |
Noise dominated data is calculated using 1-second bins in cleaned event files. If a bin has >2000 counts, and if more than 50% of those come from <1% of pixels, then it is considered to be noise-dominated and hence unusable.
| Quadrant | # 1 sec bins | Bins with >0 counts | Bins with >2000 counts | High rate bins dominated by noise | Noise dominated (total time) | Noise dominated (detector-on time) | Marked lightcurve |
|---|---|---|---|---|---|---|---|
| A | 11834 | 11530 | 0 | 0 | 0.00% | 0.00% | 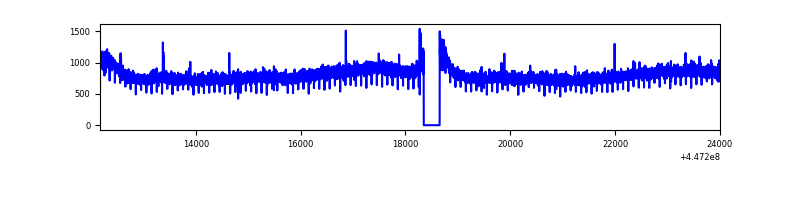 |
| B | 11834 | 11529 | 265 | 265 | 2.24% | 2.30% | 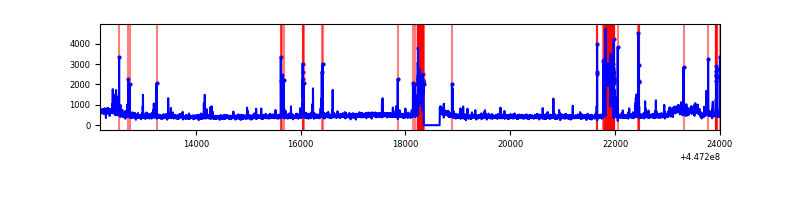 |
| C | 11834 | 11530 | 48 | 48 | 0.41% | 0.42% | 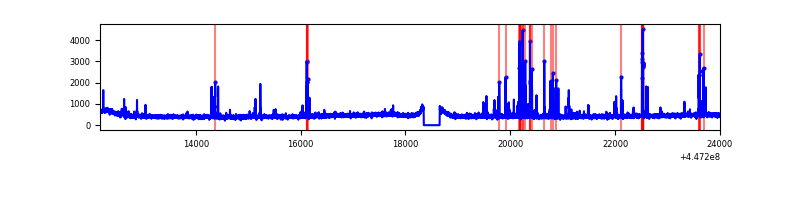 |
| D | 11834 | 11530 | 267 | 267 | 2.26% | 2.32% | 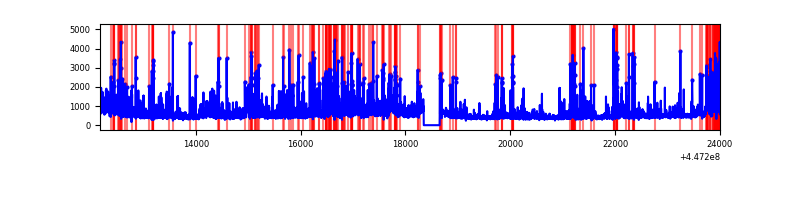 |
Top three noisy pixels from each quadrant. If the there are fewer than three noisy pixels in the level2.evt file, extra rows are filled as -1
| Pixel properties | Quadrant properties | ||||||
|---|---|---|---|---|---|---|---|
| Quadrant | DetID | PixID | Counts | Sigma | Mean | Median | Sigma |
| A | 10 | 83 | 4261387 | 16027.46 | 1273 | 1243 | 265.8 |
| A | 0 | 243 | 20920 | 74.03 | 1273 | 1243 | 265.8 |
| A | 3 | 137 | 14986 | 51.7 | 1273 | 1243 | 265.8 |
| B | 15 | 201 | 606917 | 2448.55 | 1256 | 1214 | 247.4 |
| B | 5 | 172 | 455837 | 1837.81 | 1256 | 1214 | 247.4 |
| B | 3 | 112 | 57571 | 227.82 | 1256 | 1214 | 247.4 |
| C | 14 | 254 | 402404 | 1359.58 | 1263 | 1268 | 295.0 |
| C | 3 | 233 | 15153 | 47.06 | 1263 | 1268 | 295.0 |
| C | 13 | 61 | 8599 | 24.85 | 1263 | 1268 | 295.0 |
| D | 1 | 52 | 1485821 | 4728.71 | 1242 | 1199 | 314.0 |
| D | 2 | 249 | 523938 | 1664.99 | 1242 | 1199 | 314.0 |
| D | 13 | 249 | 338047 | 1072.9 | 1242 | 1199 | 314.0 |
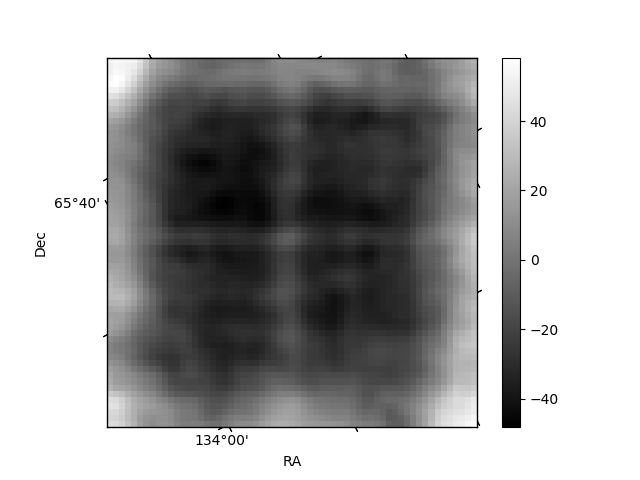
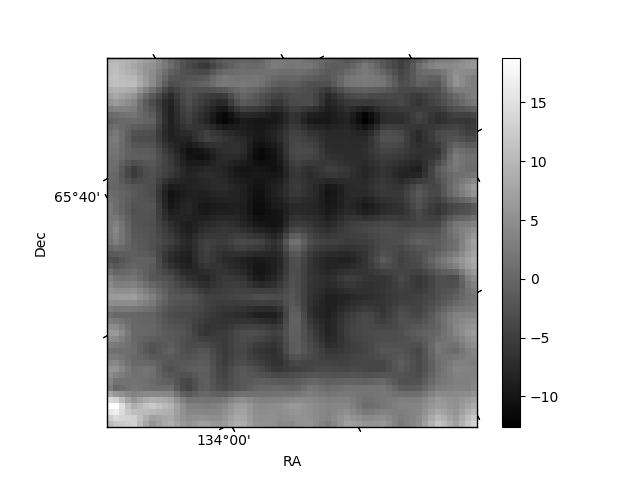
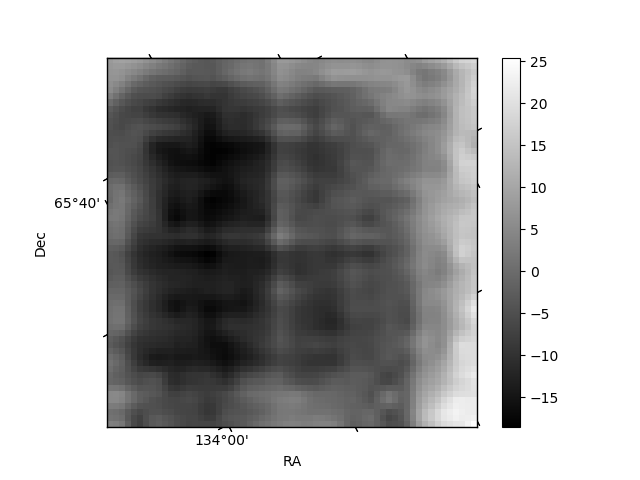
Histogram calculated using DETX and DETY for each event in the final _common_clean file
| Quadrant A | 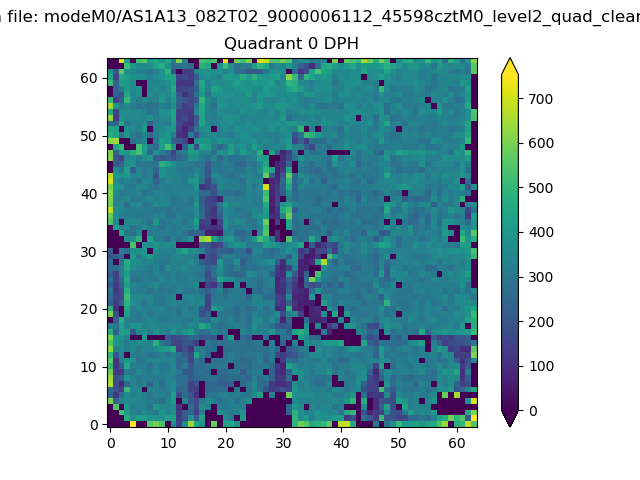 |
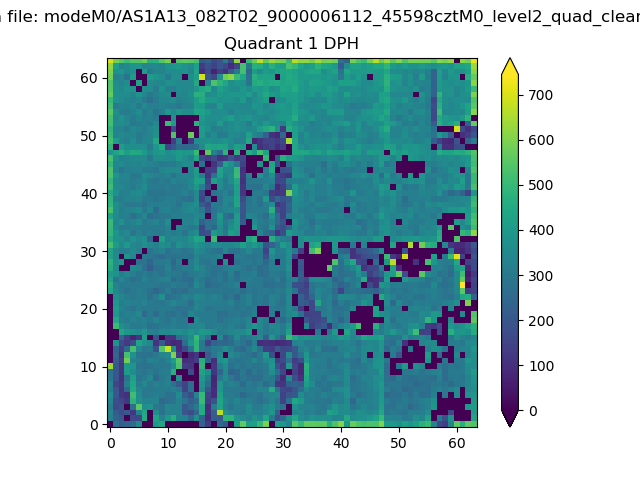 |
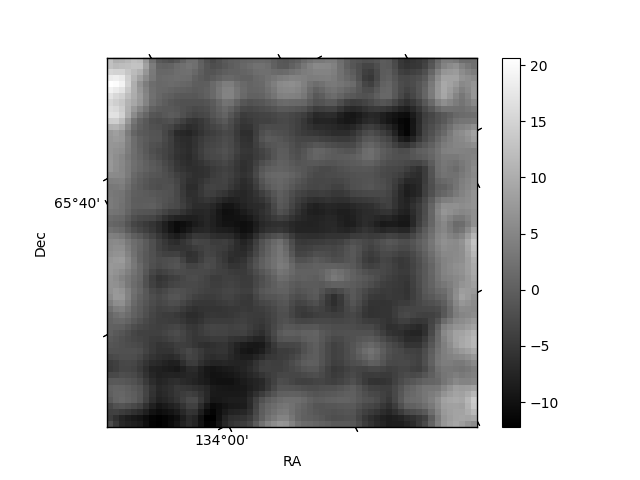
Quadrant B |
|---|---|---|---|
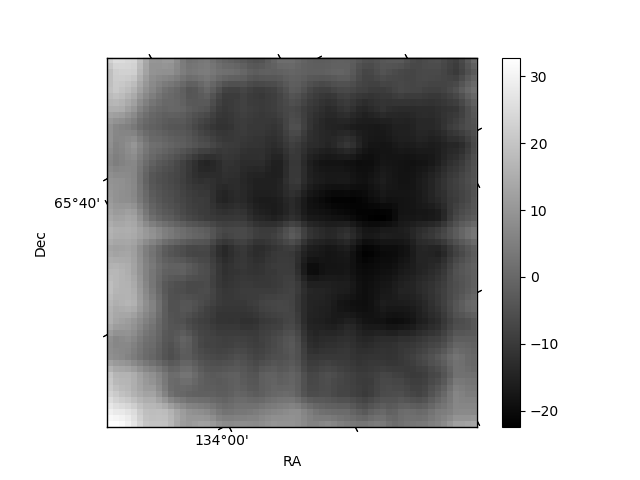
| Quadrant D | 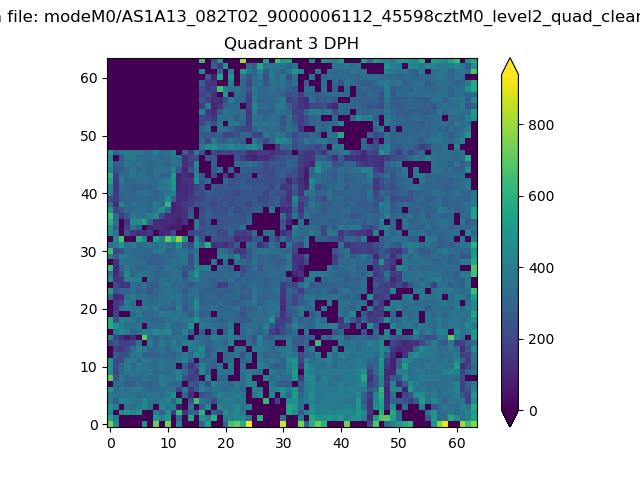 |
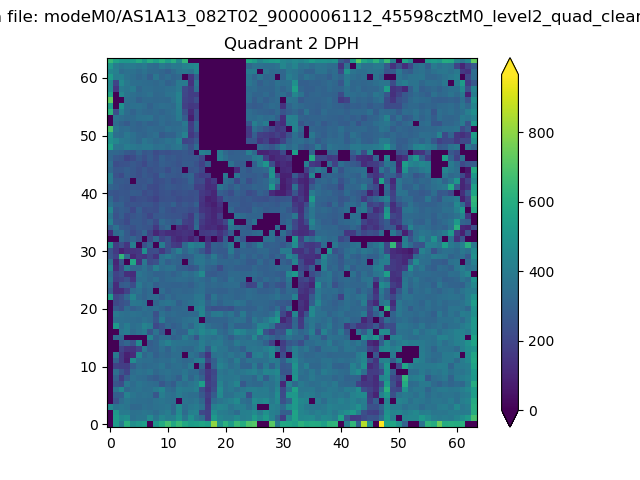 |
Quadrant C |
| Plot type | Count rate plots | Images |
|---|---|---|
| Comparison with Poisson distribution Blue bars denote a histogram of data divided into 1 sec bins. Red curve is a Poisson curve with rate = median count rate of data. |
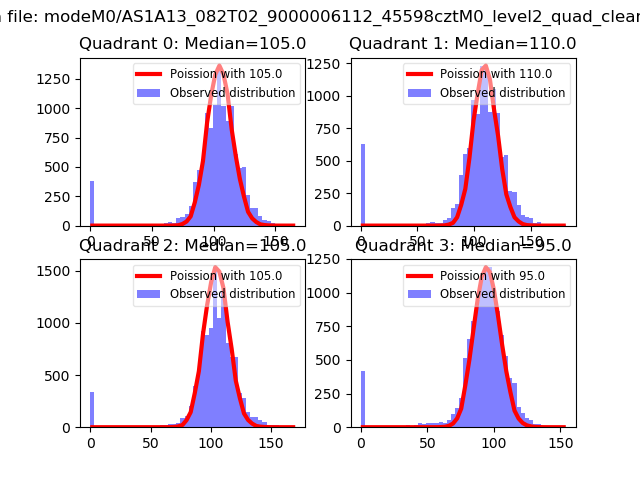 |
 |
| Quadrant-wise count rates Data is divided into 100 sec bins |
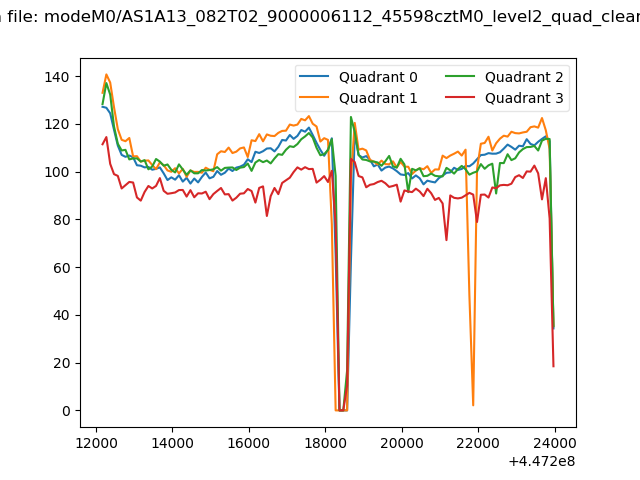 |
|
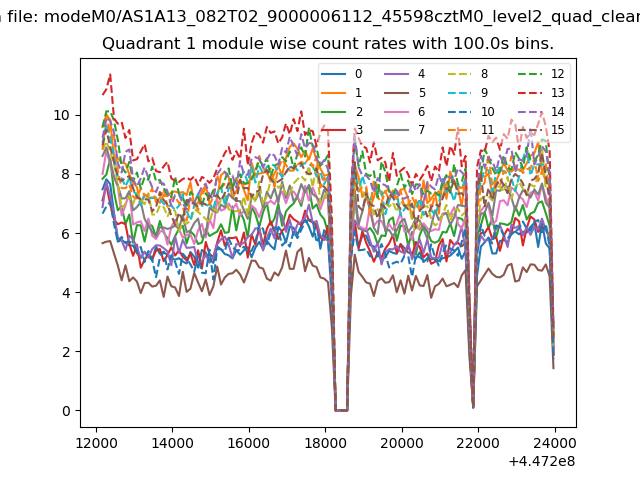
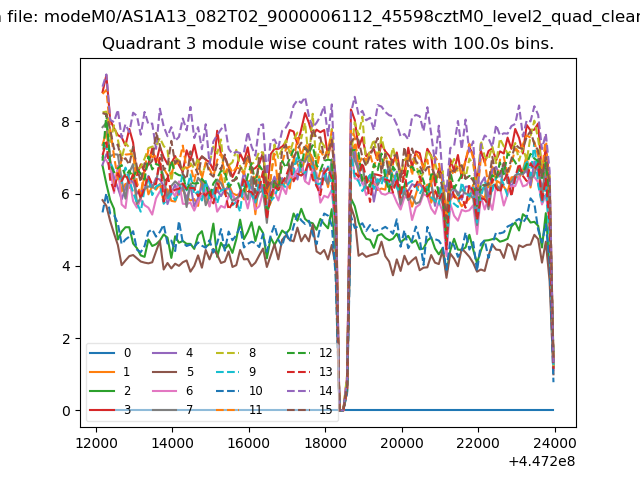
| Module-wise count rates for Quadrant A Data is divided into 100 sec bins |
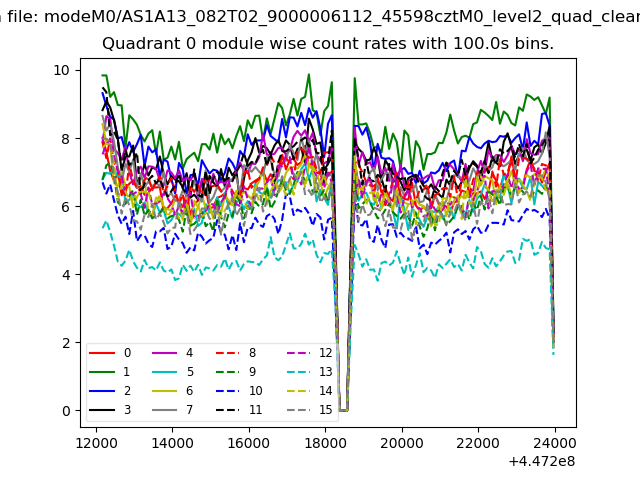 |
 |
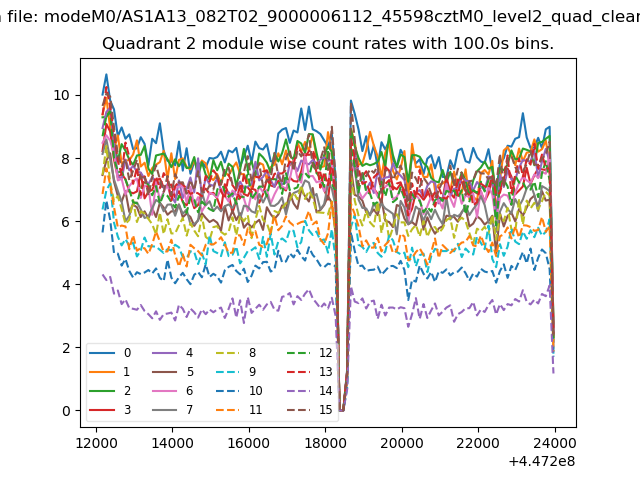
| Module-wise count rates for Quadrant B Data is divided into 100 sec bins |
 |
 |
| Module-wise count rates for Quadrant C Data is divided into 100 sec bins |
 |
 |
| Module-wise count rates for Quadrant D Data is divided into 100 sec bins |
 |
 |
| Parameter | Plot |
|---|---|
| CZT HV Monitor | 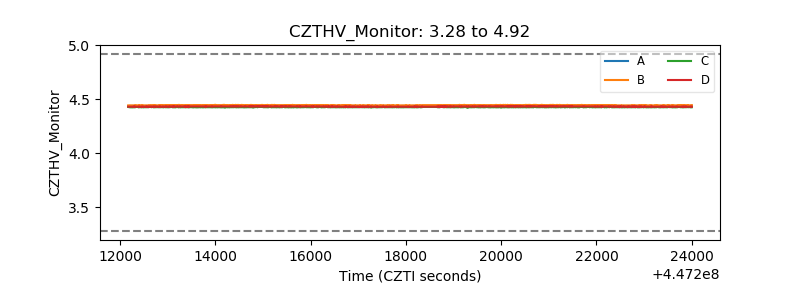 |
| D_VDD | 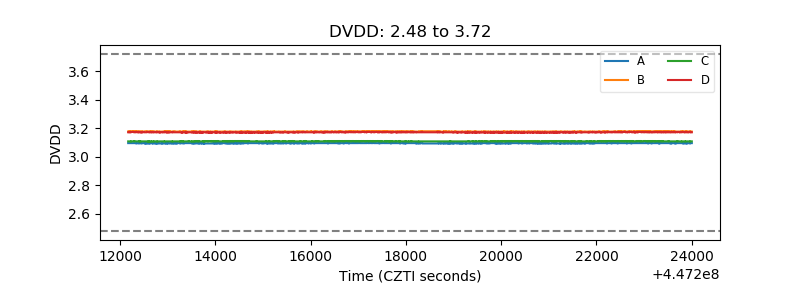 |
| Temperature 1 | 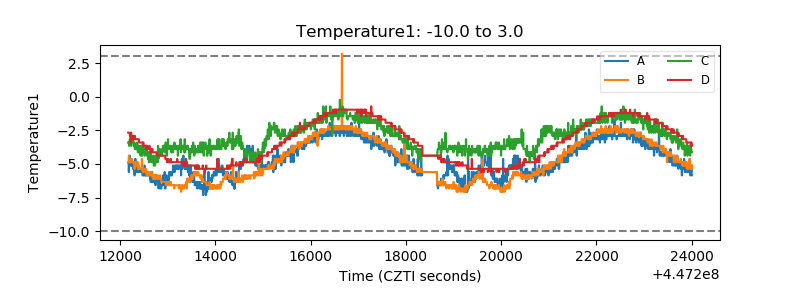 |
| Veto HV Monitor | 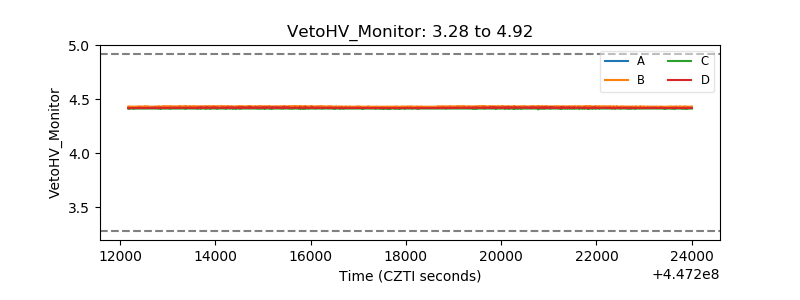 |
| Veto LLD | 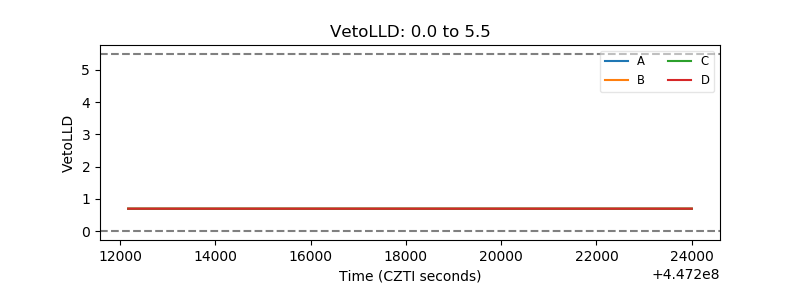 |
| Alpha Counter | 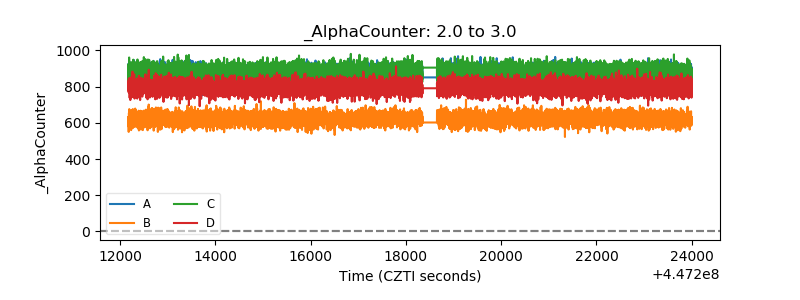 |
| _CPM_Rate | 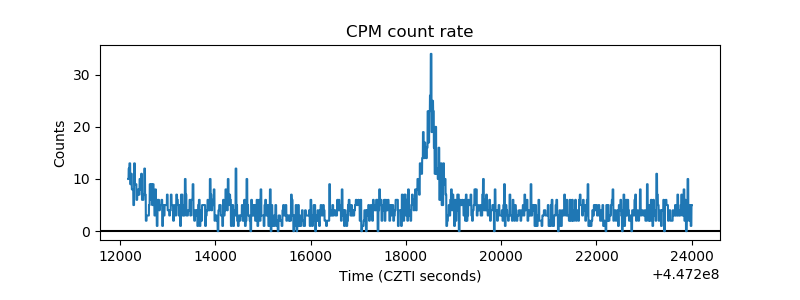 |
| CZT Counter | 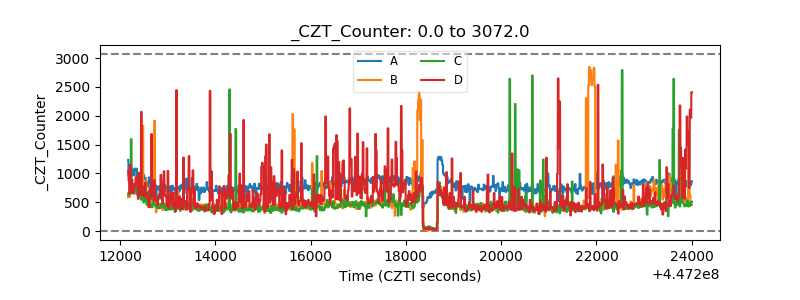 |
| +2.5 Volts monitor | 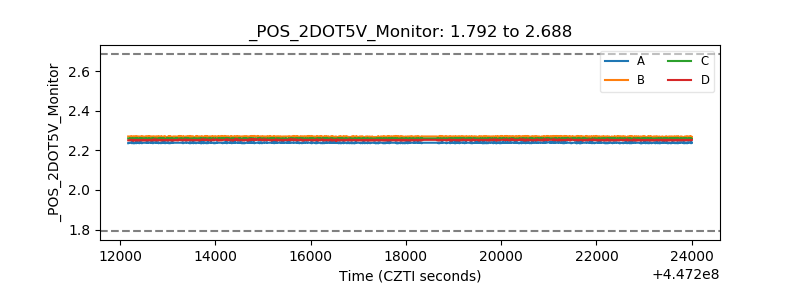 |
| +5 Volts monitor | 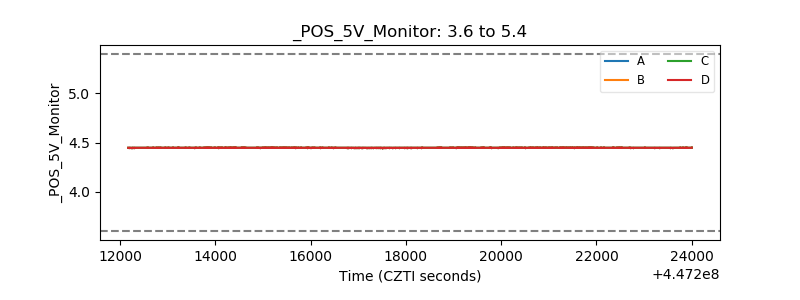 |
| _ROLL_ROT | 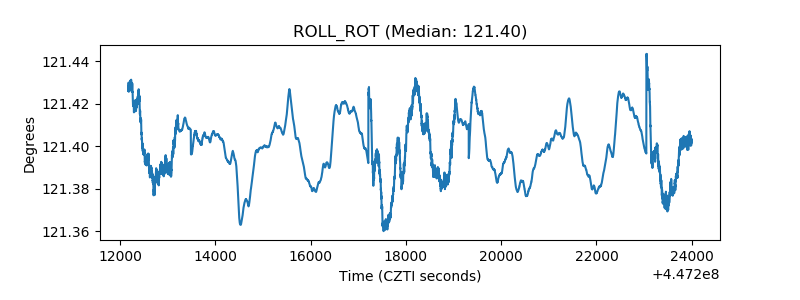 |
| _Roll_DEC | 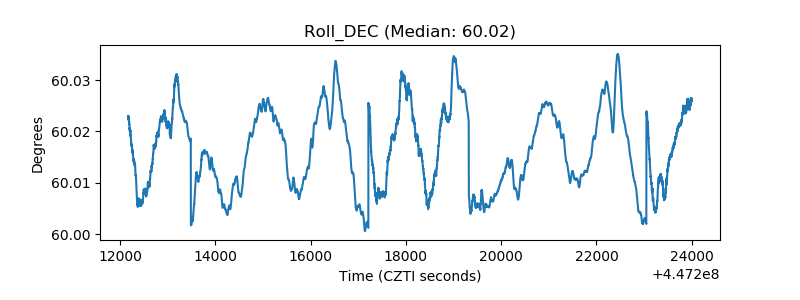 |
| _Roll_RA | 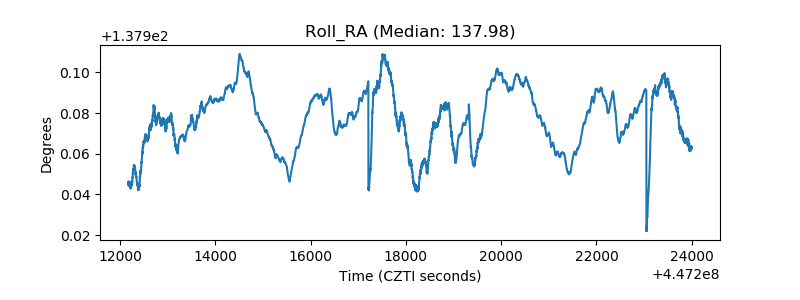 |
| Veto Counter | 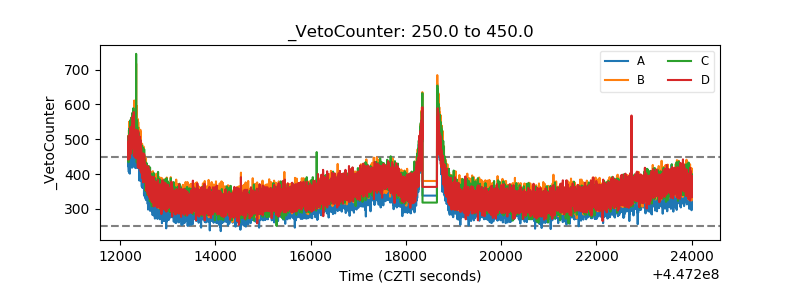 |