| Param | Original file | Final file |
|---|---|---|
| Filename | modeM0/AS1A13_082T02_9000006112_45599cztM0_level2.fits | modeM0/AS1A13_082T02_9000006112_45599cztM0_level2_quad_clean.evt |
| Size (bytes) | 432,273,600 | 103,043,520 |
| Size | 412.2 MB | 98.3 MB |
| Events in quadrant A | 6,973,296 | 866,729 |
| Events in quadrant B | 4,481,855 | 912,888 |
| Events in quadrant C | 4,042,802 | 887,861 |
| Events in quadrant D | 11,250 | 22 |
| Mode M0 | |||
|---|---|---|---|
| Quadrant | BADHDUFLAG | Total packets | Discarded packets |
| A | 0 | 26389 | 2 |
| B | 0 | 19196 | 2 |
| C | 0 | 18104 | 2 |
| D | 0 | 48 | 0 |
| Mode M9 | |||
|---|---|---|---|
| Quadrant | BADHDUFLAG | Total packets | Discarded packets |
| A | 0 | 12 | 0 |
| B | 0 | 12 | 0 |
| C | 0 | 12 | 0 |
| D | 0 | 12 | 0 |
| Mode SS | |||
|---|---|---|---|
| Quadrant | BADHDUFLAG | Total packets | Discarded packets |
| A | 0 | 176 | 0 |
| B | 0 | 176 | 0 |
| C | 0 | 176 | 0 |
| D | 0 | 176 | 0 |
| Quadrant | Total seconds | Saturated seconds | Saturation percentage |
|---|---|---|---|
| A | 8439 | 234 | 2.772840% |
| B | 8439 | 278 | 3.294229% |
| C | 8440 | 131 | 1.552133% |
| D | 24 | 0 | 0.000000% |
Noise dominated data is calculated using 1-second bins in cleaned event files. If a bin has >2000 counts, and if more than 50% of those come from <1% of pixels, then it is considered to be noise-dominated and hence unusable.
| Quadrant | # 1 sec bins | Bins with >0 counts | Bins with >2000 counts | High rate bins dominated by noise | Noise dominated (total time) | Noise dominated (detector-on time) | Marked lightcurve |
|---|---|---|---|---|---|---|---|
| A | 9784 | 8440 | 1 | 1 | 0.01% | 0.01% | 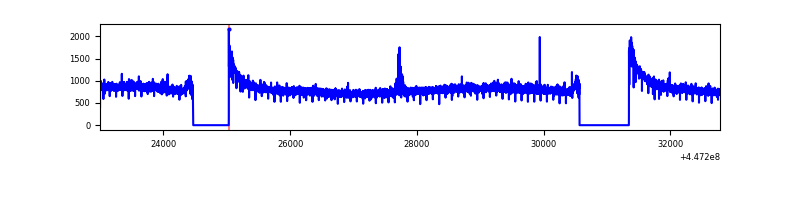 |
| B | 9784 | 8440 | 95 | 95 | 0.97% | 1.13% | 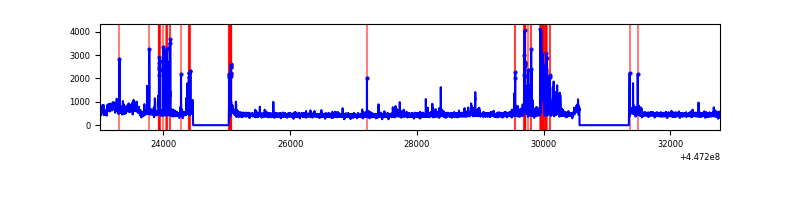 |
| C | 9785 | 8442 | 47 | 47 | 0.48% | 0.56% | 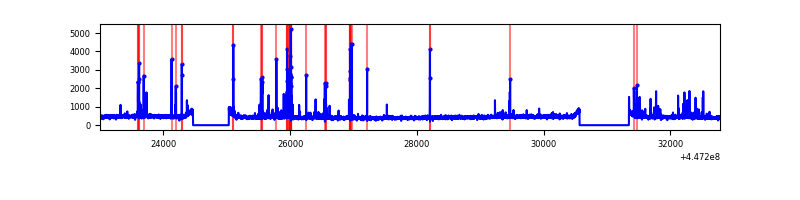 |
| D | 24 | 24 | 0 | 0 | 0.00% | 0.00% |  |
Top three noisy pixels from each quadrant. If the there are fewer than three noisy pixels in the level2.evt file, extra rows are filled as -1
| Pixel properties | Quadrant properties | ||||||
|---|---|---|---|---|---|---|---|
| Quadrant | DetID | PixID | Counts | Sigma | Mean | Median | Sigma |
| A | 10 | 83 | 3287086 | 16621.9 | 945 | 923 | 197.7 |
| A | 13 | 248 | 24143 | 117.45 | 945 | 923 | 197.7 |
| A | 0 | 243 | 12239 | 57.24 | 945 | 923 | 197.7 |
| B | 5 | 172 | 487351 | 2562.66 | 945 | 913 | 189.8 |
| B | 15 | 201 | 177045 | 927.9 | 945 | 913 | 189.8 |
| B | 3 | 112 | 32535 | 166.59 | 945 | 913 | 189.8 |
| C | 14 | 254 | 367745 | 1666.82 | 936 | 938 | 220.1 |
| C | 2 | 14 | 11684 | 48.83 | 936 | 938 | 220.1 |
| C | 13 | 61 | 6230 | 24.05 | 936 | 938 | 220.1 |
| D | 13 | 168 | 288 | 185.8 | 2 | 2 | 1.5 |
| D | 5 | 171 | 160 | 102.64 | 2 | 2 | 1.5 |
| D | 2 | 233 | 151 | 96.8 | 2 | 2 | 1.5 |
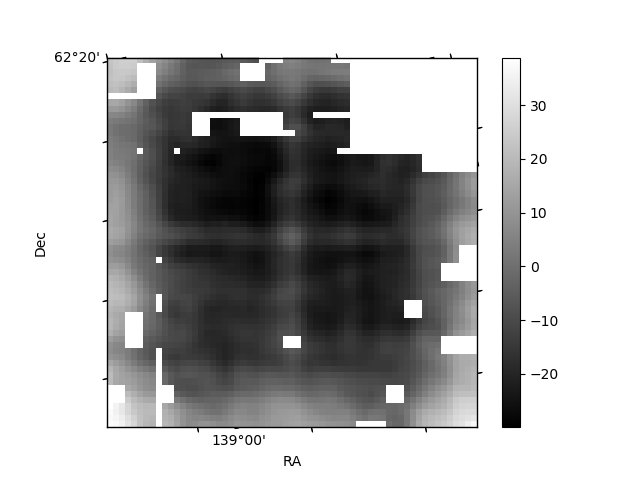
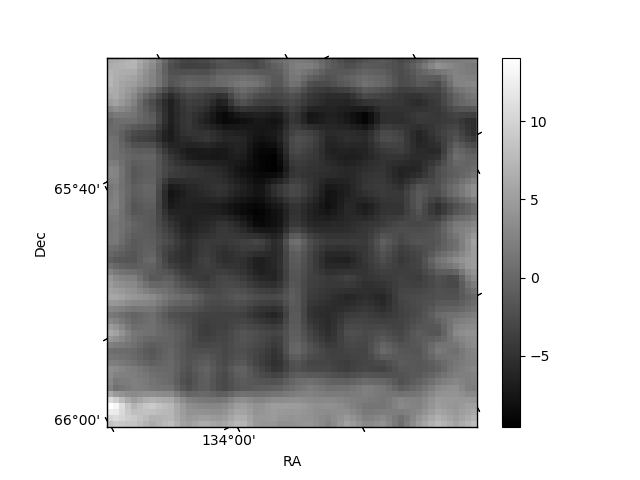
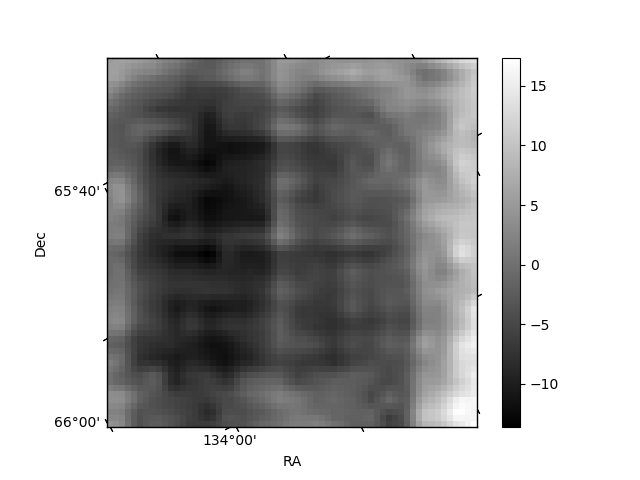
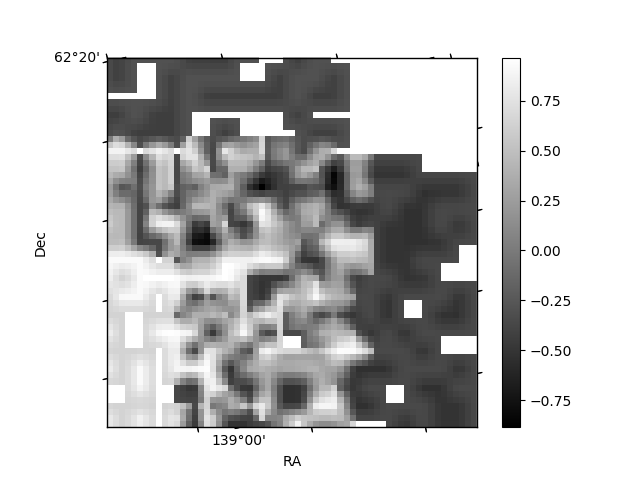
Histogram calculated using DETX and DETY for each event in the final _common_clean file
| Quadrant A | 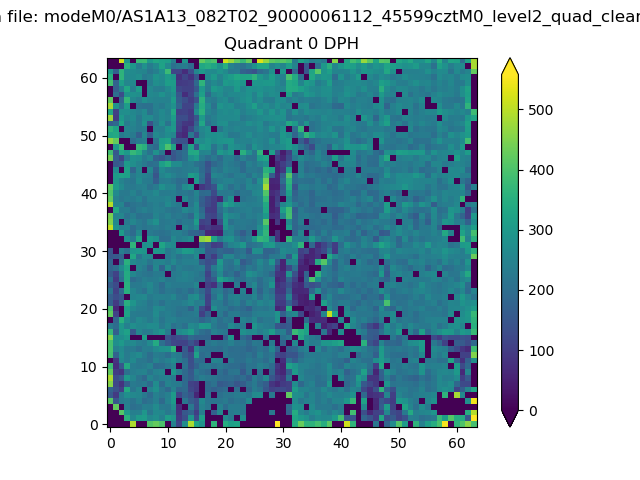 |
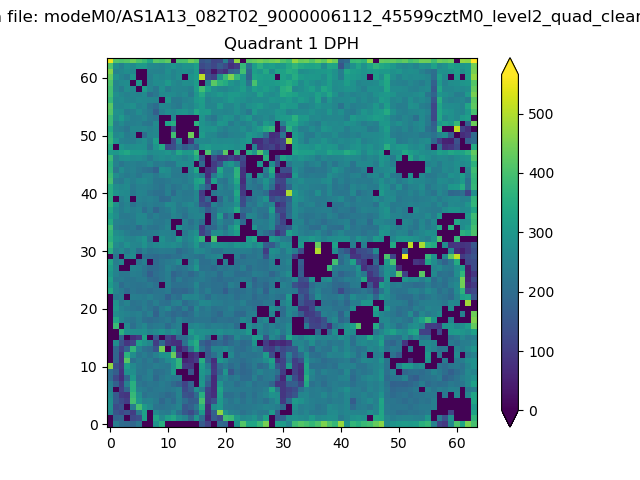 |
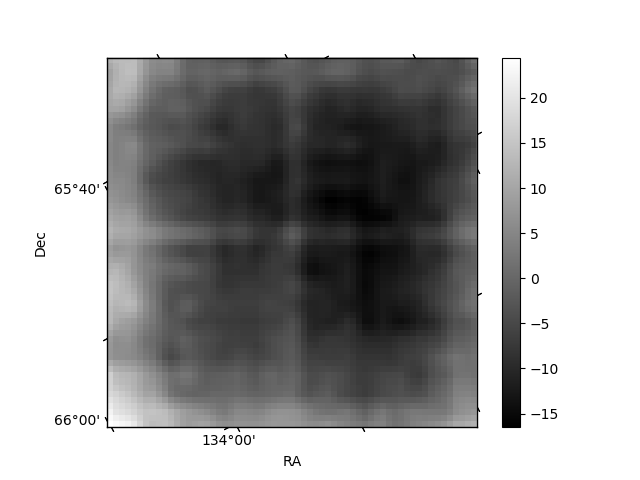
Quadrant B |
|---|---|---|---|
| Quadrant D | 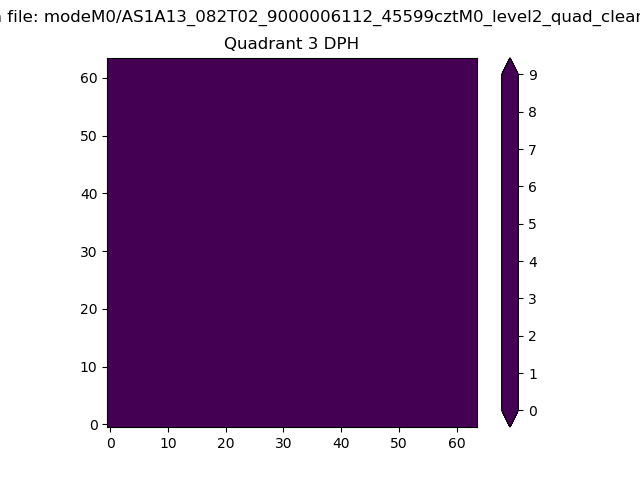 |
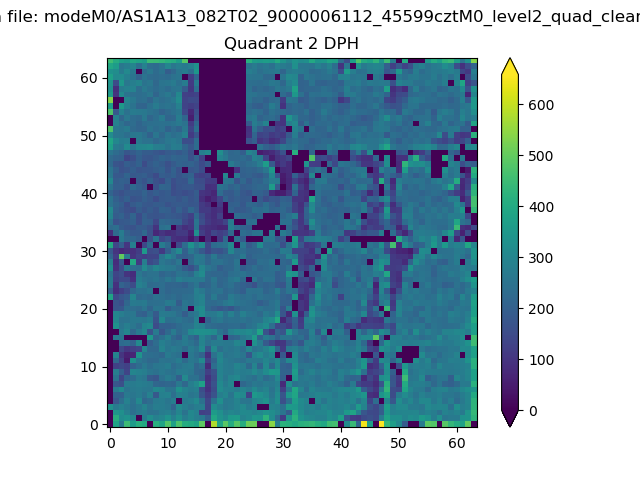 |
Quadrant C |
| Plot type | Count rate plots | Images |
|---|---|---|
| Comparison with Poisson distribution Blue bars denote a histogram of data divided into 1 sec bins. Red curve is a Poisson curve with rate = median count rate of data. |
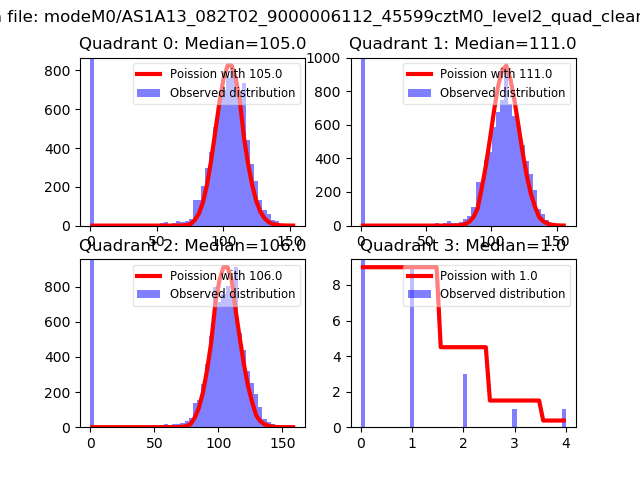 |
 |
| Quadrant-wise count rates Data is divided into 100 sec bins |
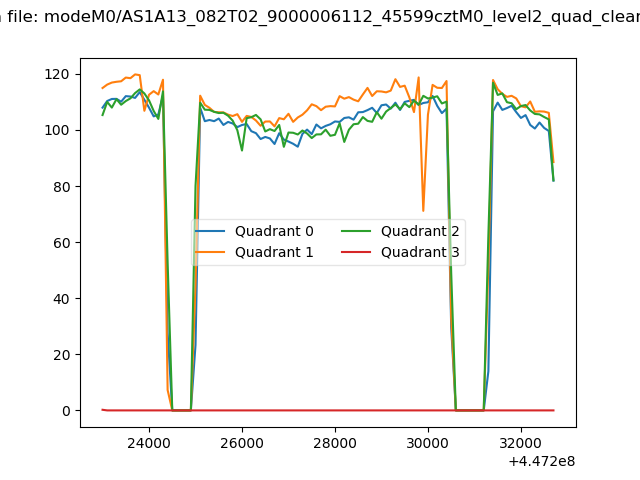 |
|
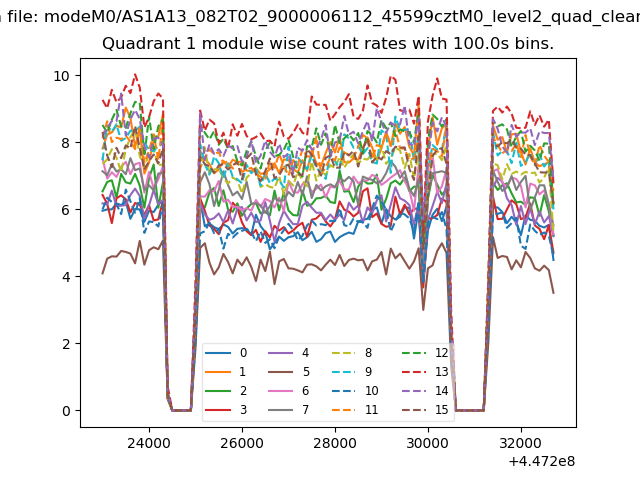
| Module-wise count rates for Quadrant A Data is divided into 100 sec bins |
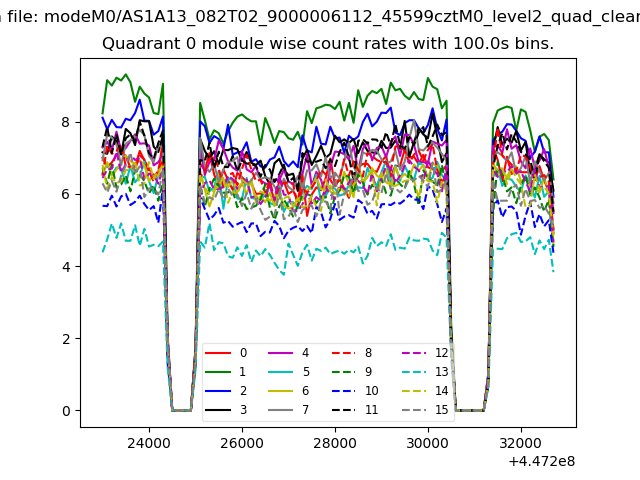 |
 |
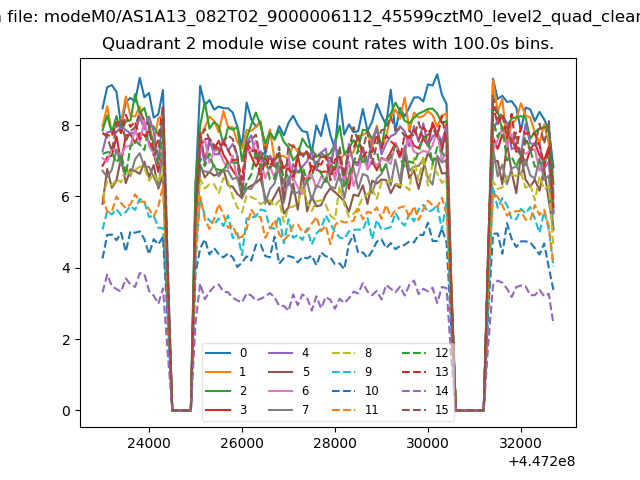
| Module-wise count rates for Quadrant B Data is divided into 100 sec bins |
 |
 |
| Module-wise count rates for Quadrant C Data is divided into 100 sec bins |
 |
 |
| Module-wise count rates for Quadrant D Data is divided into 100 sec bins |
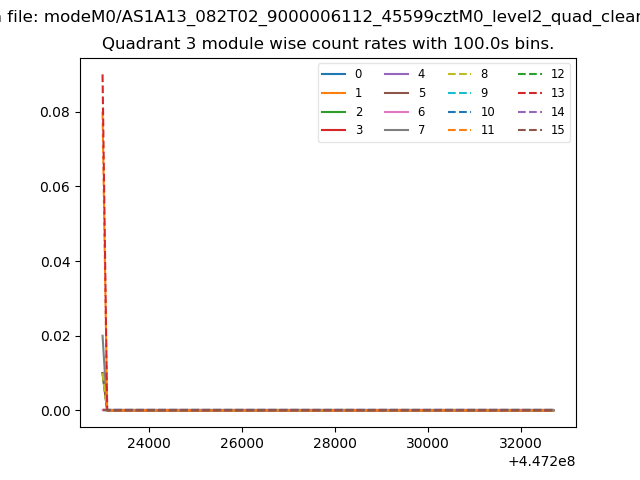 |
 |
| Parameter | Plot |
|---|---|
| CZT HV Monitor | 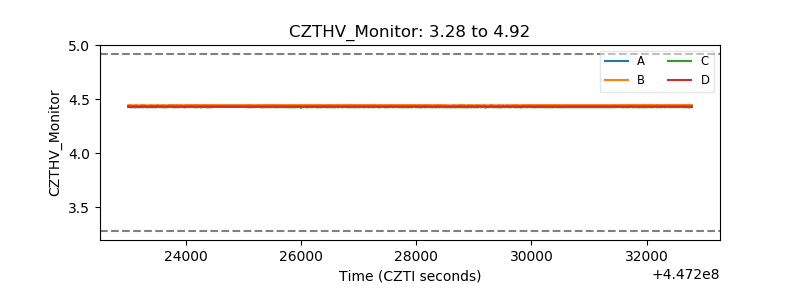 |
| D_VDD | 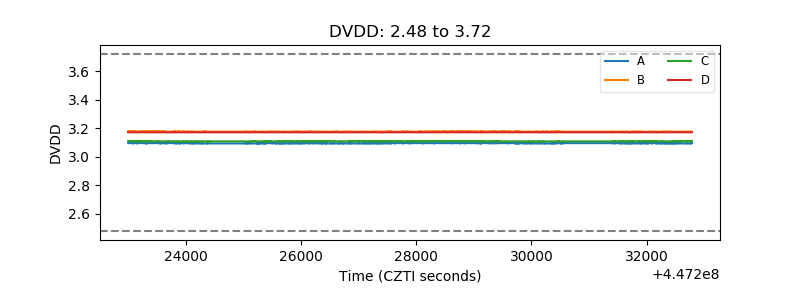 |
| Temperature 1 | 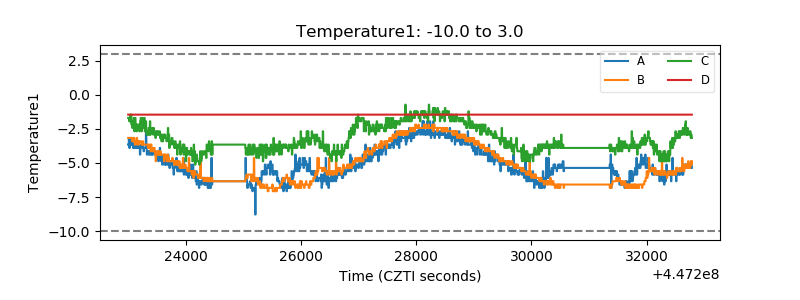 |
| Veto HV Monitor | 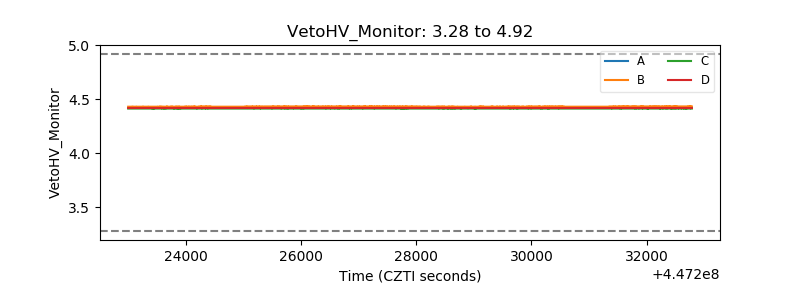 |
| Veto LLD | 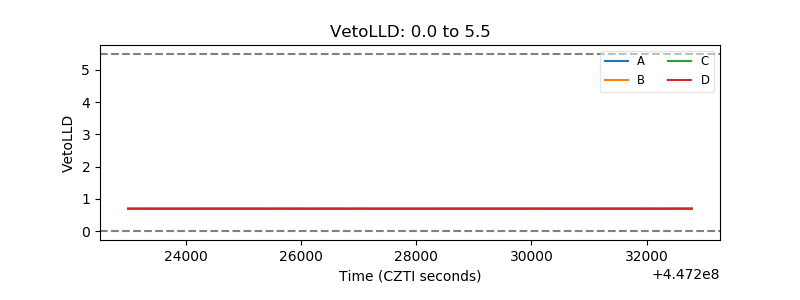 |
| Alpha Counter | 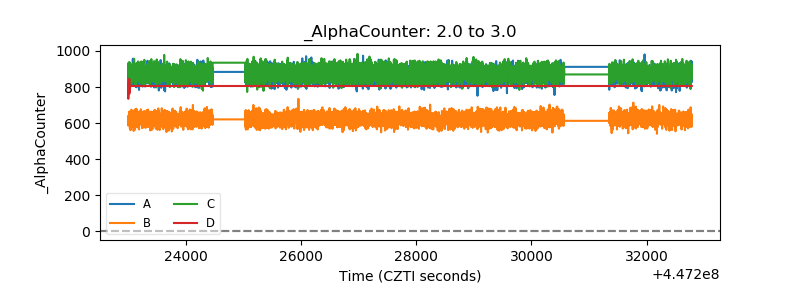 |
| _CPM_Rate | 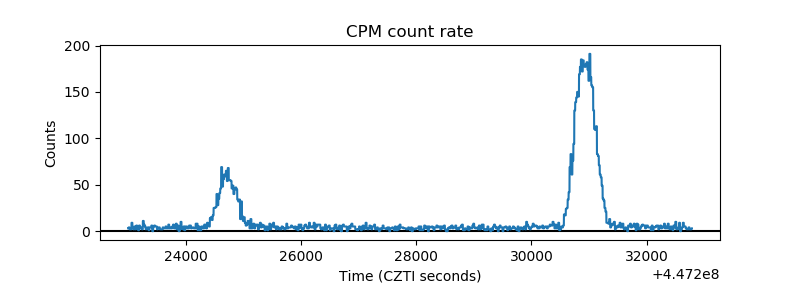 |
| CZT Counter | 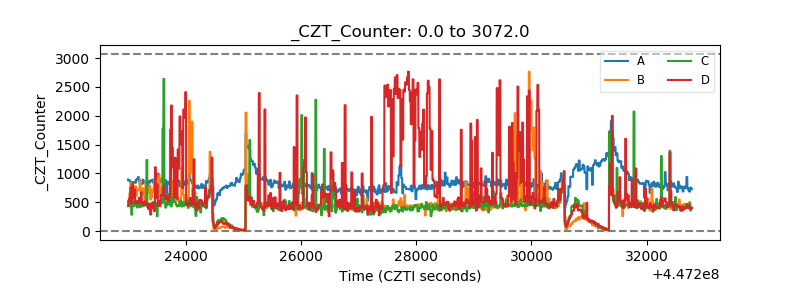 |
| +2.5 Volts monitor | 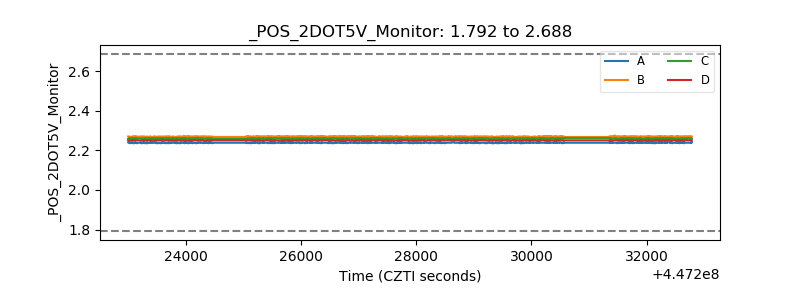 |
| +5 Volts monitor | 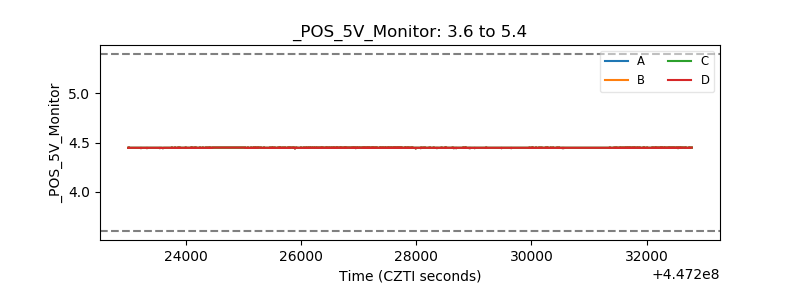 |
| _ROLL_ROT | 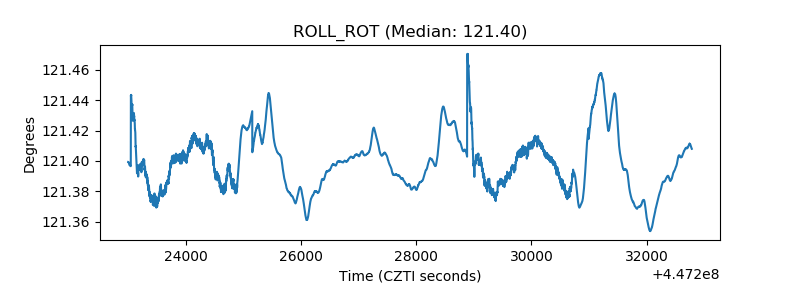 |
| _Roll_DEC | 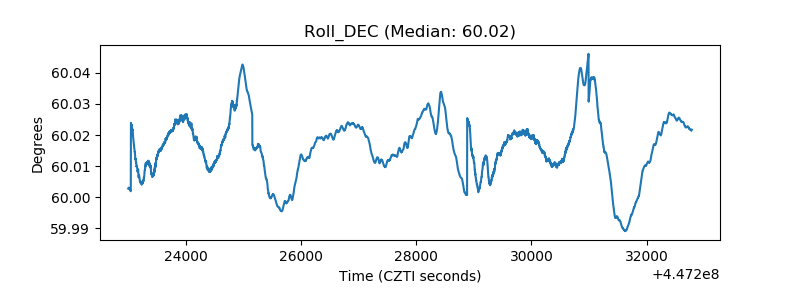 |
| _Roll_RA | 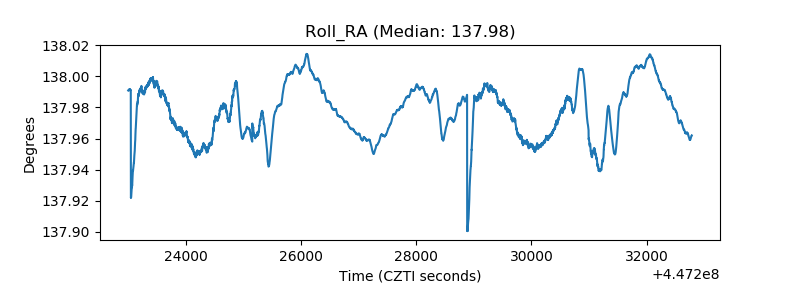 |
| Veto Counter | 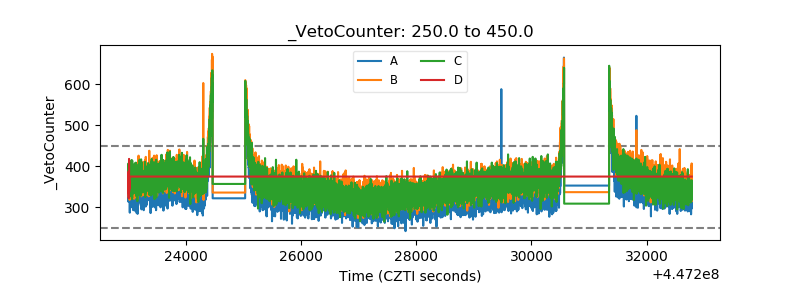 |