| Param | Original file | Final file |
|---|---|---|
| Filename | modeM0/AS1A13_082T02_9000006112_45600cztM0_level2.fits | modeM0/AS1A13_082T02_9000006112_45600cztM0_level2_quad_clean.evt |
| Size (bytes) | 262,699,200 | 63,665,280 |
| Size | 250.5 MB | 60.7 MB |
| Events in quadrant A | 3,227,823 | 415,662 |
| Events in quadrant B | 1,870,954 | 442,667 |
| Events in quadrant C | 1,940,697 | 417,114 |
| Events in quadrant D | 2,379,994 | 376,744 |
| Mode M0 | |||
|---|---|---|---|
| Quadrant | BADHDUFLAG | Total packets | Discarded packets |
| A | 0 | 12514 | 132 |
| B | 0 | 8241 | 86 |
| C | 0 | 8723 | 80 |
| D | 0 | 9837 | 132 |
| Mode M9 | |||
|---|---|---|---|
| Quadrant | BADHDUFLAG | Total packets | Discarded packets |
| A | 0 | 5 | 1 |
| B | 0 | 4 | 0 |
| C | 0 | 4 | 0 |
| D | 0 | 4 | 0 |
| Mode SS | |||
|---|---|---|---|
| Quadrant | BADHDUFLAG | Total packets | Discarded packets |
| A | 0 | 78 | 0 |
| B | 0 | 79 | 1 |
| C | 0 | 78 | 0 |
| D | 0 | 79 | 1 |
| Quadrant | Total seconds | Saturated seconds | Saturation percentage |
|---|---|---|---|
| A | 3901 | 93 | 2.384004% |
| B | 3908 | 38 | 0.972364% |
| C | 3903 | 56 | 1.434794% |
| D | 3907 | 85 | 2.175582% |
Noise dominated data is calculated using 1-second bins in cleaned event files. If a bin has >2000 counts, and if more than 50% of those come from <1% of pixels, then it is considered to be noise-dominated and hence unusable.
| Quadrant | # 1 sec bins | Bins with >0 counts | Bins with >2000 counts | High rate bins dominated by noise | Noise dominated (total time) | Noise dominated (detector-on time) | Marked lightcurve |
|---|---|---|---|---|---|---|---|
| A | 7524 | 3910 | 1 | 1 | 0.01% | 0.03% | 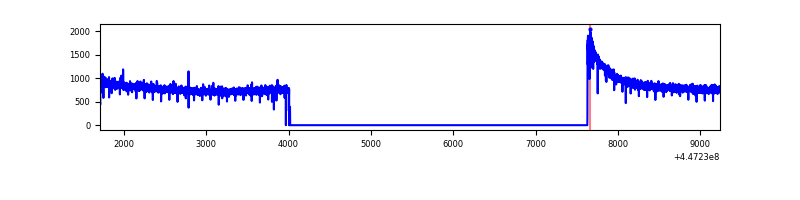 |
| B | 7522 | 3911 | 13 | 13 | 0.17% | 0.33% | 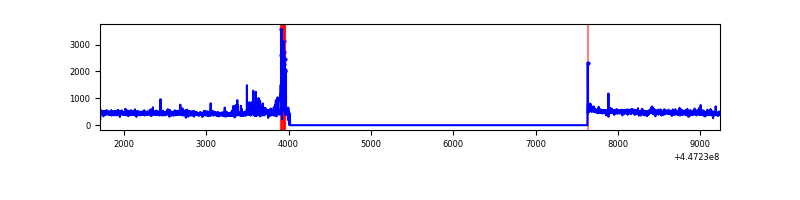 |
| C | 7525 | 3908 | 42 | 42 | 0.56% | 1.07% | 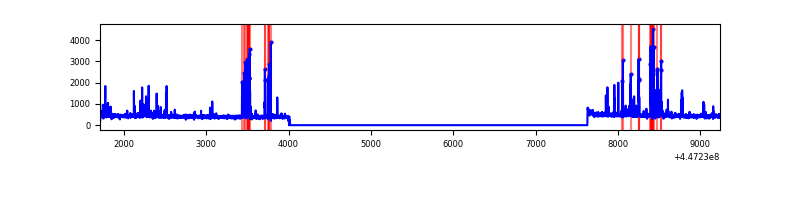 |
| D | 7526 | 3912 | 71 | 71 | 0.94% | 1.81% | 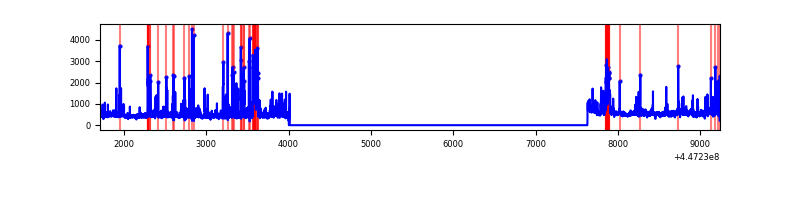 |
Top three noisy pixels from each quadrant. If the there are fewer than three noisy pixels in the level2.evt file, extra rows are filled as -1
| Pixel properties | Quadrant properties | ||||||
|---|---|---|---|---|---|---|---|
| Quadrant | DetID | PixID | Counts | Sigma | Mean | Median | Sigma |
| A | 10 | 83 | 1534959 | 16754.28 | 437 | 428 | 91.6 |
| A | 3 | 137 | 5148 | 51.53 | 437 | 428 | 91.6 |
| A | 0 | 243 | 3909 | 38.01 | 437 | 428 | 91.6 |
| B | 15 | 201 | 102635 | 1166.98 | 439 | 426 | 87.6 |
| B | 0 | 183 | 13742 | 152.04 | 439 | 426 | 87.6 |
| B | 12 | 111 | 11104 | 121.92 | 439 | 426 | 87.6 |
| C | 14 | 254 | 288288 | 2893.31 | 420 | 423 | 99.5 |
| C | 2 | 14 | 11298 | 109.3 | 420 | 423 | 99.5 |
| C | 13 | 61 | 2882 | 24.72 | 420 | 423 | 99.5 |
| D | 1 | 52 | 338046 | 3213.2 | 419 | 405 | 105.1 |
| D | 13 | 249 | 199175 | 1891.62 | 419 | 405 | 105.1 |
| D | 11 | 241 | 142352 | 1350.85 | 419 | 405 | 105.1 |
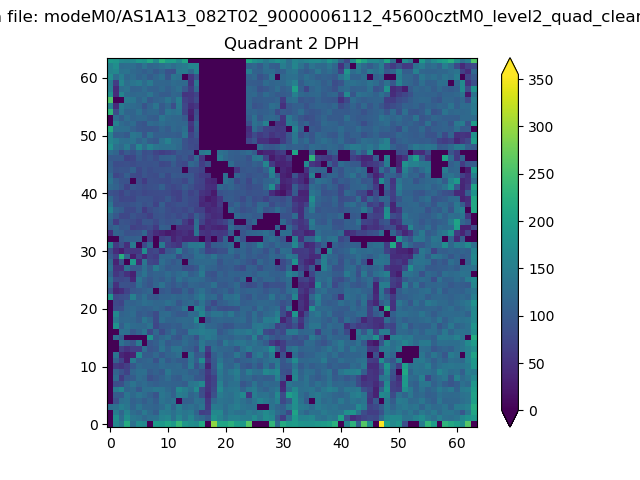
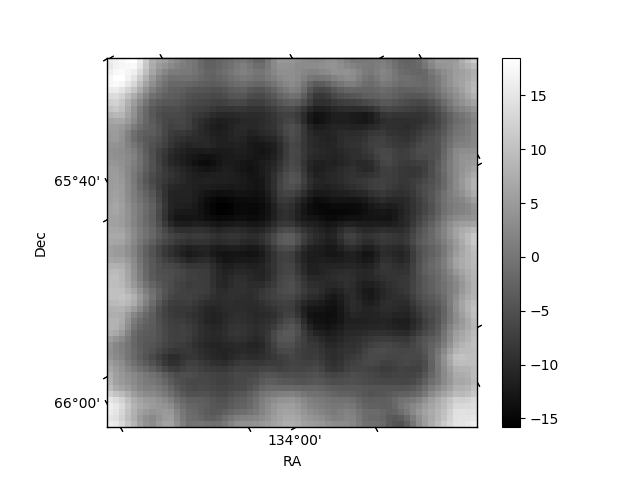
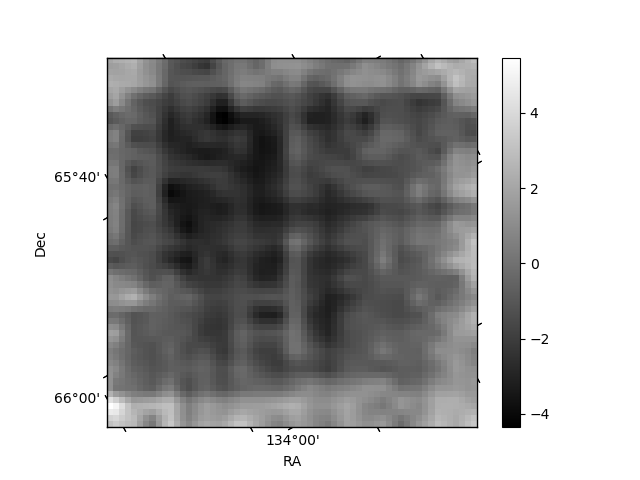
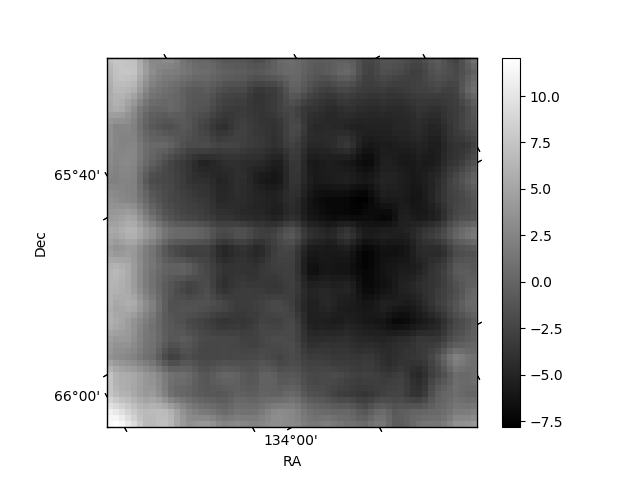
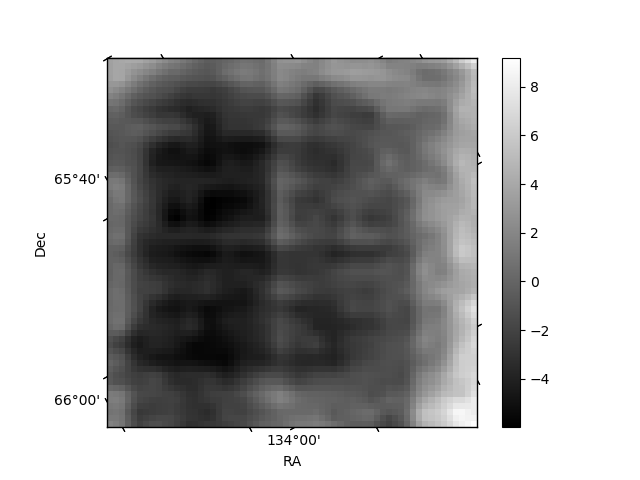
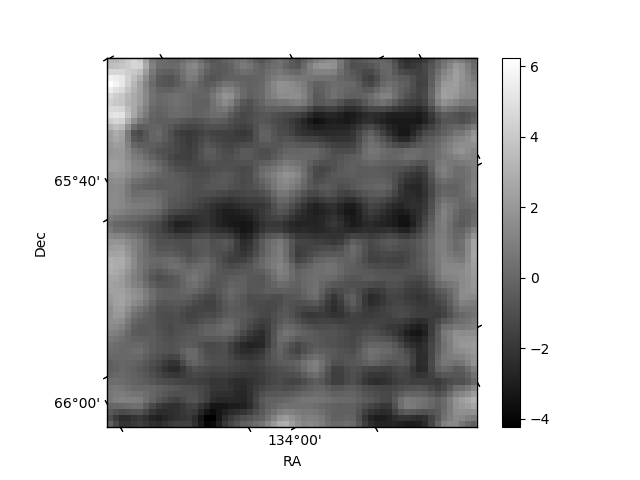
Histogram calculated using DETX and DETY for each event in the final _common_clean file
| Quadrant A | 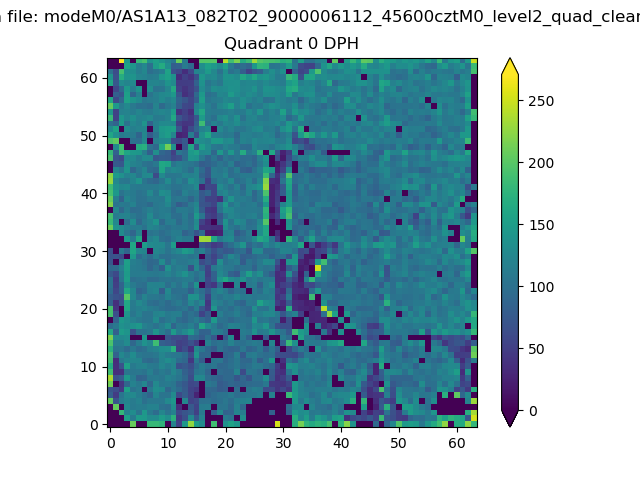 |
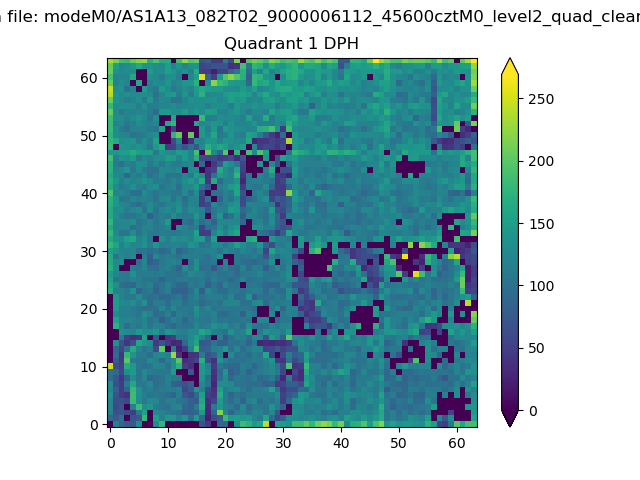 |
Quadrant B |
|---|---|---|---|
| Quadrant D | 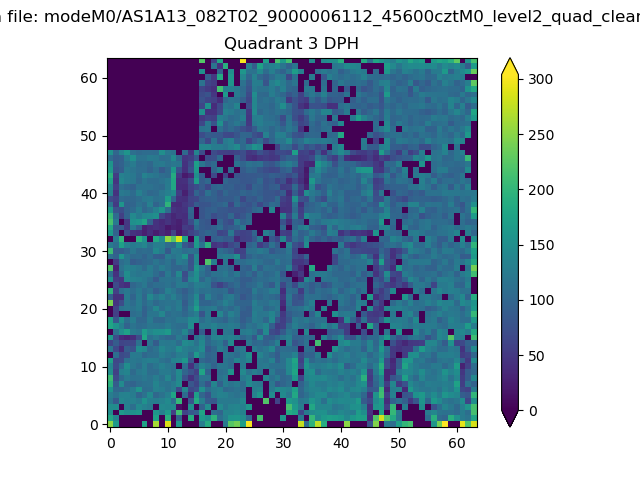 |
 |
Quadrant C |
| Plot type | Count rate plots | Images |
|---|---|---|
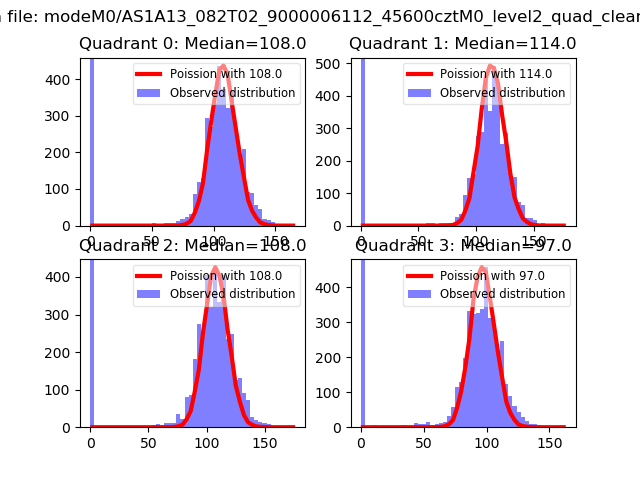
| Comparison with Poisson distribution Blue bars denote a histogram of data divided into 1 sec bins. Red curve is a Poisson curve with rate = median count rate of data. |
 |
 |
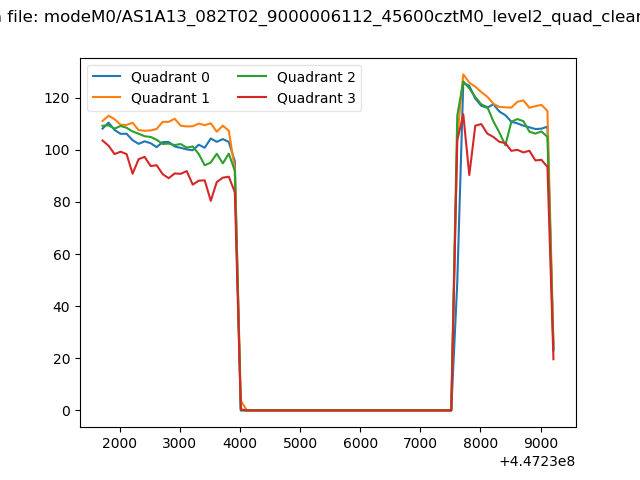
| Quadrant-wise count rates Data is divided into 100 sec bins |
 |
|
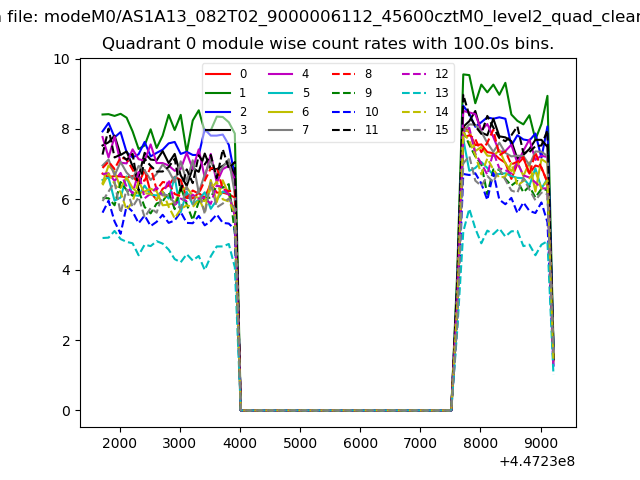
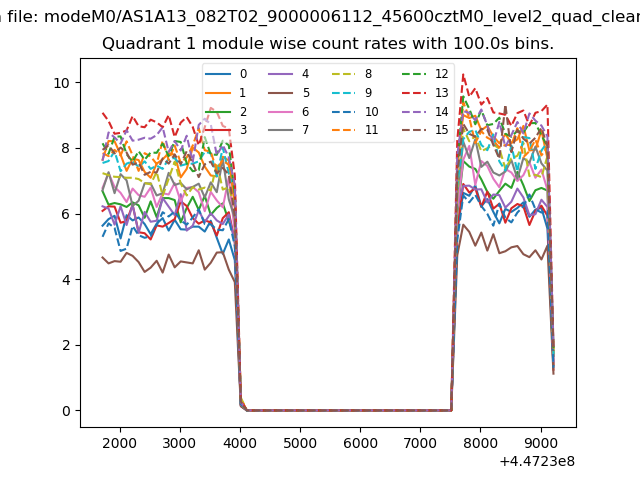
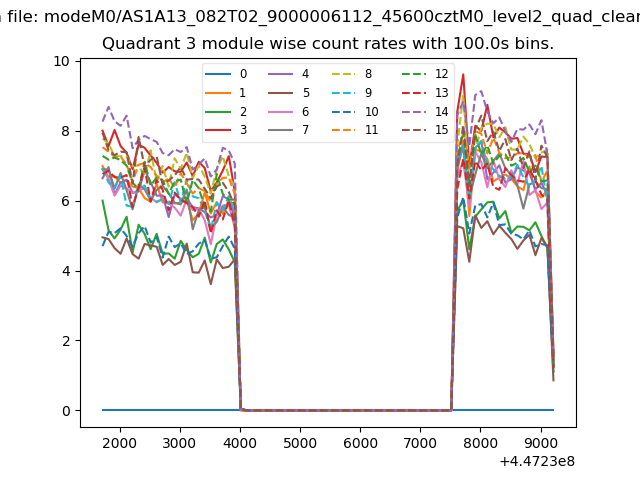
| Module-wise count rates for Quadrant A Data is divided into 100 sec bins |
 |
 |
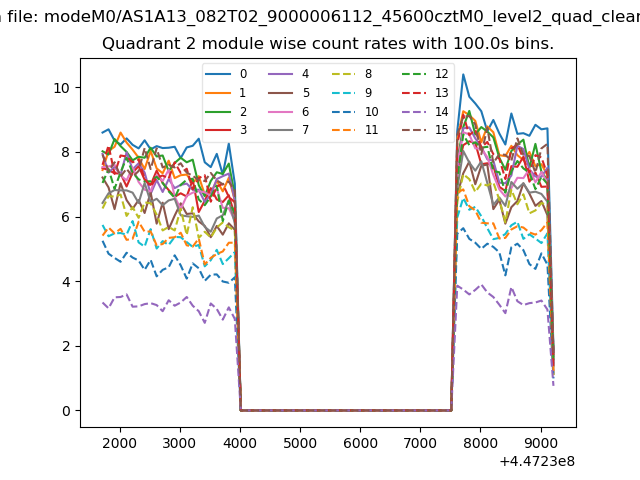
| Module-wise count rates for Quadrant B Data is divided into 100 sec bins |
 |
 |
| Module-wise count rates for Quadrant C Data is divided into 100 sec bins |
 |
 |
| Module-wise count rates for Quadrant D Data is divided into 100 sec bins |
 |
 |
| Parameter | Plot |
|---|---|
| CZT HV Monitor | 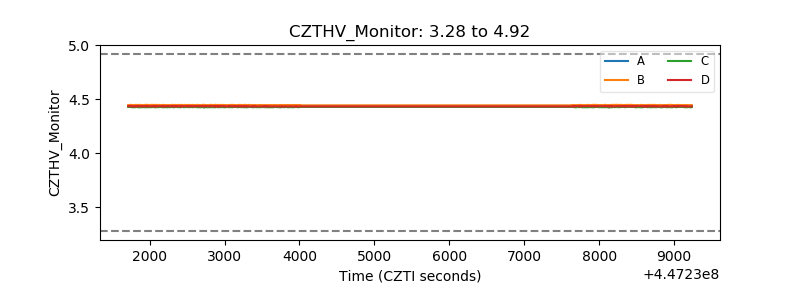 |
| D_VDD | 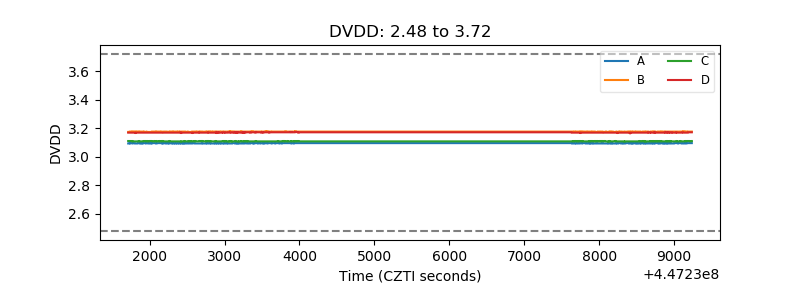 |
| Temperature 1 | 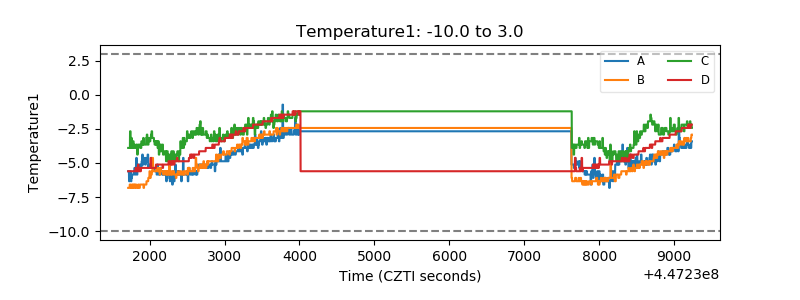 |
| Veto HV Monitor | 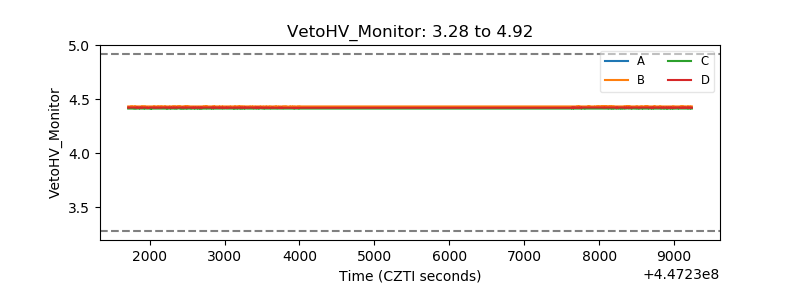 |
| Veto LLD | 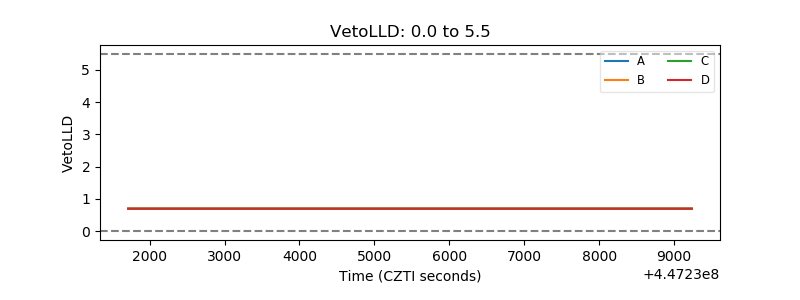 |
| Alpha Counter | 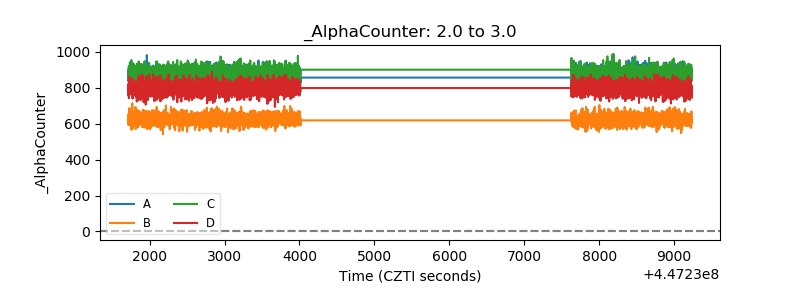 |
| _CPM_Rate | 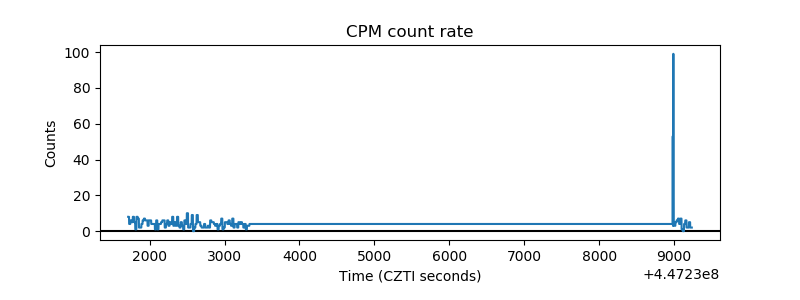 |
| CZT Counter | 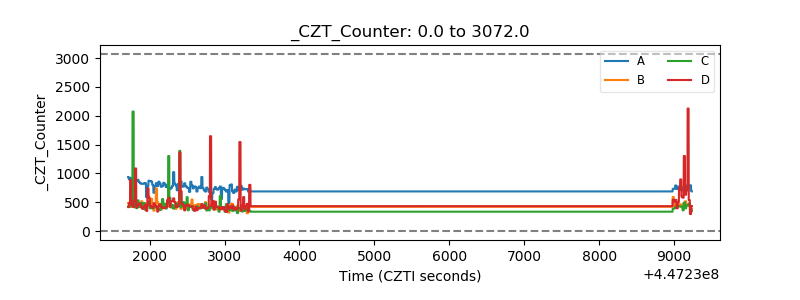 |
| +2.5 Volts monitor | 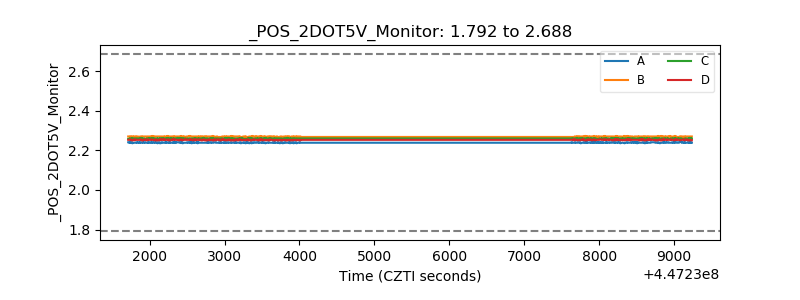 |
| +5 Volts monitor | 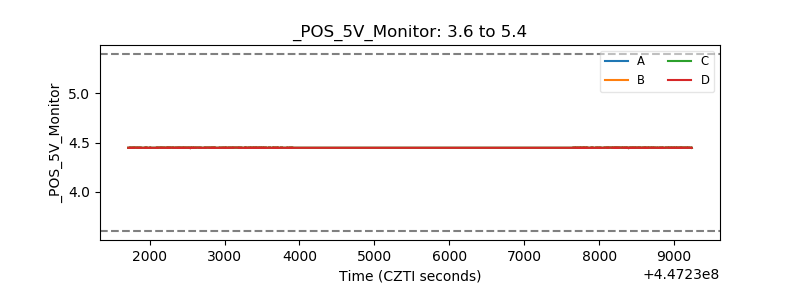 |
| _ROLL_ROT | 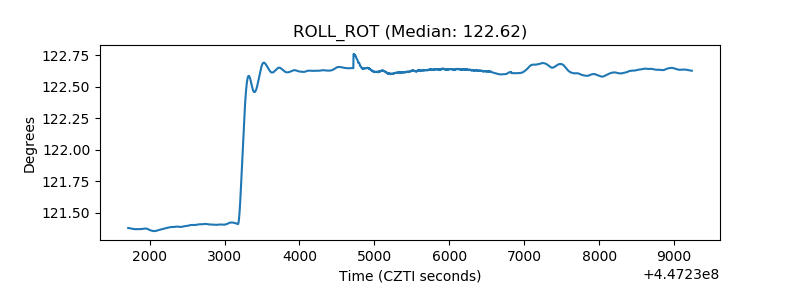 |
| _Roll_DEC | 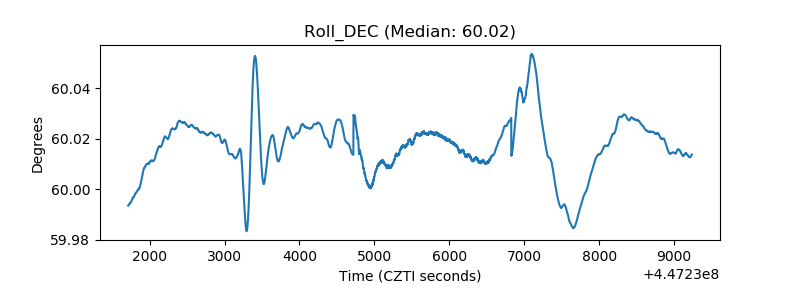 |
| _Roll_RA | 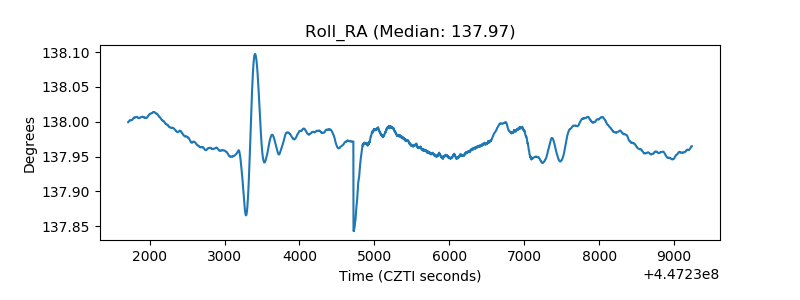 |
| Veto Counter | 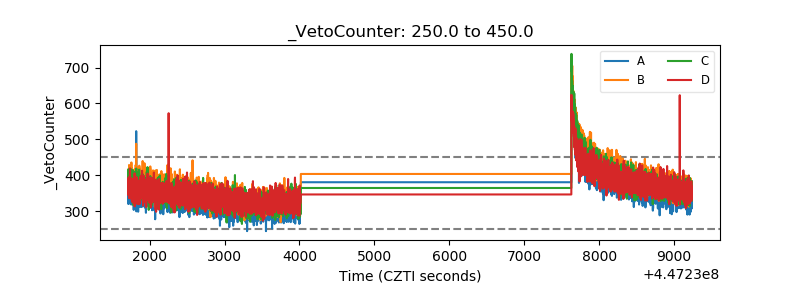 |