| Param | Original file | Final file |
|---|---|---|
| Filename | modeM0/AS1A13_082T02_9000006112_45602cztM0_level2.fits | modeM0/AS1A13_082T02_9000006112_45602cztM0_level2_quad_clean.evt |
| Size (bytes) | 485,098,560 | 115,277,760 |
| Size | 462.6 MB | 109.9 MB |
| Events in quadrant A | 5,965,269 | 760,173 |
| Events in quadrant B | 3,603,904 | 804,303 |
| Events in quadrant C | 3,309,577 | 761,884 |
| Events in quadrant D | 4,544,348 | 685,628 |
| Mode M0 | |||
|---|---|---|---|
| Quadrant | BADHDUFLAG | Total packets | Discarded packets |
| A | 0 | 22367 | 2 |
| B | 0 | 15367 | 2 |
| C | 0 | 14771 | 2 |
| D | 0 | 17889 | 2 |
| Mode M9 | |||
|---|---|---|---|
| Quadrant | BADHDUFLAG | Total packets | Discarded packets |
| A | 0 | 15 | 0 |
| B | 0 | 16 | 0 |
| C | 0 | 16 | 0 |
| D | 0 | 16 | 0 |
| Mode SS | |||
|---|---|---|---|
| Quadrant | BADHDUFLAG | Total packets | Discarded packets |
| A | 0 | 138 | 0 |
| B | 0 | 138 | 0 |
| C | 0 | 138 | 0 |
| D | 0 | 138 | 0 |
| Quadrant | Total seconds | Saturated seconds | Saturation percentage |
|---|---|---|---|
| A | 6876 | 268 | 3.897615% |
| B | 6876 | 178 | 2.588714% |
| C | 6876 | 104 | 1.512507% |
| D | 6876 | 210 | 3.054101% |
Noise dominated data is calculated using 1-second bins in cleaned event files. If a bin has >2000 counts, and if more than 50% of those come from <1% of pixels, then it is considered to be noise-dominated and hence unusable.
| Quadrant | # 1 sec bins | Bins with >0 counts | Bins with >2000 counts | High rate bins dominated by noise | Noise dominated (total time) | Noise dominated (detector-on time) | Marked lightcurve |
|---|---|---|---|---|---|---|---|
| A | 7921 | 6876 | 14 | 14 | 0.18% | 0.20% | 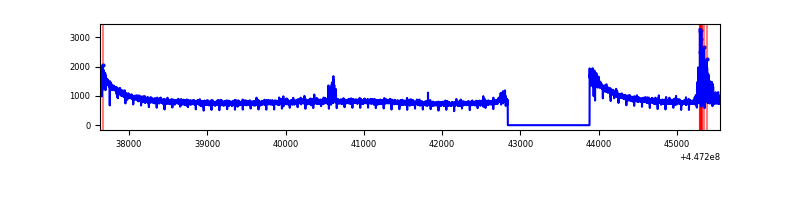 |
| B | 7921 | 6876 | 56 | 56 | 0.71% | 0.81% | 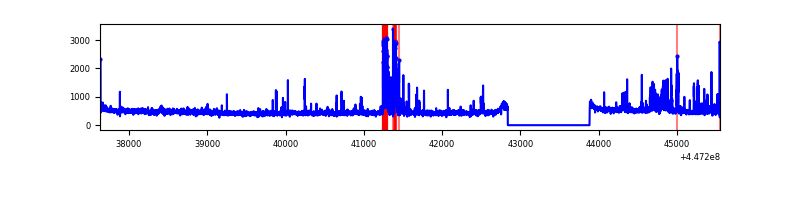 |
| C | 7921 | 6877 | 35 | 35 | 0.44% | 0.51% | 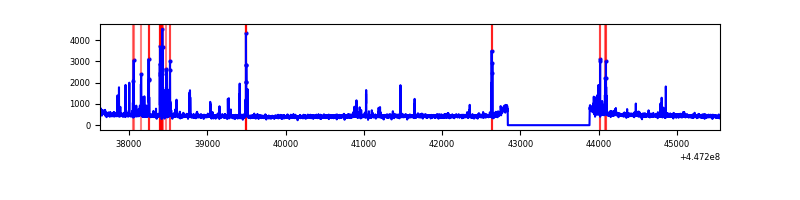 |
| D | 7921 | 6877 | 141 | 141 | 1.78% | 2.05% | 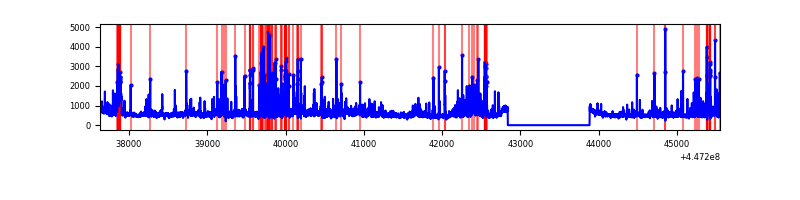 |
Top three noisy pixels from each quadrant. If the there are fewer than three noisy pixels in the level2.evt file, extra rows are filled as -1
| Pixel properties | Quadrant properties | ||||||
|---|---|---|---|---|---|---|---|
| Quadrant | DetID | PixID | Counts | Sigma | Mean | Median | Sigma |
| A | 10 | 83 | 2793160 | 17092.86 | 788 | 770 | 163.4 |
| A | 13 | 248 | 107409 | 652.76 | 788 | 770 | 163.4 |
| A | 7 | 191 | 20282 | 119.44 | 788 | 770 | 163.4 |
| B | 5 | 172 | 219092 | 1412.67 | 787 | 762 | 154.6 |
| B | 15 | 201 | 215899 | 1392.01 | 787 | 762 | 154.6 |
| B | 12 | 111 | 19559 | 121.62 | 787 | 762 | 154.6 |
| C | 14 | 254 | 282318 | 1551.24 | 773 | 775 | 181.5 |
| C | 13 | 61 | 5109 | 23.88 | 773 | 775 | 181.5 |
| C | 3 | 233 | 4987 | 23.21 | 773 | 775 | 181.5 |
| D | 11 | 241 | 464219 | 2441.39 | 768 | 745 | 189.8 |
| D | 1 | 52 | 279608 | 1468.93 | 768 | 745 | 189.8 |
| D | 13 | 249 | 227364 | 1193.73 | 768 | 745 | 189.8 |
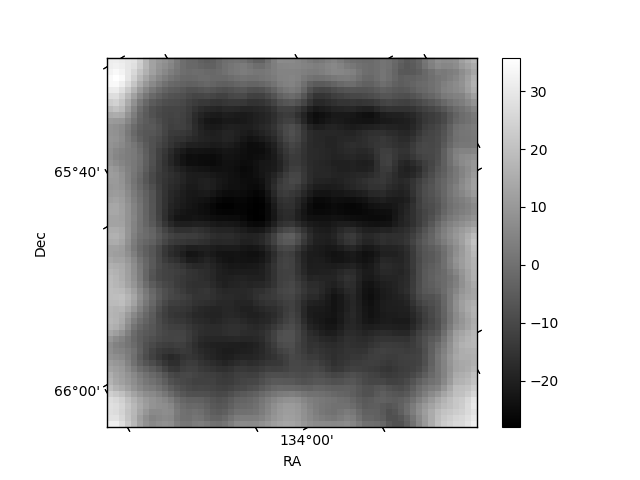
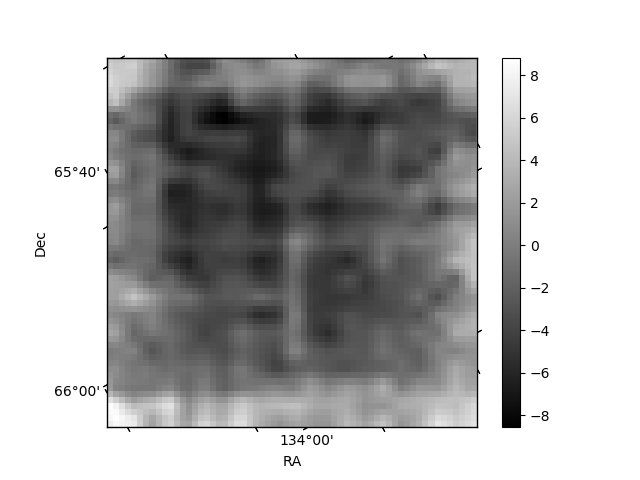
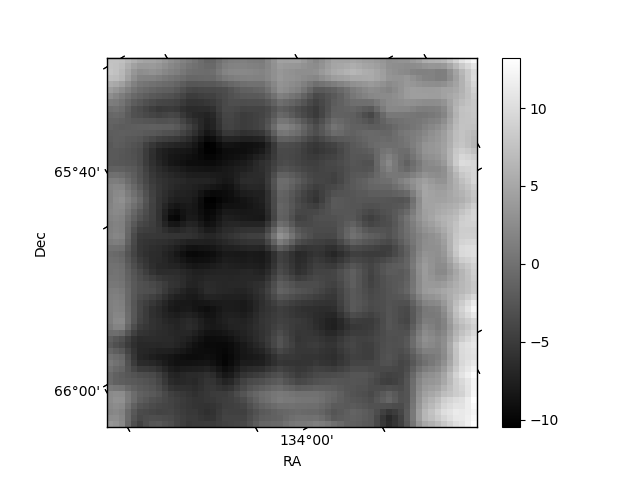
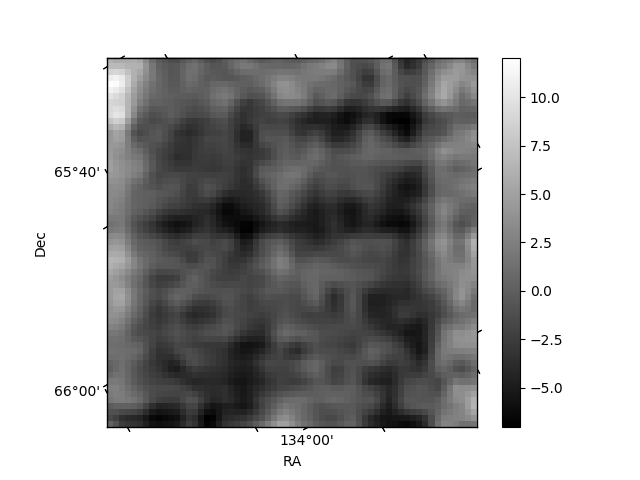
Histogram calculated using DETX and DETY for each event in the final _common_clean file
| Quadrant A | 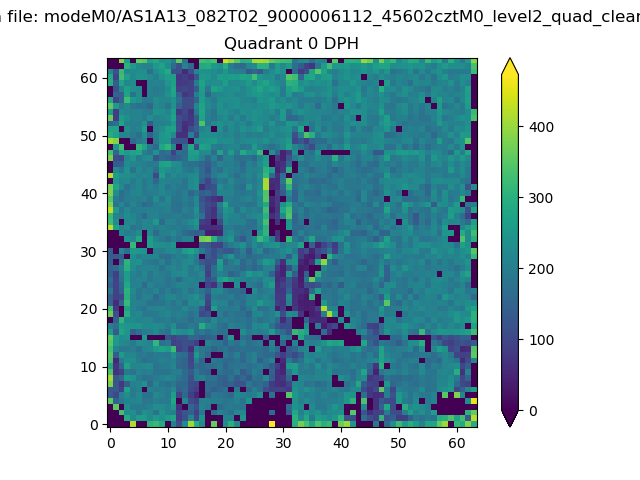 |
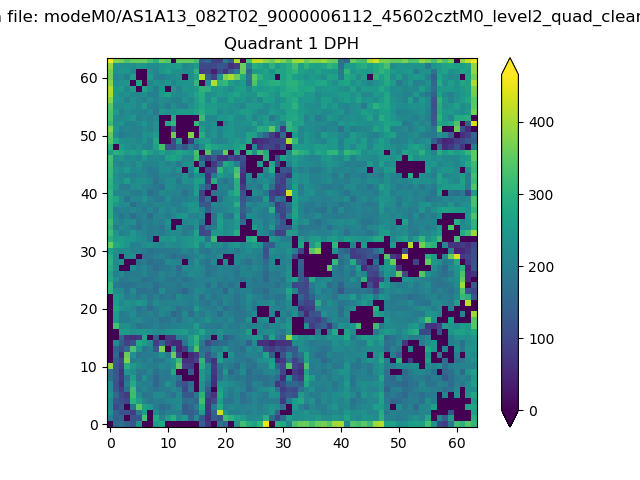 |
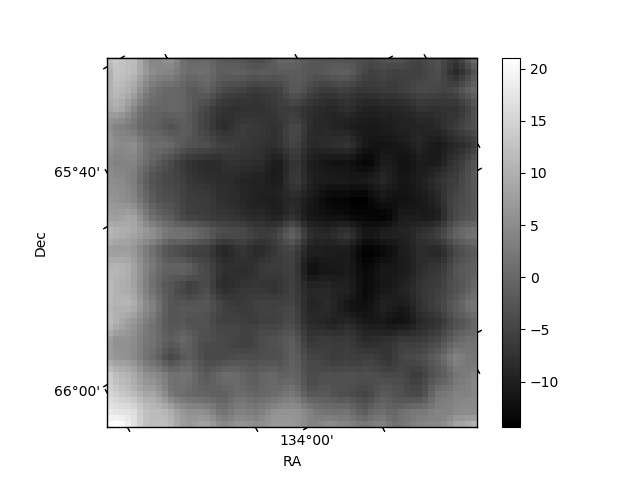
Quadrant B |
|---|---|---|---|
| Quadrant D | 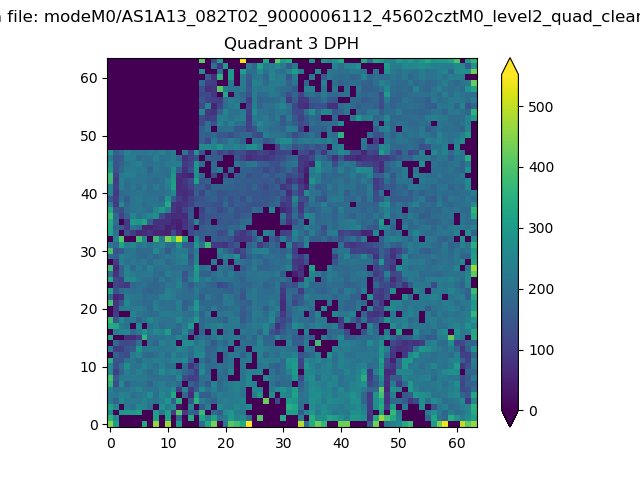 |
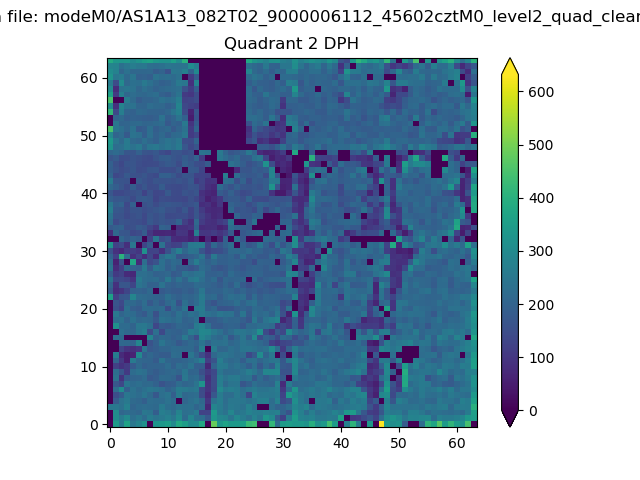 |
Quadrant C |
| Plot type | Count rate plots | Images |
|---|---|---|
| Comparison with Poisson distribution Blue bars denote a histogram of data divided into 1 sec bins. Red curve is a Poisson curve with rate = median count rate of data. |
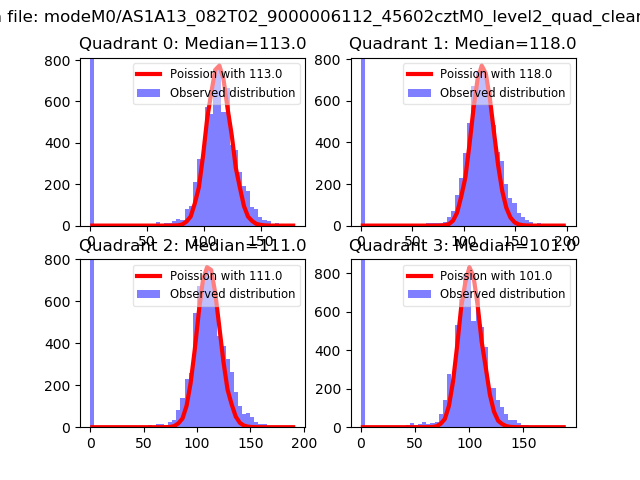 |
 |
| Quadrant-wise count rates Data is divided into 100 sec bins |
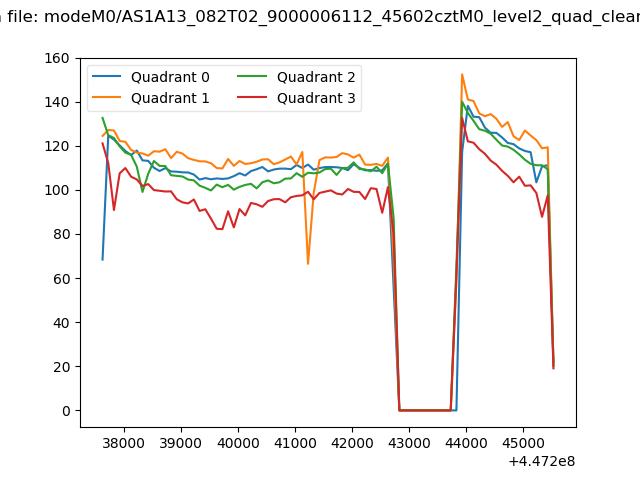 |
|
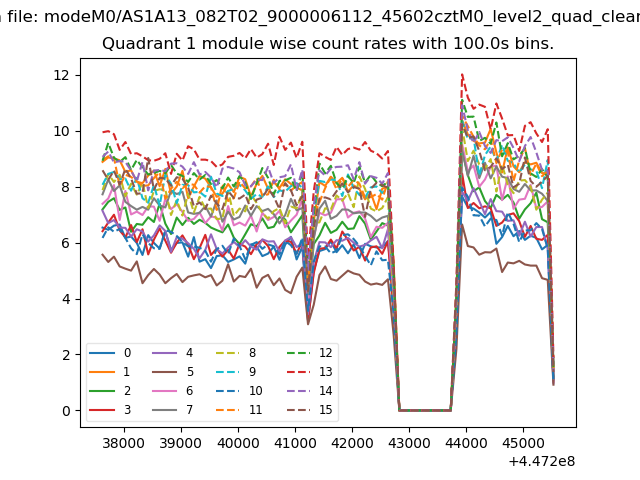
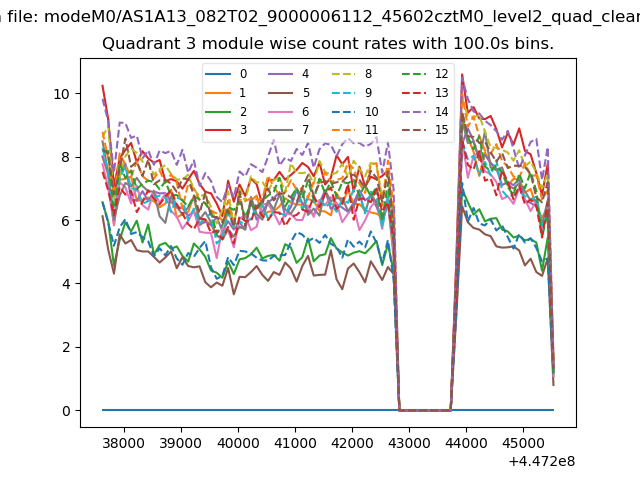
| Module-wise count rates for Quadrant A Data is divided into 100 sec bins |
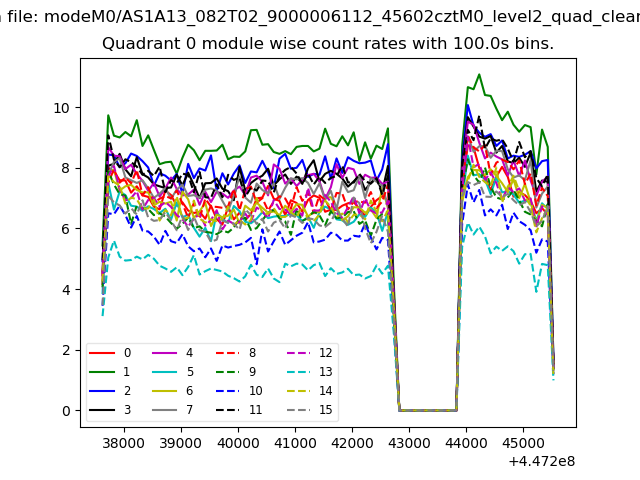 |
 |
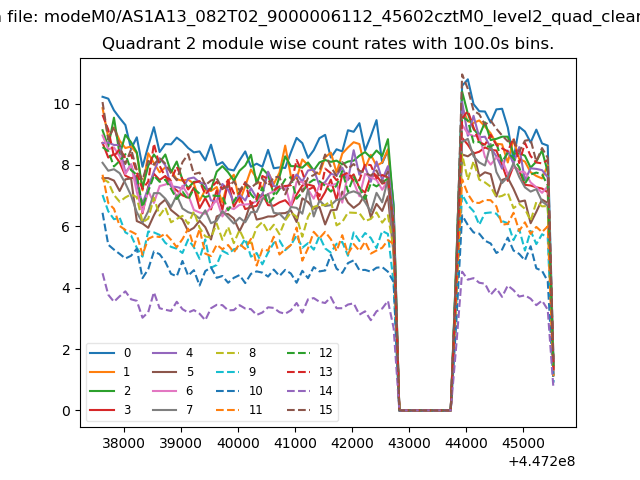
| Module-wise count rates for Quadrant B Data is divided into 100 sec bins |
 |
 |
| Module-wise count rates for Quadrant C Data is divided into 100 sec bins |
 |
 |
| Module-wise count rates for Quadrant D Data is divided into 100 sec bins |
 |
 |
| Parameter | Plot |
|---|---|
| CZT HV Monitor | 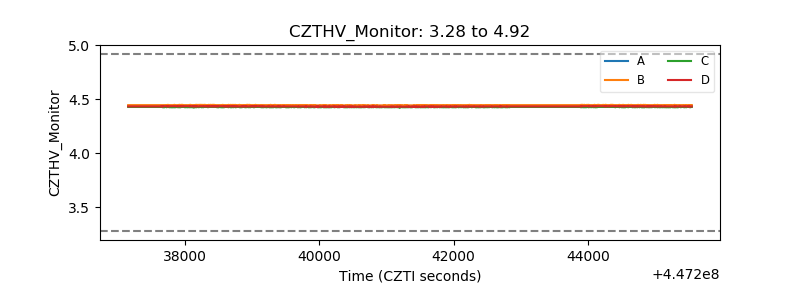 |
| D_VDD | 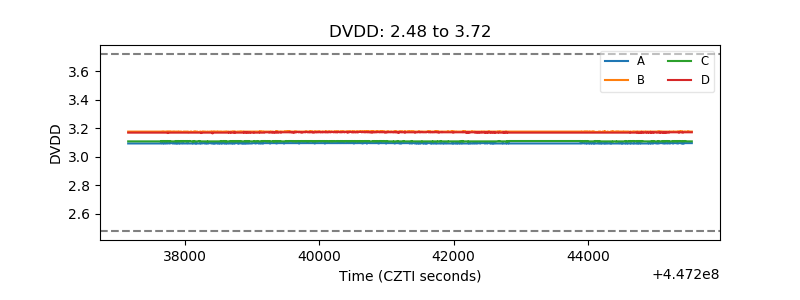 |
| Temperature 1 | 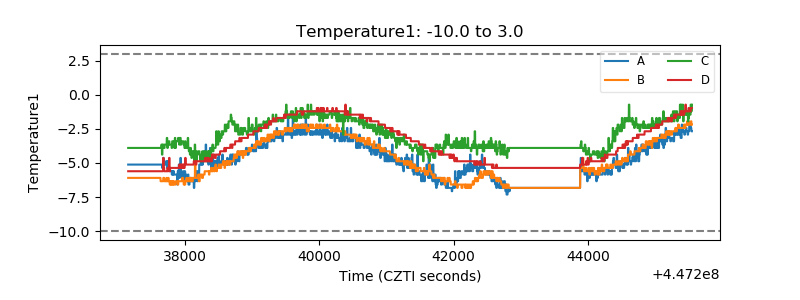 |
| Veto HV Monitor | 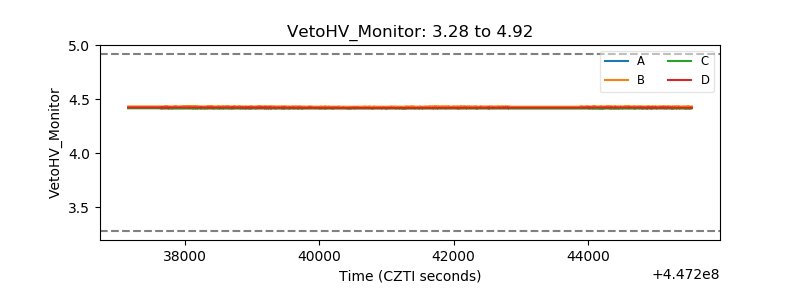 |
| Veto LLD | 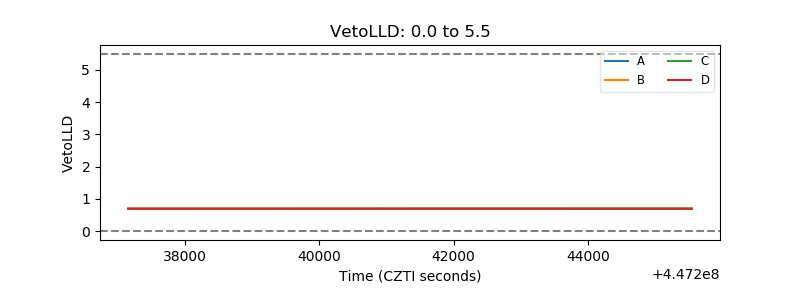 |
| Alpha Counter | 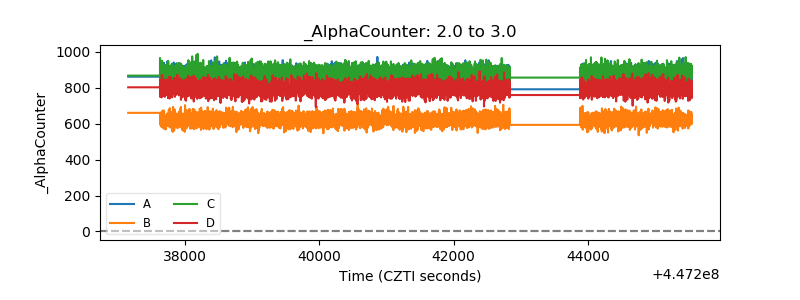 |
| _CPM_Rate | 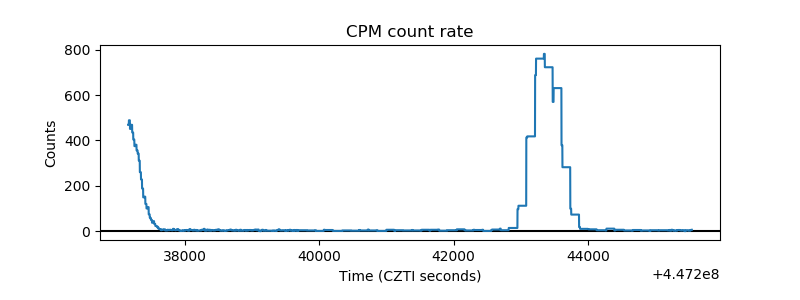 |
| CZT Counter | 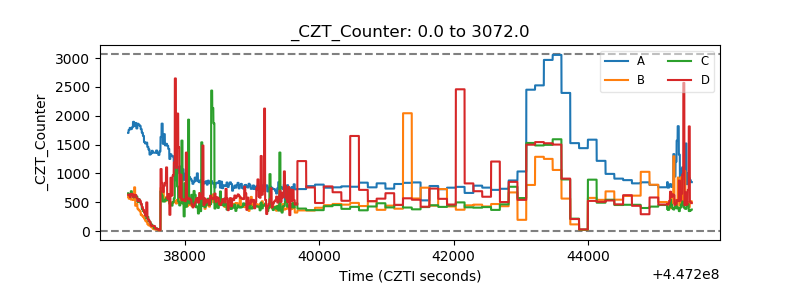 |
| +2.5 Volts monitor | 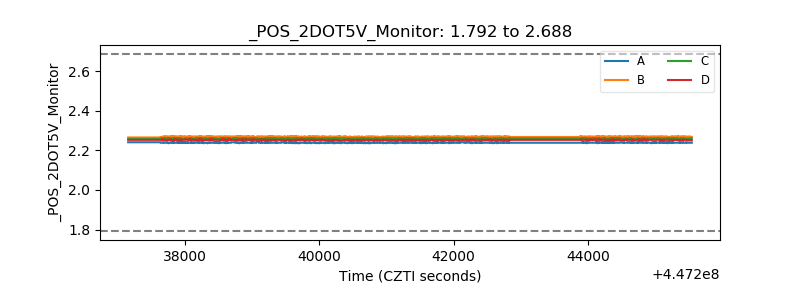 |
| +5 Volts monitor | 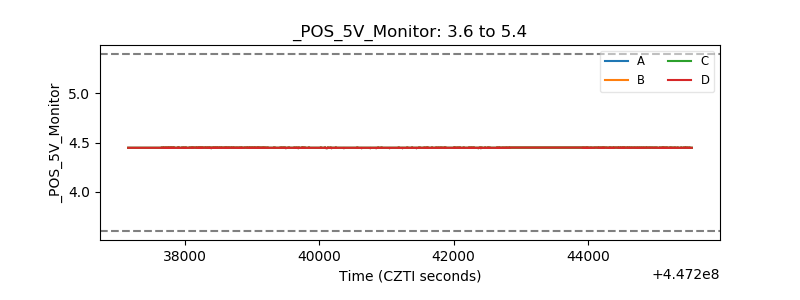 |
| _ROLL_ROT | 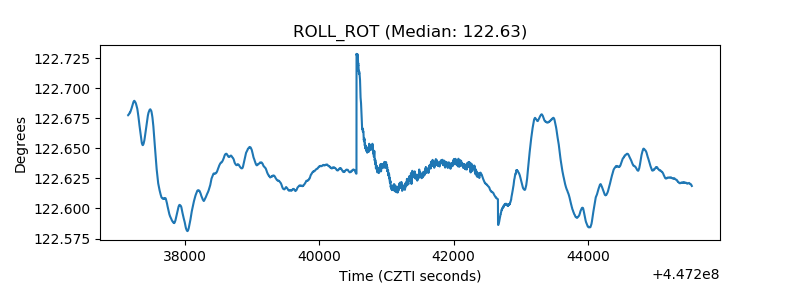 |
| _Roll_DEC | 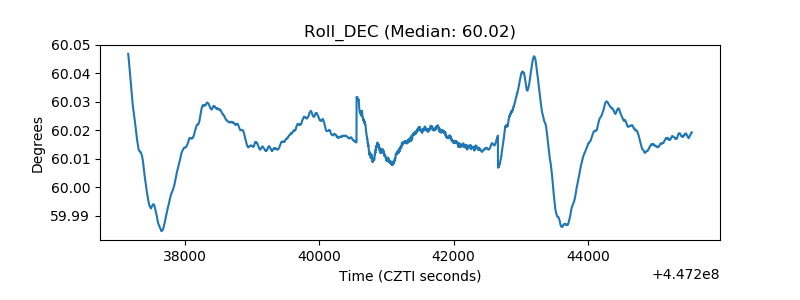 |
| _Roll_RA | 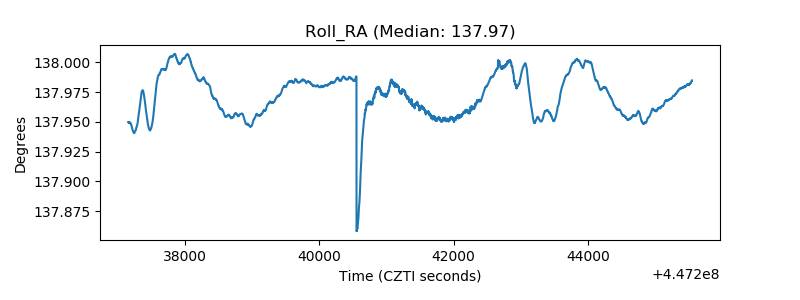 |
| Veto Counter | 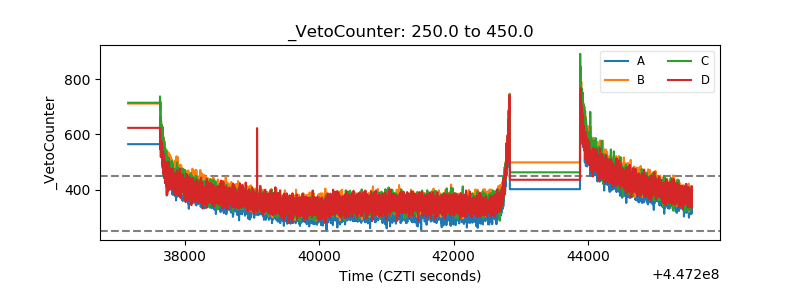 |