| Param | Original file | Final file |
|---|---|---|
| Filename | modeM0/AS1A13_082T02_9000006112_45603cztM0_level2.fits | modeM0/AS1A13_082T02_9000006112_45603cztM0_level2_quad_clean.evt |
| Size (bytes) | 496,154,880 | 116,942,400 |
| Size | 473.2 MB | 111.5 MB |
| Events in quadrant A | 6,024,683 | 780,927 |
| Events in quadrant B | 4,148,694 | 805,844 |
| Events in quadrant C | 3,338,468 | 778,069 |
| Events in quadrant D | 4,331,854 | 706,927 |
| Mode M0 | |||
|---|---|---|---|
| Quadrant | BADHDUFLAG | Total packets | Discarded packets |
| A | 0 | 22337 | 2 |
| B | 0 | 16814 | 2 |
| C | 0 | 14605 | 2 |
| D | 0 | 17220 | 2 |
| Mode M9 | |||
|---|---|---|---|
| Quadrant | BADHDUFLAG | Total packets | Discarded packets |
| A | 0 | 16 | 0 |
| B | 0 | 17 | 0 |
| C | 0 | 17 | 0 |
| D | 0 | 17 | 0 |
| Mode SS | |||
|---|---|---|---|
| Quadrant | BADHDUFLAG | Total packets | Discarded packets |
| A | 0 | 138 | 0 |
| B | 0 | 138 | 0 |
| C | 0 | 138 | 0 |
| D | 0 | 138 | 0 |
| Quadrant | Total seconds | Saturated seconds | Saturation percentage |
|---|---|---|---|
| A | 6728 | 305 | 4.533294% |
| B | 6728 | 367 | 5.454816% |
| C | 6728 | 90 | 1.337693% |
| D | 6728 | 163 | 2.422711% |
Noise dominated data is calculated using 1-second bins in cleaned event files. If a bin has >2000 counts, and if more than 50% of those come from <1% of pixels, then it is considered to be noise-dominated and hence unusable.
| Quadrant | # 1 sec bins | Bins with >0 counts | Bins with >2000 counts | High rate bins dominated by noise | Noise dominated (total time) | Noise dominated (detector-on time) | Marked lightcurve |
|---|---|---|---|---|---|---|---|
| A | 7878 | 6728 | 36 | 36 | 0.46% | 0.54% | 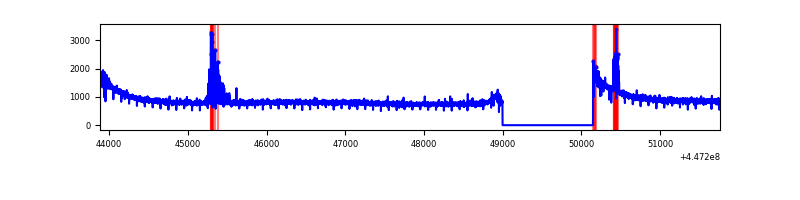 |
| B | 7878 | 6728 | 154 | 154 | 1.95% | 2.29% | 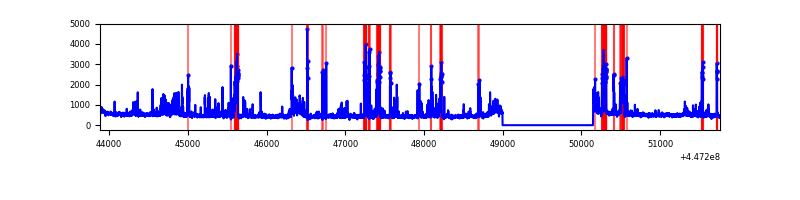 |
| C | 7878 | 6729 | 30 | 30 | 0.38% | 0.45% |  |
| D | 7878 | 6729 | 88 | 88 | 1.12% | 1.31% | 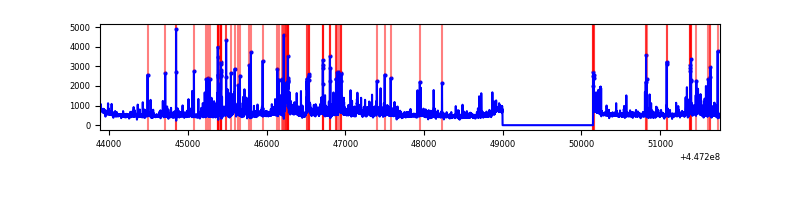 |
Top three noisy pixels from each quadrant. If the there are fewer than three noisy pixels in the level2.evt file, extra rows are filled as -1
| Pixel properties | Quadrant properties | ||||||
|---|---|---|---|---|---|---|---|
| Quadrant | DetID | PixID | Counts | Sigma | Mean | Median | Sigma |
| A | 10 | 83 | 2808480 | 17261.58 | 792 | 778 | 162.7 |
| A | 13 | 248 | 153835 | 940.99 | 792 | 778 | 162.7 |
| A | 3 | 137 | 8741 | 48.96 | 792 | 778 | 162.7 |
| B | 15 | 201 | 784005 | 5116.15 | 782 | 758 | 153.1 |
| B | 5 | 172 | 187443 | 1219.42 | 782 | 758 | 153.1 |
| B | 0 | 186 | 28807 | 183.22 | 782 | 758 | 153.1 |
| C | 14 | 254 | 288626 | 1577.98 | 776 | 781 | 182.4 |
| C | 3 | 233 | 13723 | 70.95 | 776 | 781 | 182.4 |
| C | 13 | 61 | 5191 | 24.18 | 776 | 781 | 182.4 |
| D | 11 | 241 | 379832 | 1942.54 | 778 | 756 | 195.1 |
| D | 1 | 52 | 174936 | 892.57 | 778 | 756 | 195.1 |
| D | 8 | 48 | 137154 | 698.96 | 778 | 756 | 195.1 |
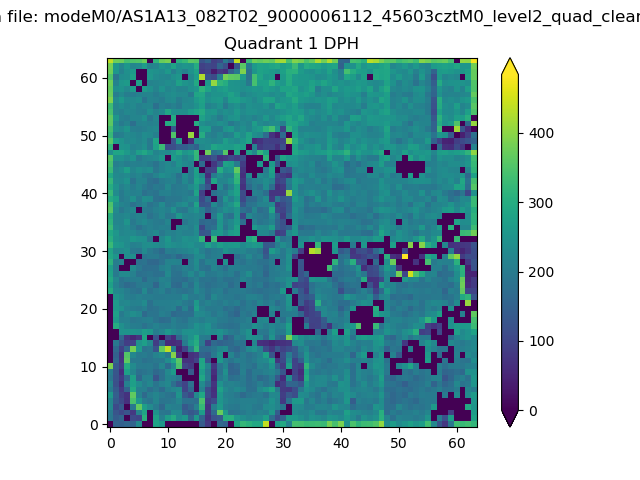
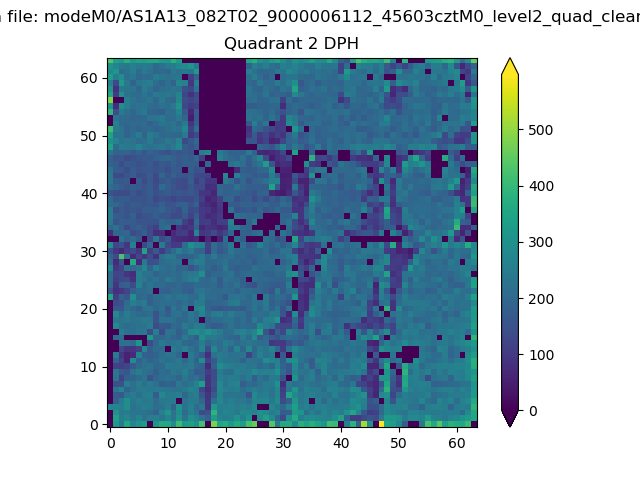
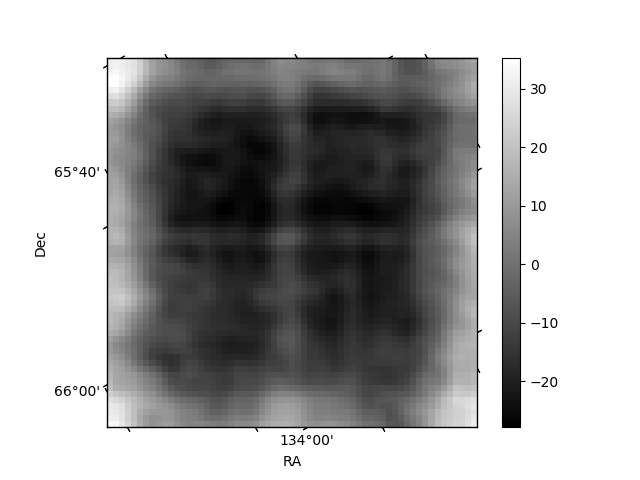
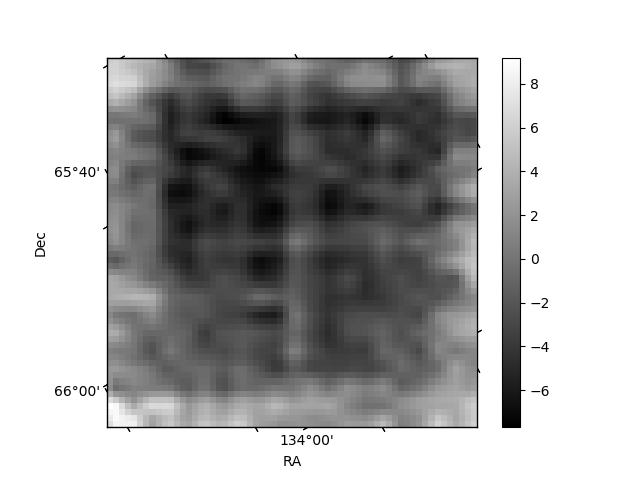
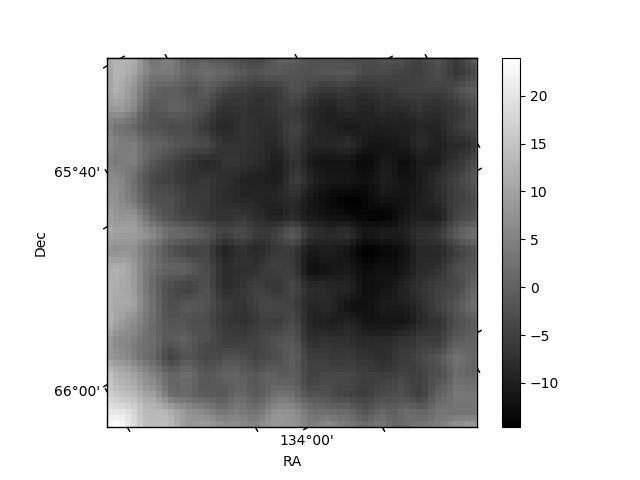
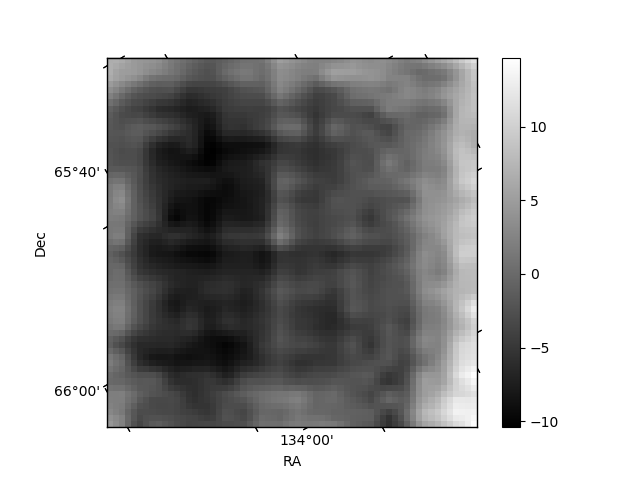
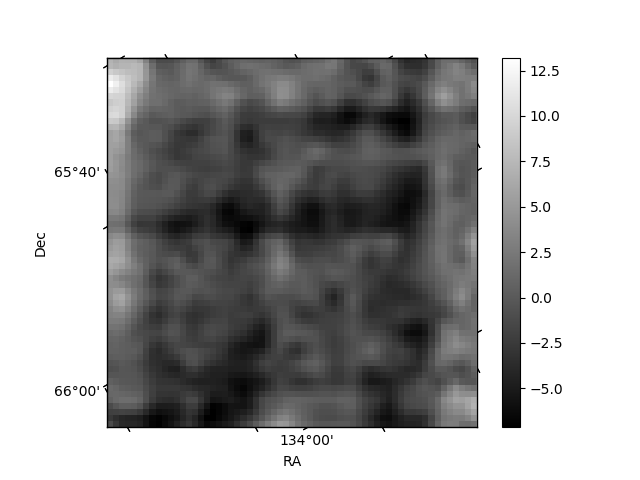
Histogram calculated using DETX and DETY for each event in the final _common_clean file
| Quadrant A | 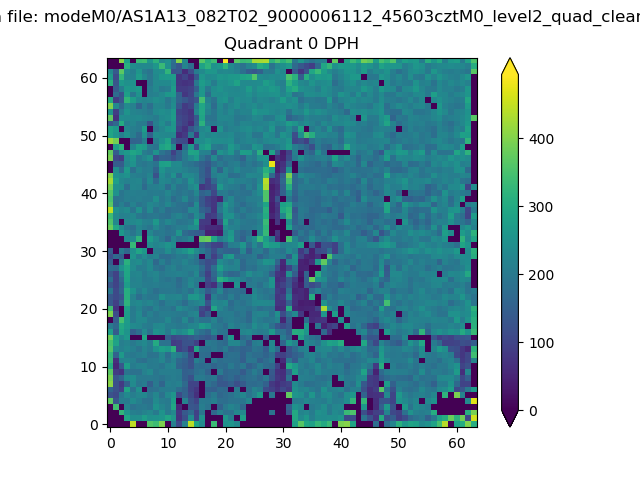 |
 |
Quadrant B |
|---|---|---|---|
| Quadrant D | 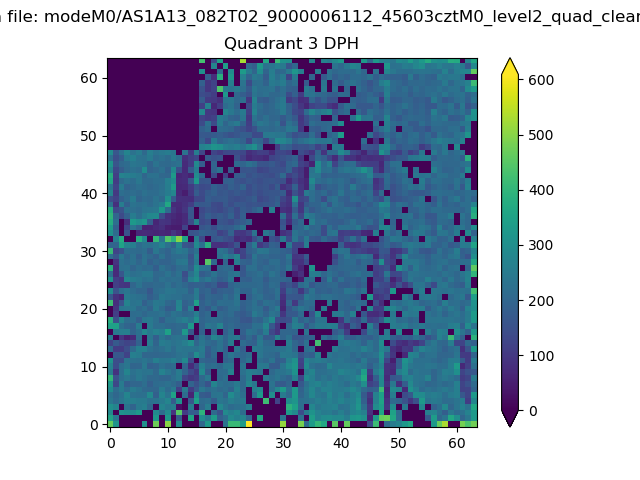 |
 |
Quadrant C |
| Plot type | Count rate plots | Images |
|---|---|---|
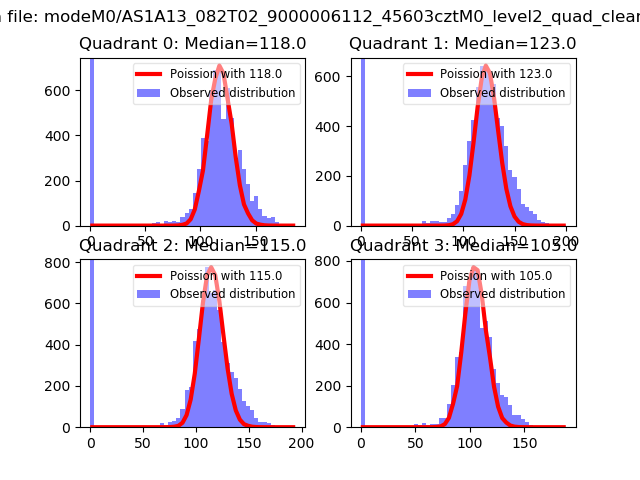
| Comparison with Poisson distribution Blue bars denote a histogram of data divided into 1 sec bins. Red curve is a Poisson curve with rate = median count rate of data. |
 |
 |
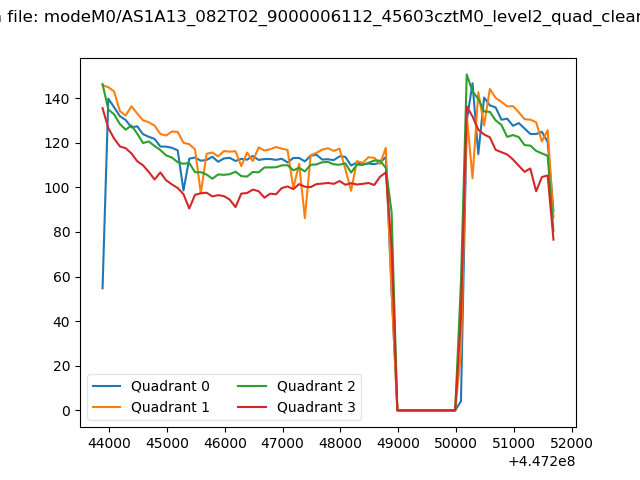
| Quadrant-wise count rates Data is divided into 100 sec bins |
 |
|
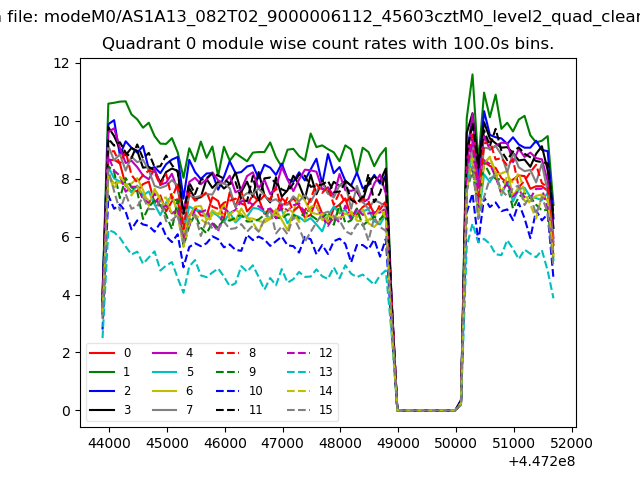
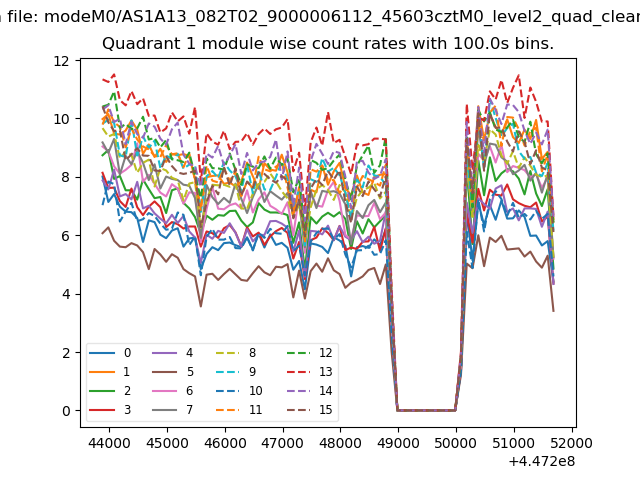
| Module-wise count rates for Quadrant A Data is divided into 100 sec bins |
 |
 |
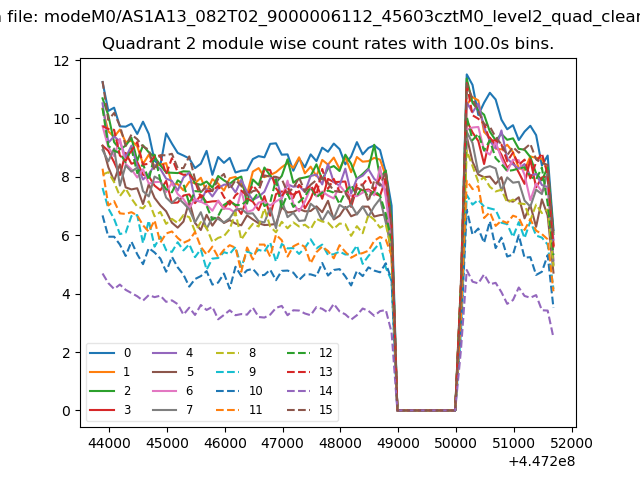
| Module-wise count rates for Quadrant B Data is divided into 100 sec bins |
 |
 |
| Module-wise count rates for Quadrant C Data is divided into 100 sec bins |
 |
 |
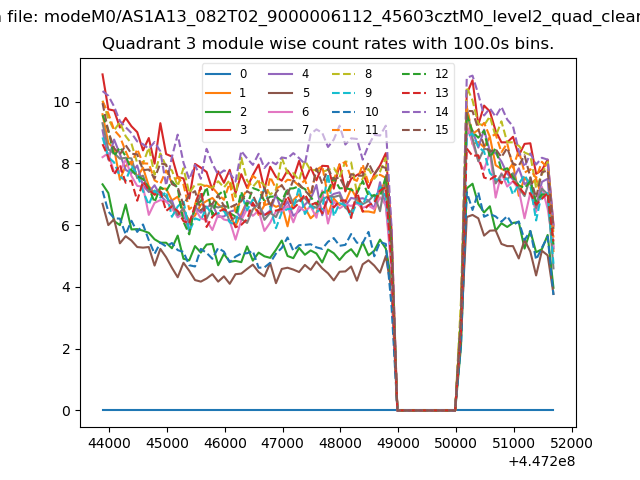
| Module-wise count rates for Quadrant D Data is divided into 100 sec bins |
 |
 |
| Parameter | Plot |
|---|---|
| CZT HV Monitor | 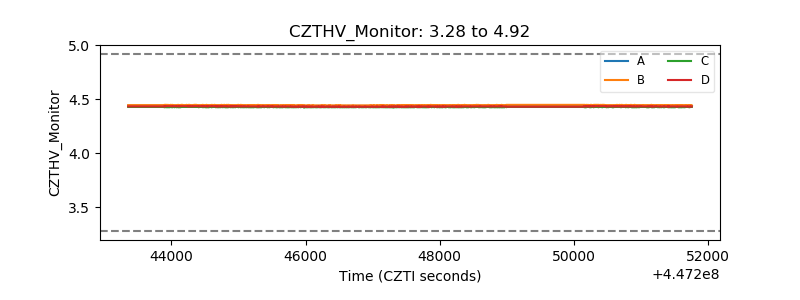 |
| D_VDD | 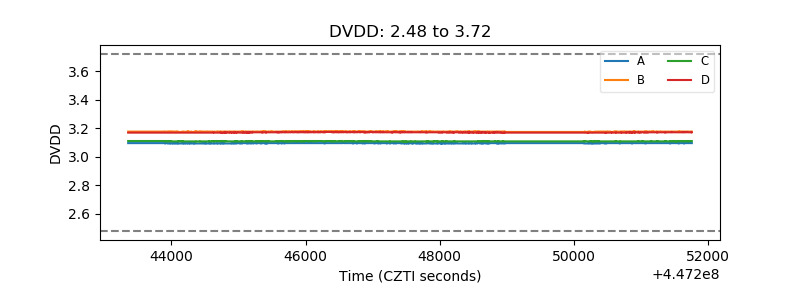 |
| Temperature 1 | 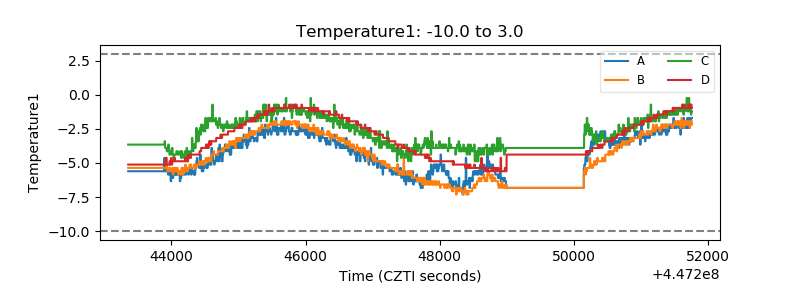 |
| Veto HV Monitor | 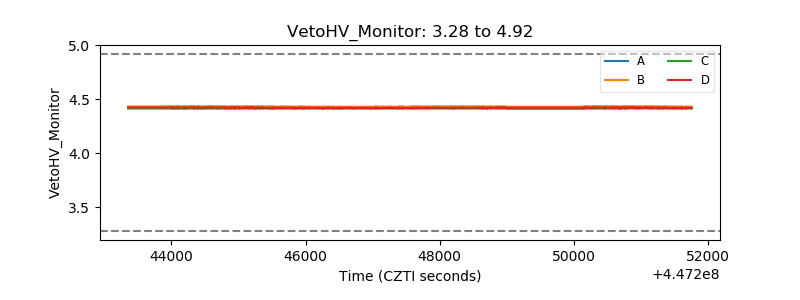 |
| Veto LLD | 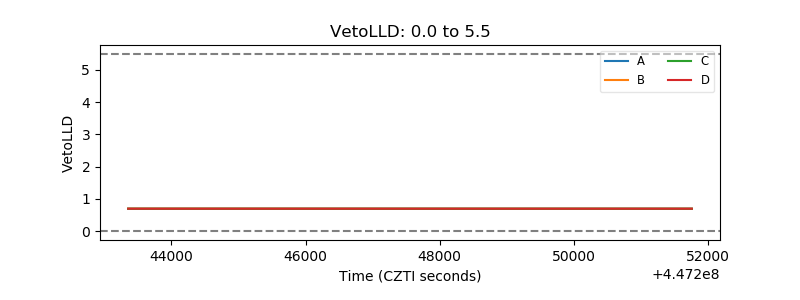 |
| Alpha Counter | 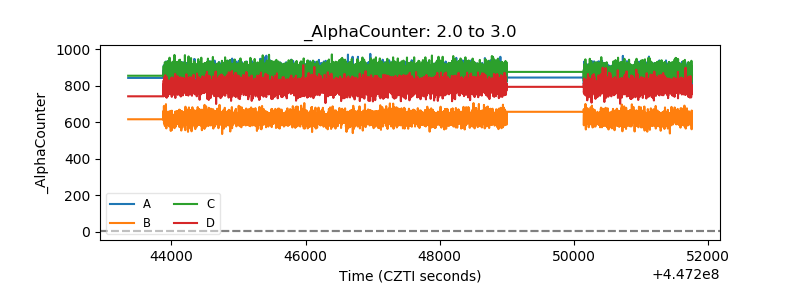 |
| _CPM_Rate | 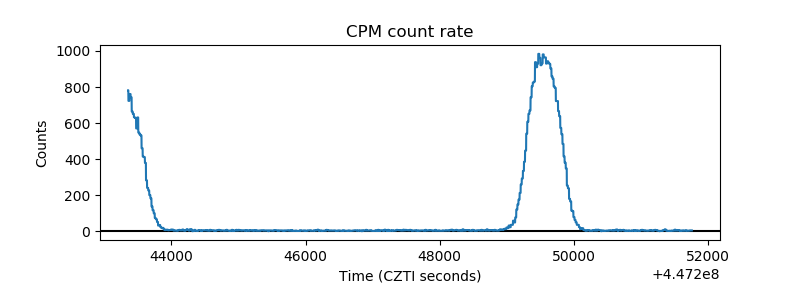 |
| CZT Counter | 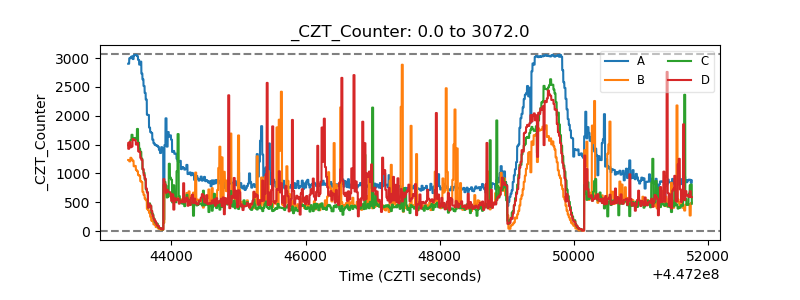 |
| +2.5 Volts monitor | 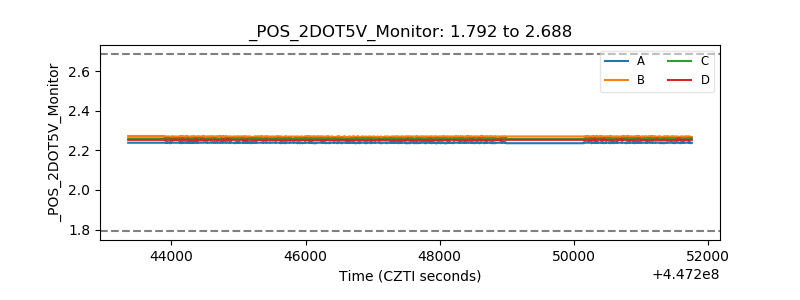 |
| +5 Volts monitor | 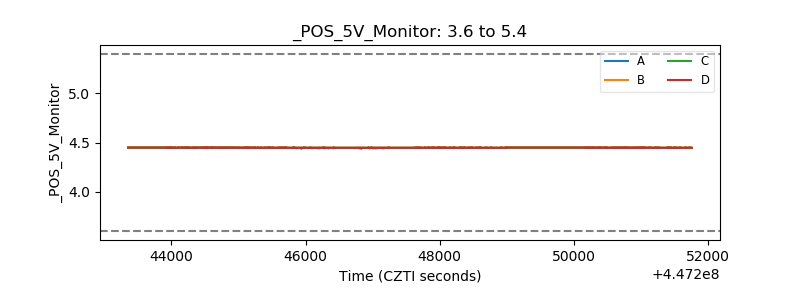 |
| _ROLL_ROT | 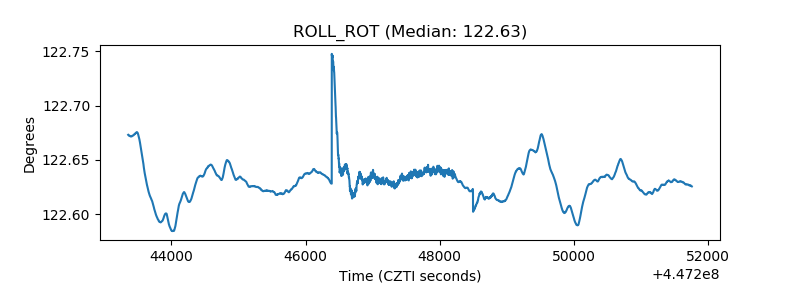 |
| _Roll_DEC | 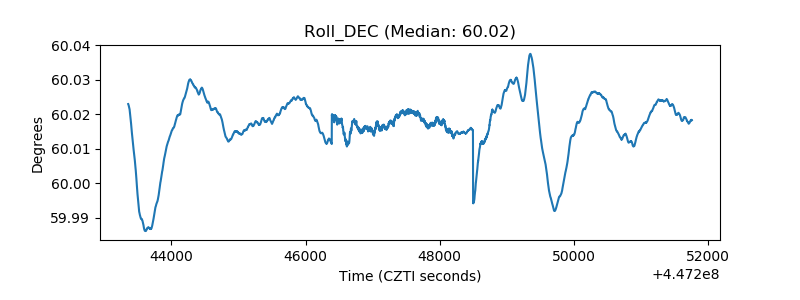 |
| _Roll_RA | 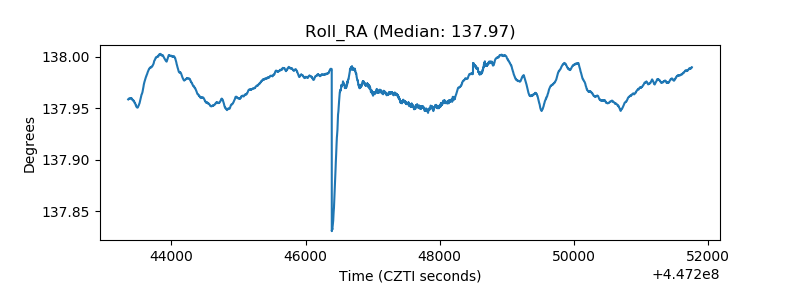 |
| Veto Counter | 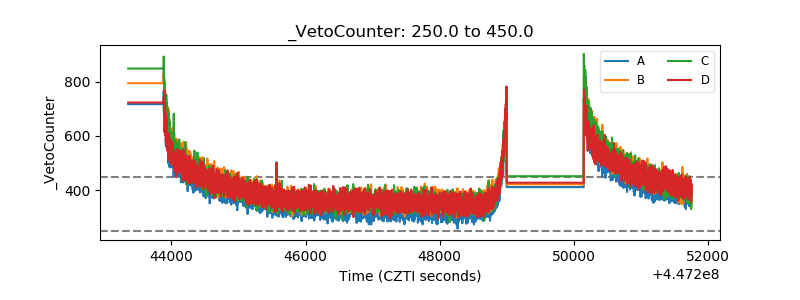 |