| Param | Original file | Final file |
|---|---|---|
| Filename | modeM0/AS1A13_082T02_9000006112_45604cztM0_level2.fits | modeM0/AS1A13_082T02_9000006112_45604cztM0_level2_quad_clean.evt |
| Size (bytes) | 480,044,160 | 113,808,960 |
| Size | 457.8 MB | 108.5 MB |
| Events in quadrant A | 5,723,524 | 770,596 |
| Events in quadrant B | 3,744,793 | 797,109 |
| Events in quadrant C | 3,237,989 | 757,705 |
| Events in quadrant D | 4,562,373 | 671,047 |
| Mode M0 | |||
|---|---|---|---|
| Quadrant | BADHDUFLAG | Total packets | Discarded packets |
| A | 0 | 21128 | 1 |
| B | 0 | 15392 | 1 |
| C | 0 | 13979 | 1 |
| D | 0 | 17849 | 1 |
| Mode M9 | |||
|---|---|---|---|
| Quadrant | BADHDUFLAG | Total packets | Discarded packets |
| A | 0 | 12 | 0 |
| B | 0 | 12 | 0 |
| C | 0 | 12 | 0 |
| D | 0 | 12 | 0 |
| Mode SS | |||
|---|---|---|---|
| Quadrant | BADHDUFLAG | Total packets | Discarded packets |
| A | 0 | 130 | 0 |
| B | 0 | 130 | 0 |
| C | 0 | 130 | 0 |
| D | 0 | 130 | 0 |
| Quadrant | Total seconds | Saturated seconds | Saturation percentage |
|---|---|---|---|
| A | 6453 | 258 | 3.998140% |
| B | 6453 | 280 | 4.339067% |
| C | 6452 | 137 | 2.123373% |
| D | 6453 | 315 | 4.881450% |
Noise dominated data is calculated using 1-second bins in cleaned event files. If a bin has >2000 counts, and if more than 50% of those come from <1% of pixels, then it is considered to be noise-dominated and hence unusable.
| Quadrant | # 1 sec bins | Bins with >0 counts | Bins with >2000 counts | High rate bins dominated by noise | Noise dominated (total time) | Noise dominated (detector-on time) | Marked lightcurve |
|---|---|---|---|---|---|---|---|
| A | 7603 | 6453 | 20 | 20 | 0.26% | 0.31% | 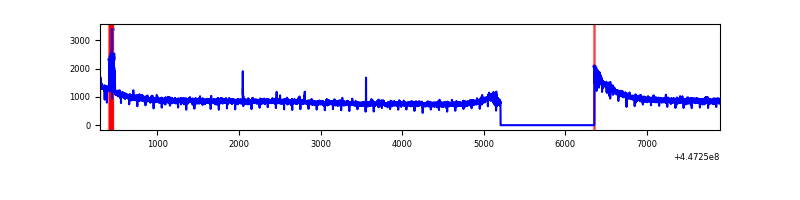 |
| B | 7603 | 6453 | 113 | 113 | 1.49% | 1.75% | 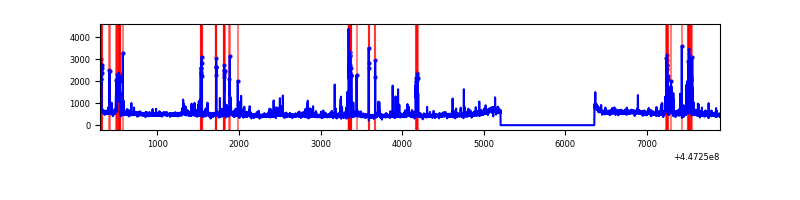 |
| C | 7602 | 6453 | 46 | 46 | 0.61% | 0.71% | 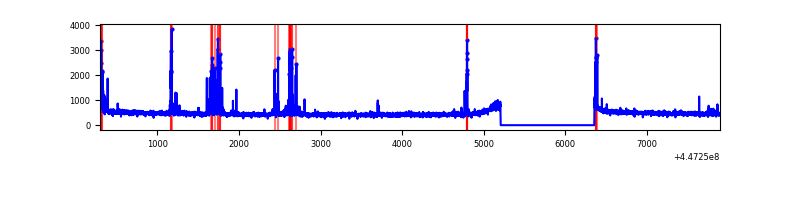 |
| D | 7603 | 6453 | 215 | 215 | 2.83% | 3.33% | 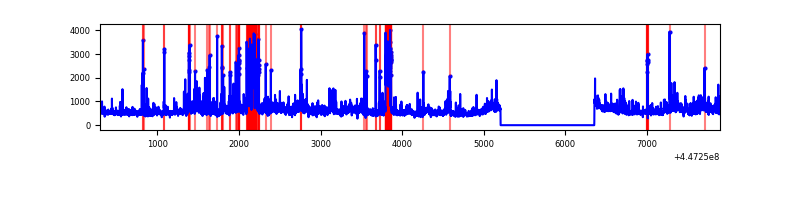 |
Top three noisy pixels from each quadrant. If the there are fewer than three noisy pixels in the level2.evt file, extra rows are filled as -1
| Pixel properties | Quadrant properties | ||||||
|---|---|---|---|---|---|---|---|
| Quadrant | DetID | PixID | Counts | Sigma | Mean | Median | Sigma |
| A | 10 | 83 | 2688977 | 16972.75 | 767 | 751 | 158.4 |
| A | 13 | 248 | 50086 | 311.49 | 767 | 751 | 158.4 |
| A | 7 | 191 | 10015 | 58.49 | 767 | 751 | 158.4 |
| B | 15 | 201 | 367704 | 2509.04 | 760 | 738 | 146.3 |
| B | 5 | 172 | 181510 | 1235.98 | 760 | 738 | 146.3 |
| B | 10 | 3 | 52553 | 354.27 | 760 | 738 | 146.3 |
| C | 14 | 254 | 269207 | 1527.45 | 753 | 756 | 175.8 |
| C | 3 | 233 | 25662 | 141.71 | 753 | 756 | 175.8 |
| C | 13 | 61 | 5173 | 25.13 | 753 | 756 | 175.8 |
| D | 11 | 241 | 622027 | 3335.3 | 747 | 723 | 186.3 |
| D | 5 | 33 | 283499 | 1518.0 | 747 | 723 | 186.3 |
| D | 13 | 249 | 212844 | 1138.71 | 747 | 723 | 186.3 |
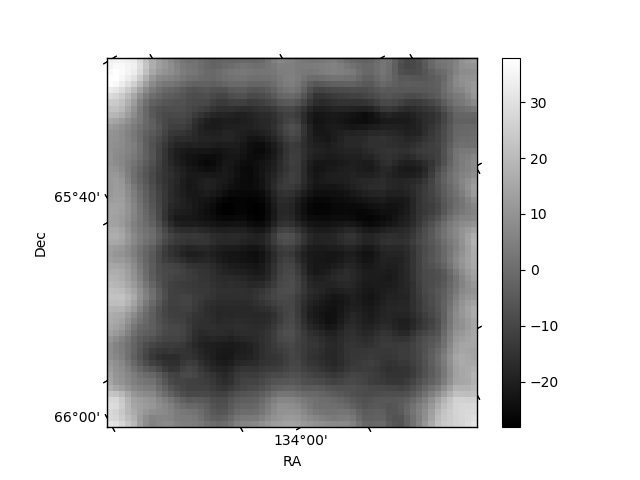
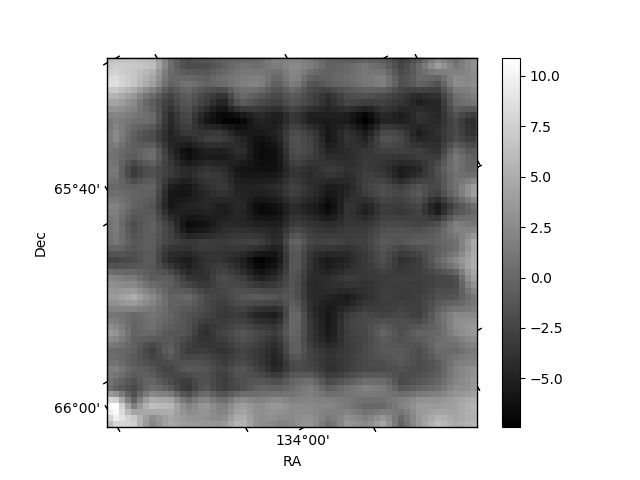
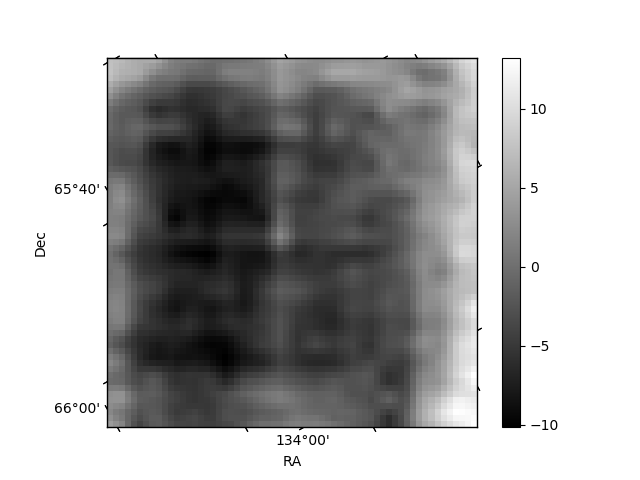
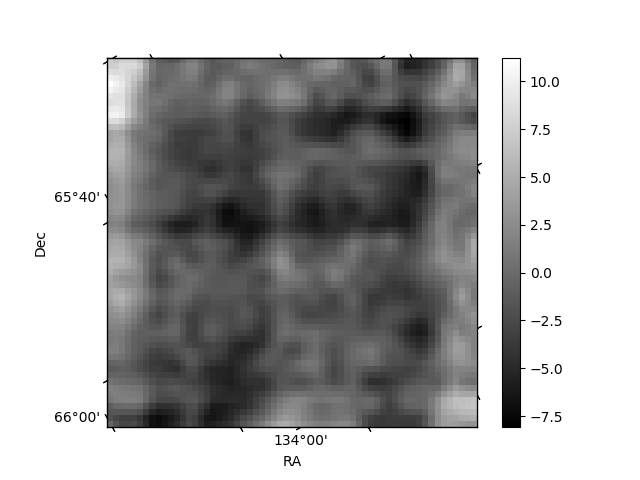
Histogram calculated using DETX and DETY for each event in the final _common_clean file
| Quadrant A | 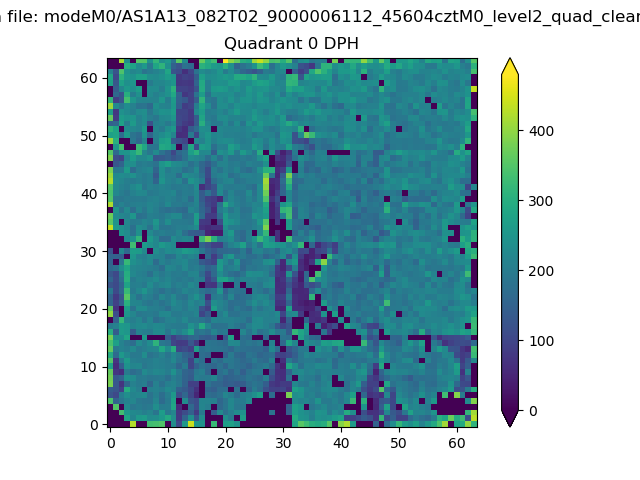 |
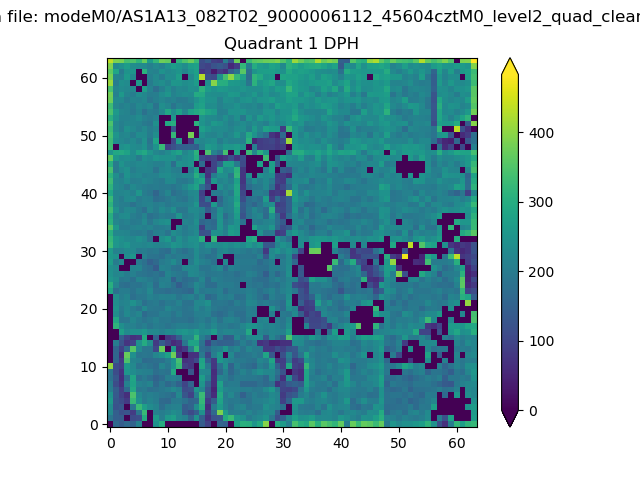 |
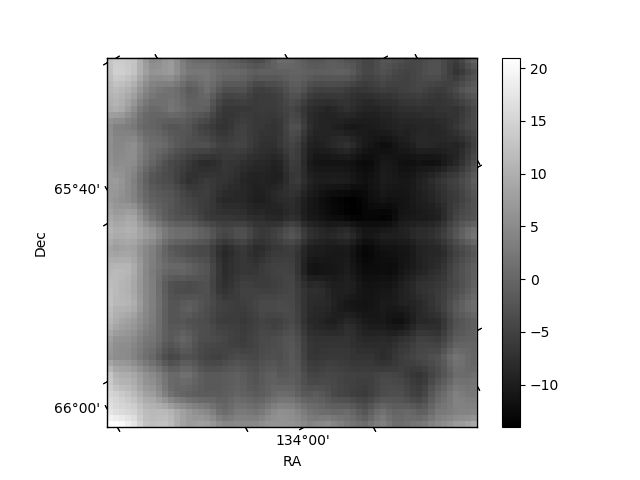
Quadrant B |
|---|---|---|---|
| Quadrant D | 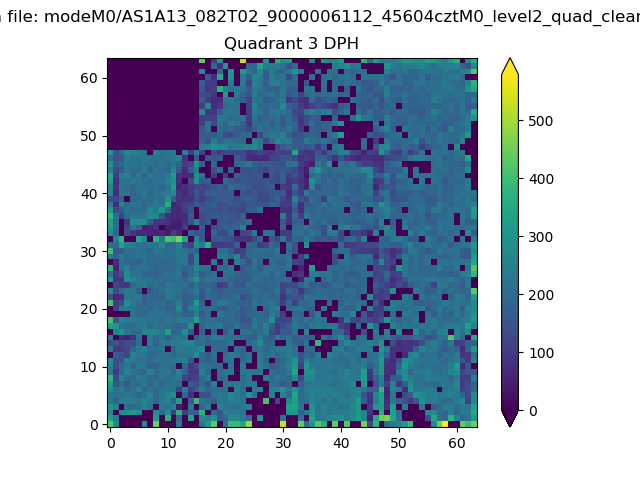 |
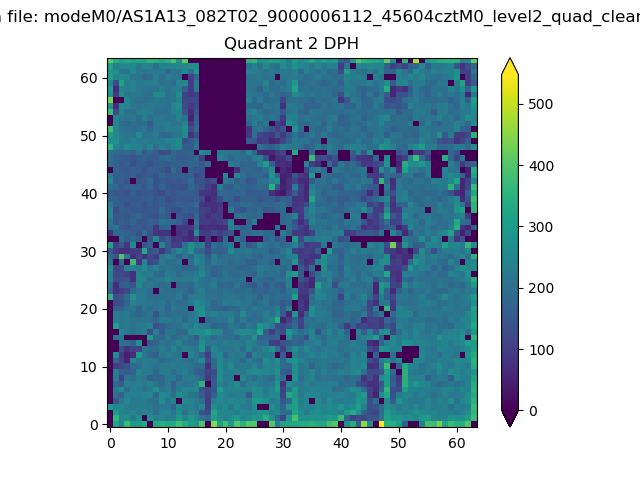 |
Quadrant C |
| Plot type | Count rate plots | Images |
|---|---|---|
| Comparison with Poisson distribution Blue bars denote a histogram of data divided into 1 sec bins. Red curve is a Poisson curve with rate = median count rate of data. |
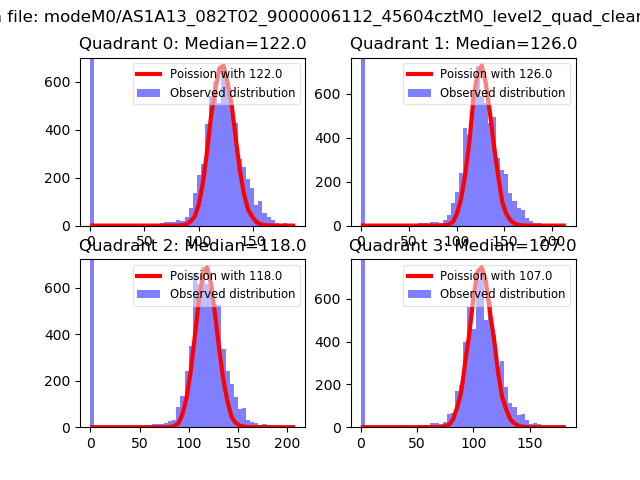 |
 |
| Quadrant-wise count rates Data is divided into 100 sec bins |
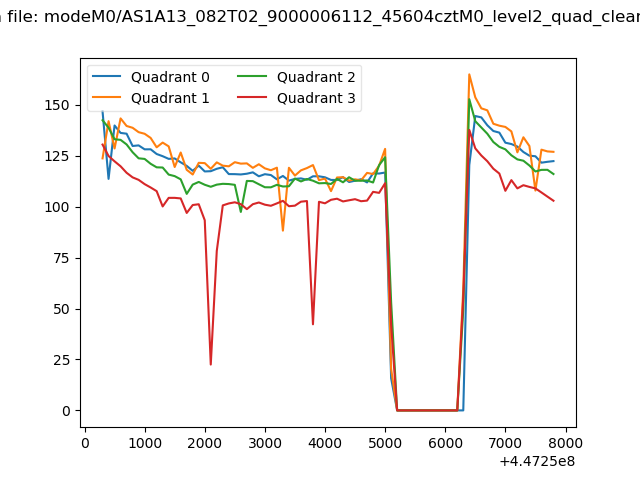 |
|
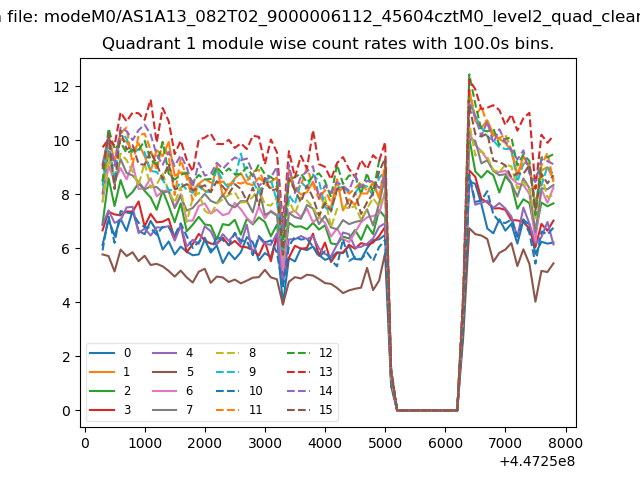
| Module-wise count rates for Quadrant A Data is divided into 100 sec bins |
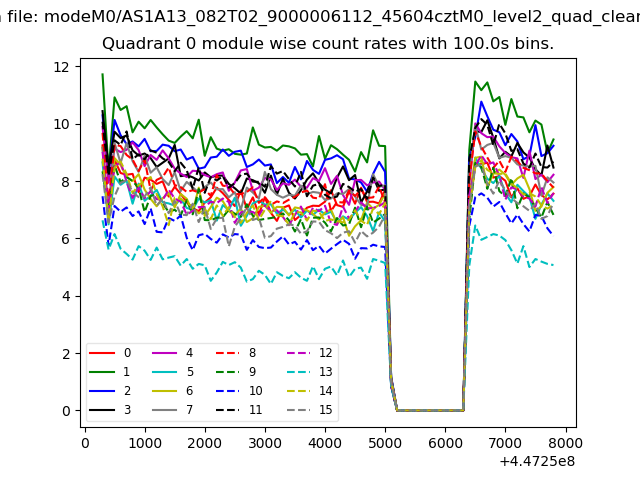 |
 |
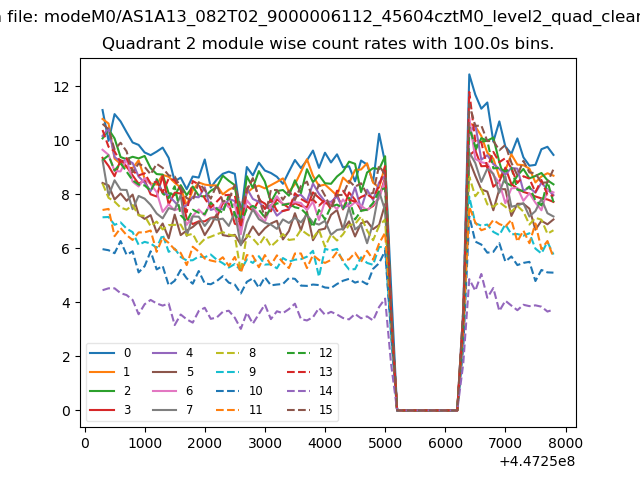
| Module-wise count rates for Quadrant B Data is divided into 100 sec bins |
 |
 |
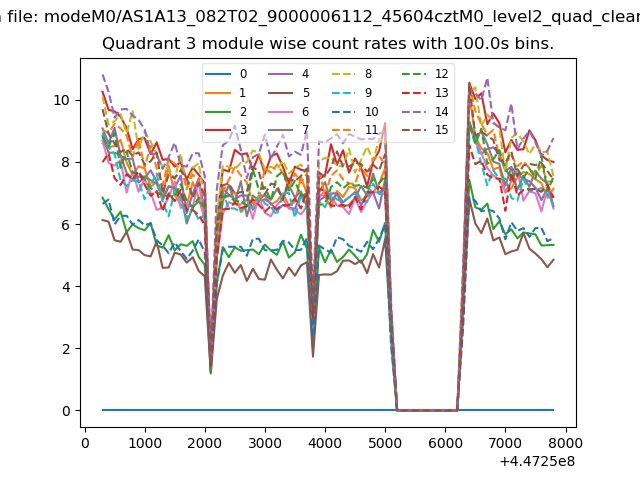
| Module-wise count rates for Quadrant C Data is divided into 100 sec bins |
 |
 |
| Module-wise count rates for Quadrant D Data is divided into 100 sec bins |
 |
 |
| Parameter | Plot |
|---|---|
| CZT HV Monitor |  |
| D_VDD | 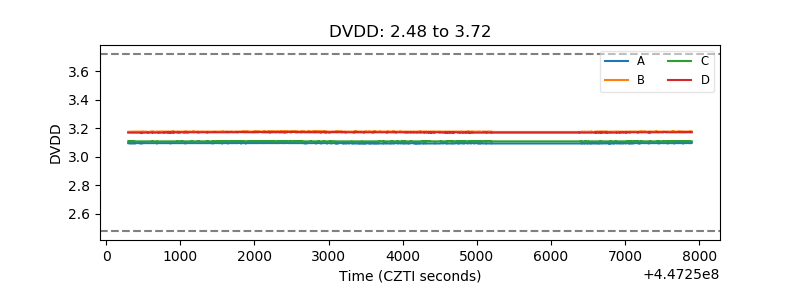 |
| Temperature 1 | 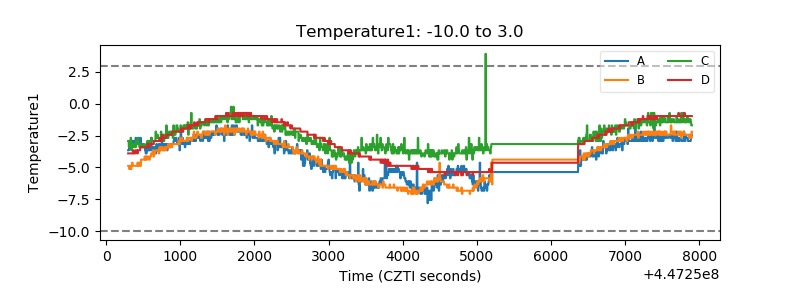 |
| Veto HV Monitor | 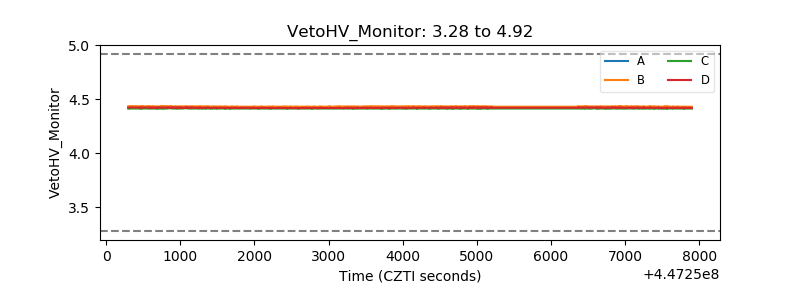 |
| Veto LLD | 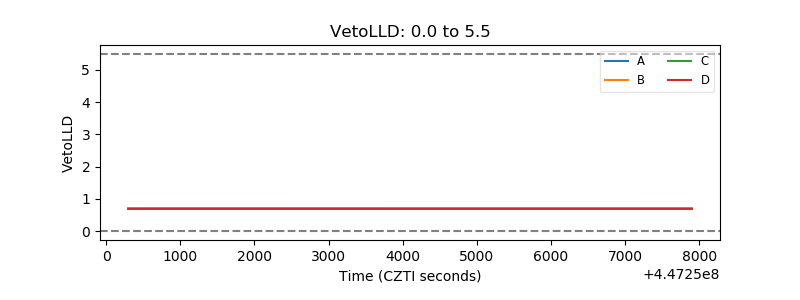 |
| Alpha Counter | 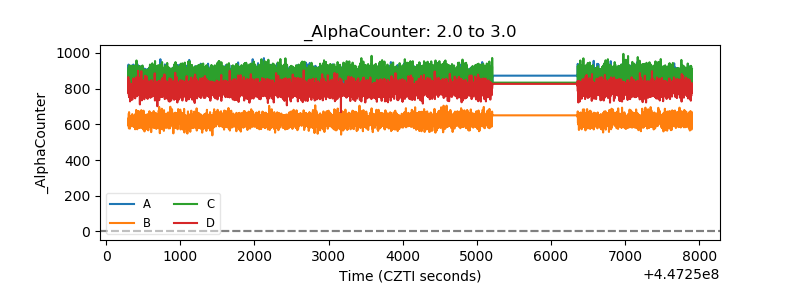 |
| _CPM_Rate | 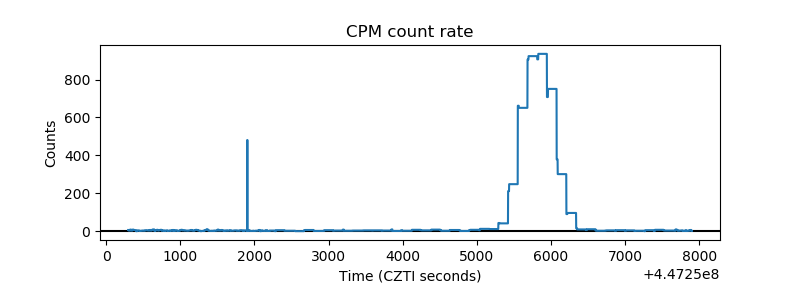 |
| CZT Counter | 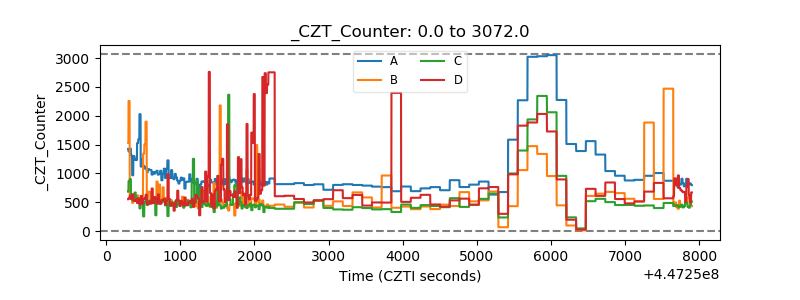 |
| +2.5 Volts monitor | 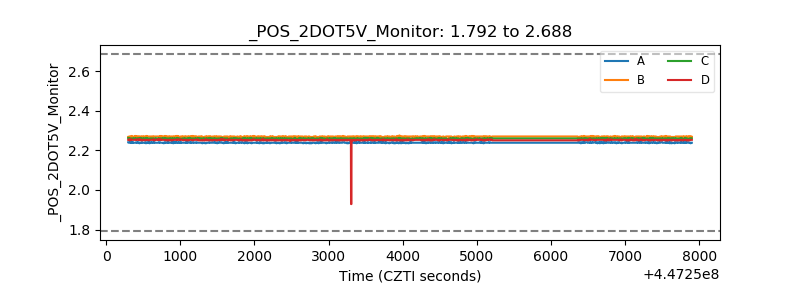 |
| +5 Volts monitor | 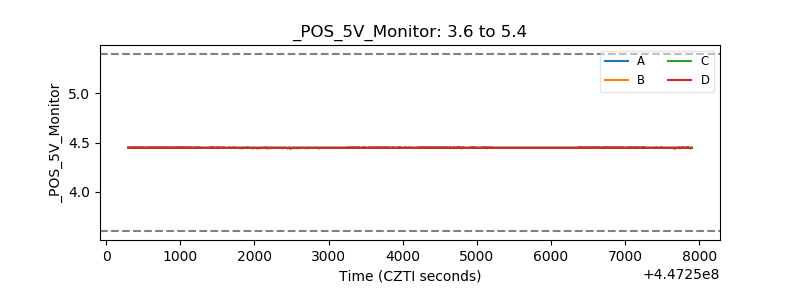 |
| _ROLL_ROT | 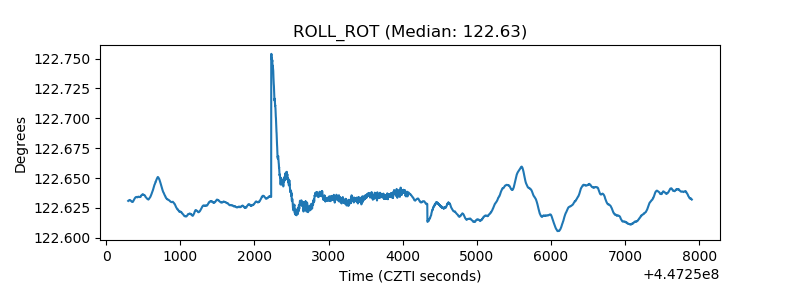 |
| _Roll_DEC | 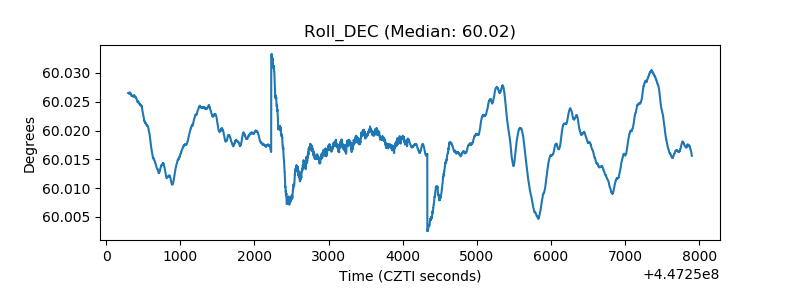 |
| _Roll_RA | 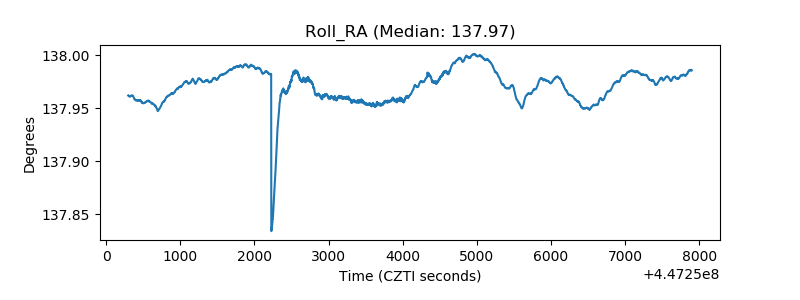 |
| Veto Counter | 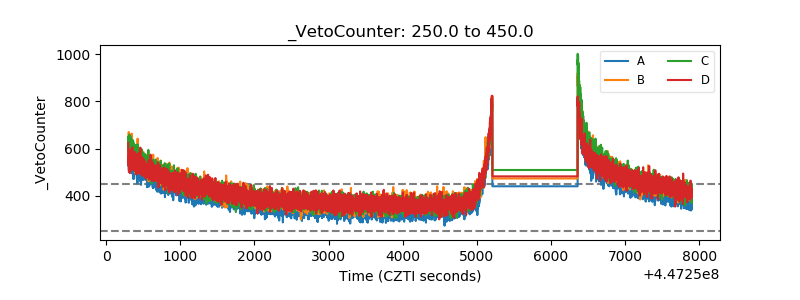 |