| Param | Original file | Final file |
|---|---|---|
| Filename | modeM0/AS1A13_082T02_9000006112_45605cztM0_level2.fits | modeM0/AS1A13_082T02_9000006112_45605cztM0_level2_quad_clean.evt |
| Size (bytes) | 443,088,000 | 109,114,560 |
| Size | 422.6 MB | 104.1 MB |
| Events in quadrant A | 5,402,808 | 727,323 |
| Events in quadrant B | 3,323,418 | 762,348 |
| Events in quadrant C | 3,026,652 | 724,043 |
| Events in quadrant D | 4,163,661 | 654,768 |
| Mode M0 | |||
|---|---|---|---|
| Quadrant | BADHDUFLAG | Total packets | Discarded packets |
| A | 0 | 20216 | 1 |
| B | 0 | 14146 | 1 |
| C | 0 | 13364 | 1 |
| D | 0 | 16593 | 1 |
| Mode M9 | |||
|---|---|---|---|
| Quadrant | BADHDUFLAG | Total packets | Discarded packets |
| A | 0 | 12 | 0 |
| B | 0 | 12 | 0 |
| C | 0 | 12 | 0 |
| D | 0 | 12 | 0 |
| Mode SS | |||
|---|---|---|---|
| Quadrant | BADHDUFLAG | Total packets | Discarded packets |
| A | 0 | 126 | 0 |
| B | 0 | 126 | 0 |
| C | 0 | 126 | 0 |
| D | 0 | 126 | 0 |
| Quadrant | Total seconds | Saturated seconds | Saturation percentage |
|---|---|---|---|
| A | 6245 | 261 | 4.179343% |
| B | 6246 | 195 | 3.121998% |
| C | 6245 | 127 | 2.033627% |
| D | 6245 | 171 | 2.738191% |
Noise dominated data is calculated using 1-second bins in cleaned event files. If a bin has >2000 counts, and if more than 50% of those come from <1% of pixels, then it is considered to be noise-dominated and hence unusable.
| Quadrant | # 1 sec bins | Bins with >0 counts | Bins with >2000 counts | High rate bins dominated by noise | Noise dominated (total time) | Noise dominated (detector-on time) | Marked lightcurve |
|---|---|---|---|---|---|---|---|
| A | 7375 | 6245 | 16 | 16 | 0.22% | 0.26% | 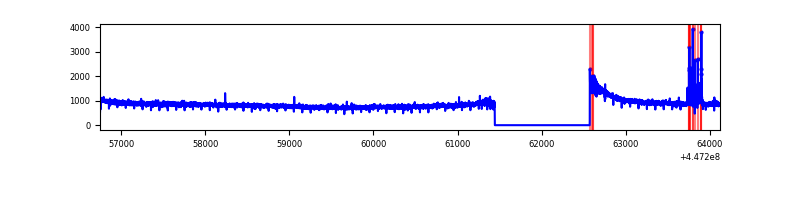 |
| B | 7376 | 6246 | 52 | 52 | 0.70% | 0.83% | 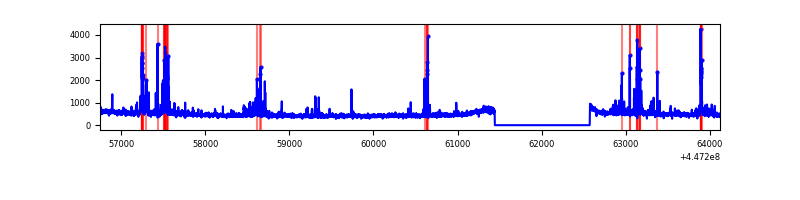 |
| C | 7375 | 6245 | 32 | 32 | 0.43% | 0.51% | 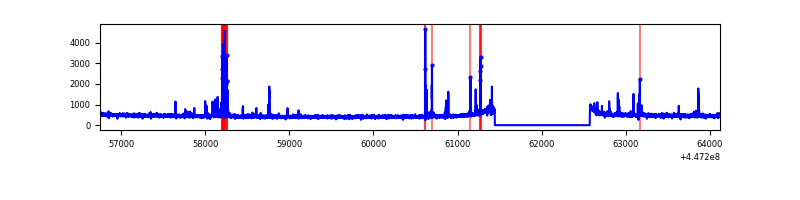 |
| D | 7375 | 6245 | 50 | 50 | 0.68% | 0.80% | 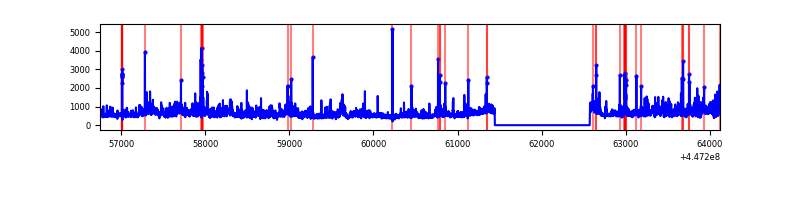 |
Top three noisy pixels from each quadrant. If the there are fewer than three noisy pixels in the level2.evt file, extra rows are filled as -1
| Pixel properties | Quadrant properties | ||||||
|---|---|---|---|---|---|---|---|
| Quadrant | DetID | PixID | Counts | Sigma | Mean | Median | Sigma |
| A | 10 | 83 | 2538317 | 17193.59 | 723 | 707 | 147.6 |
| A | 10 | 248 | 58675 | 392.76 | 723 | 707 | 147.6 |
| A | 0 | 243 | 10769 | 68.18 | 723 | 707 | 147.6 |
| B | 5 | 172 | 124350 | 879.85 | 725 | 703 | 140.5 |
| B | 7 | 221 | 106758 | 754.67 | 725 | 703 | 140.5 |
| B | 15 | 201 | 88095 | 621.87 | 725 | 703 | 140.5 |
| C | 14 | 254 | 213500 | 1268.51 | 720 | 725 | 167.7 |
| C | 13 | 61 | 4817 | 24.4 | 720 | 725 | 167.7 |
| C | 14 | 67 | 2578 | 11.05 | 720 | 725 | 167.7 |
| D | 11 | 241 | 807419 | 4508.14 | 718 | 695 | 178.9 |
| D | 1 | 52 | 109286 | 606.83 | 718 | 695 | 178.9 |
| D | 11 | 224 | 107707 | 598.01 | 718 | 695 | 178.9 |
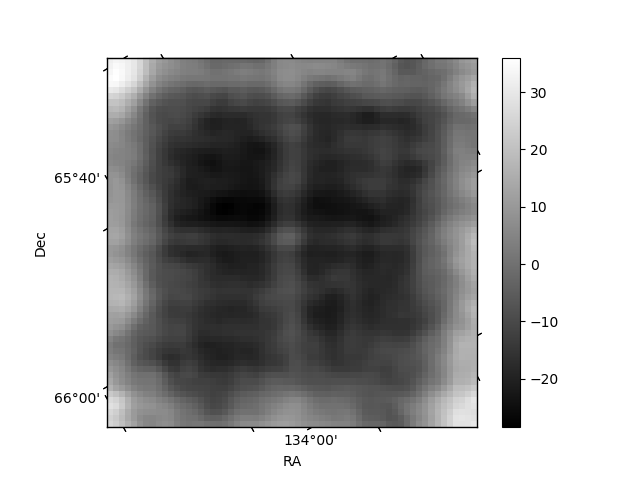
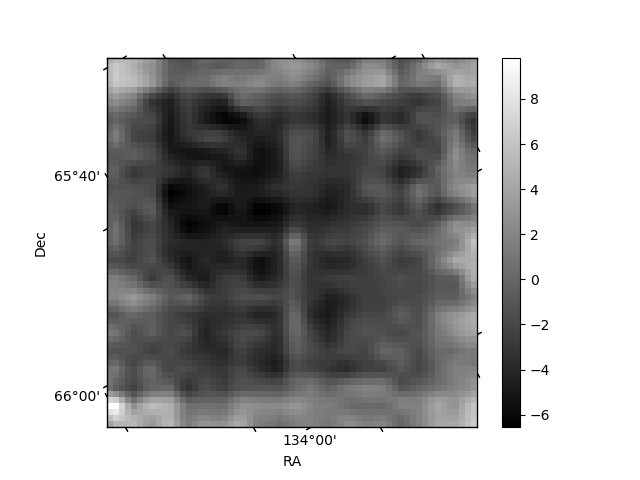
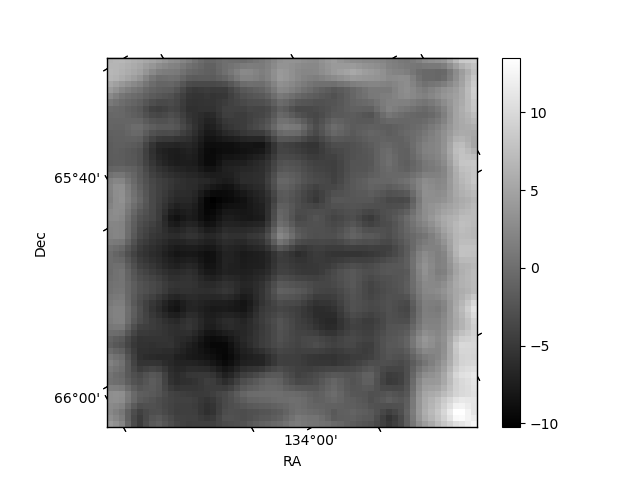
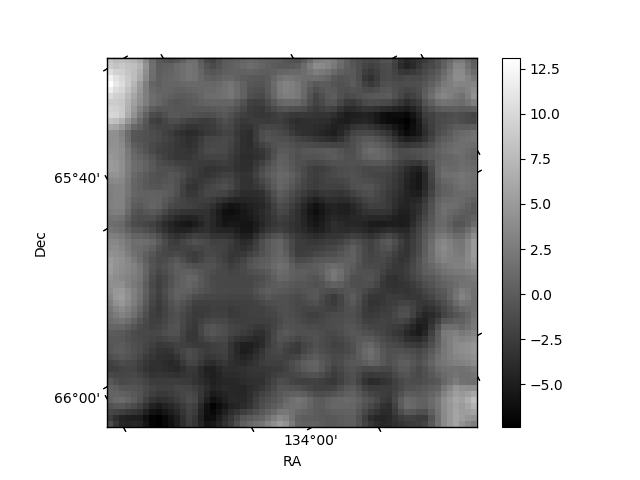
Histogram calculated using DETX and DETY for each event in the final _common_clean file
| Quadrant A | 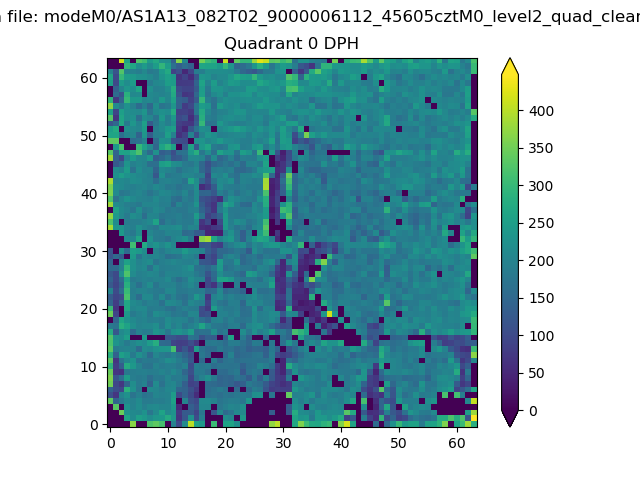 |
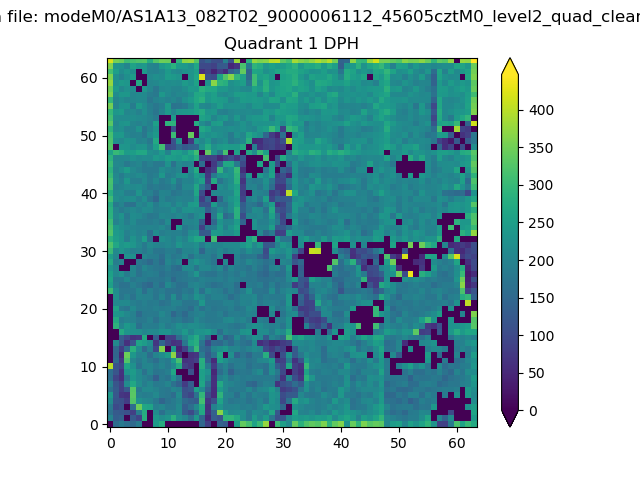 |
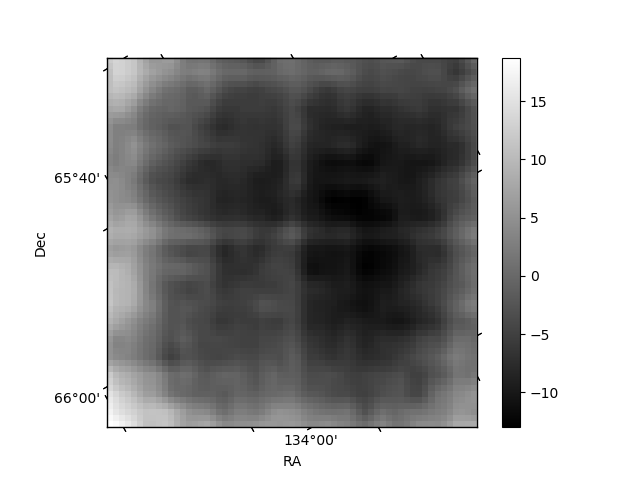
Quadrant B |
|---|---|---|---|
| Quadrant D | 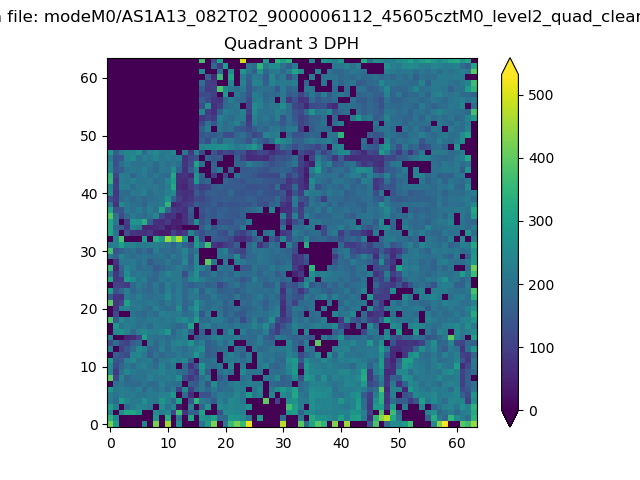 |
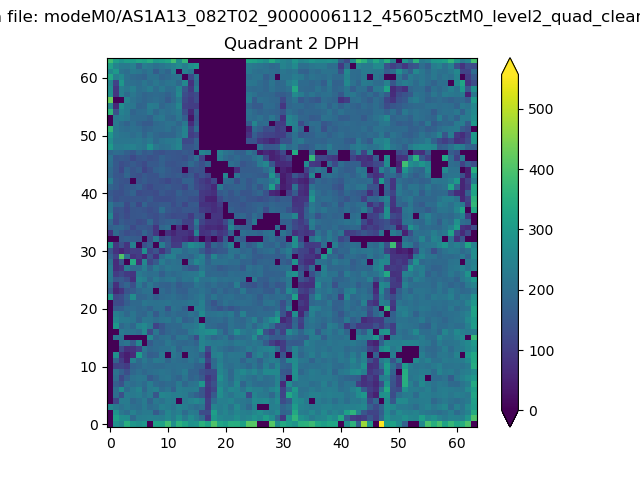 |
Quadrant C |
| Plot type | Count rate plots | Images |
|---|---|---|
| Comparison with Poisson distribution Blue bars denote a histogram of data divided into 1 sec bins. Red curve is a Poisson curve with rate = median count rate of data. |
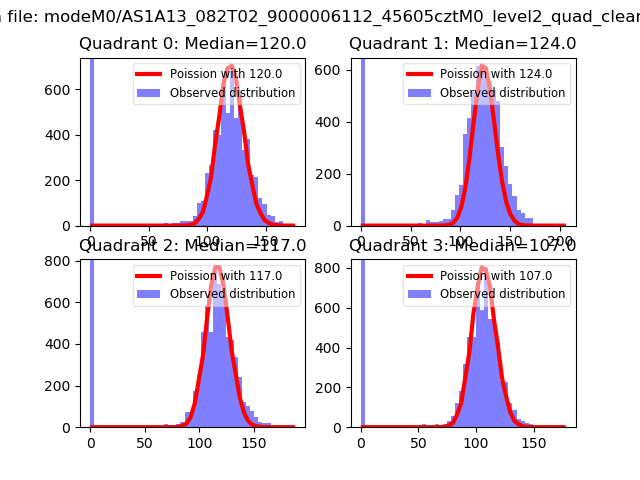 |
 |
| Quadrant-wise count rates Data is divided into 100 sec bins |
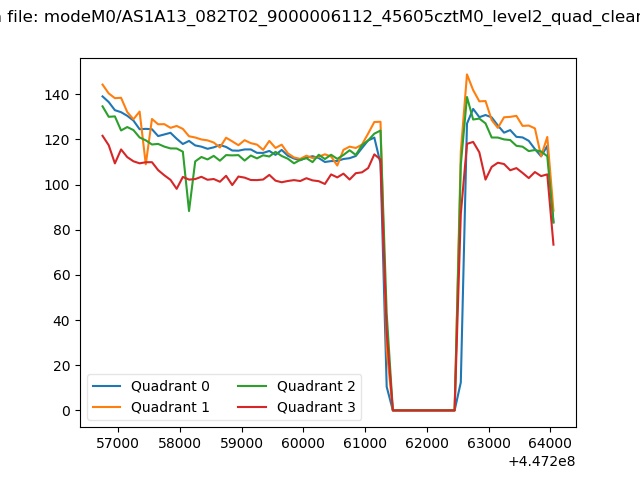 |
|
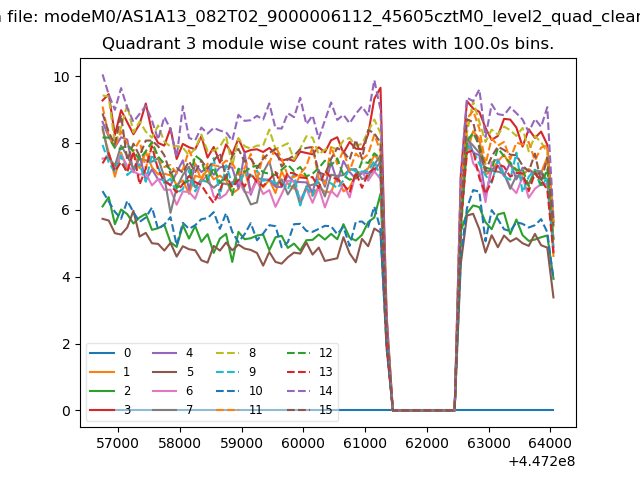
| Module-wise count rates for Quadrant A Data is divided into 100 sec bins |
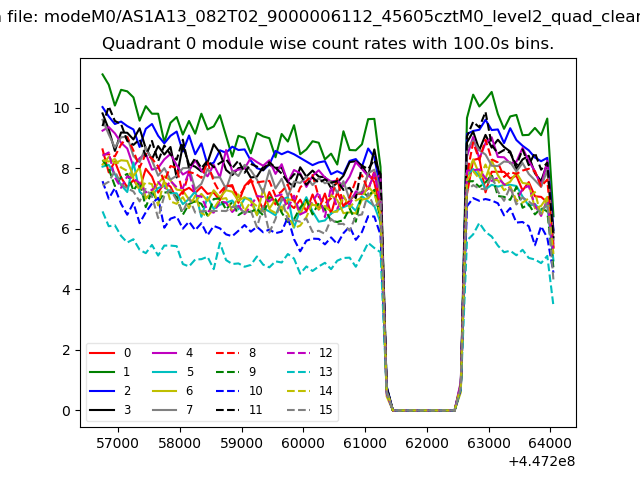 |
 |
| Module-wise count rates for Quadrant B Data is divided into 100 sec bins |
 |
 |
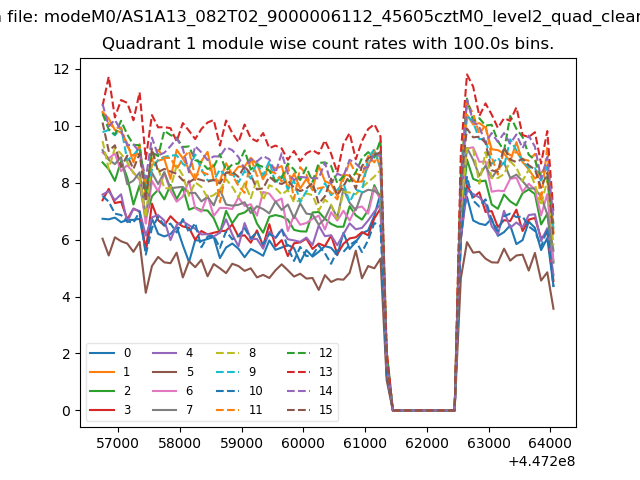
| Module-wise count rates for Quadrant C Data is divided into 100 sec bins |
 |
 |
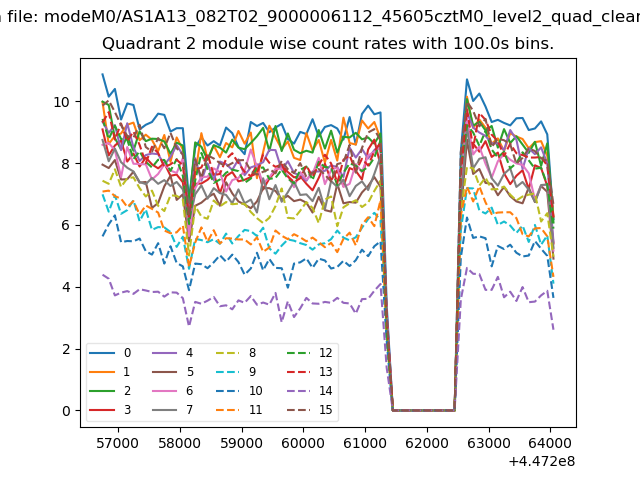
| Module-wise count rates for Quadrant D Data is divided into 100 sec bins |
 |
 |
| Parameter | Plot |
|---|---|
| CZT HV Monitor | 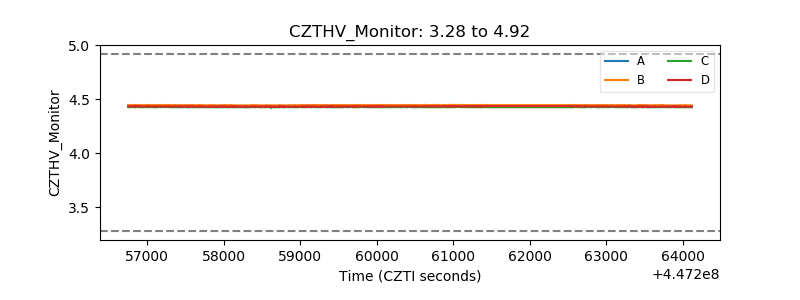 |
| D_VDD | 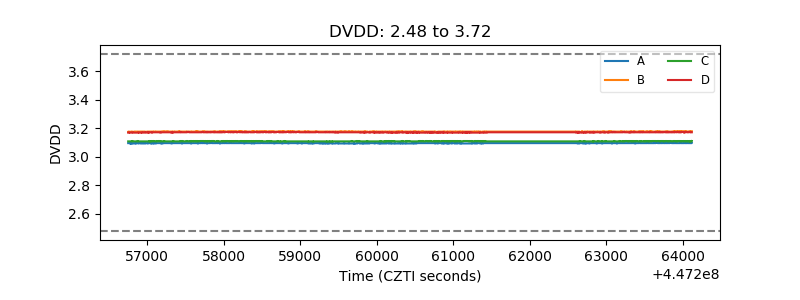 |
| Temperature 1 | 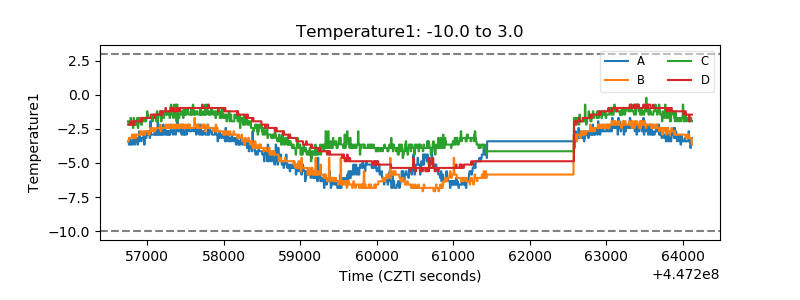 |
| Veto HV Monitor | 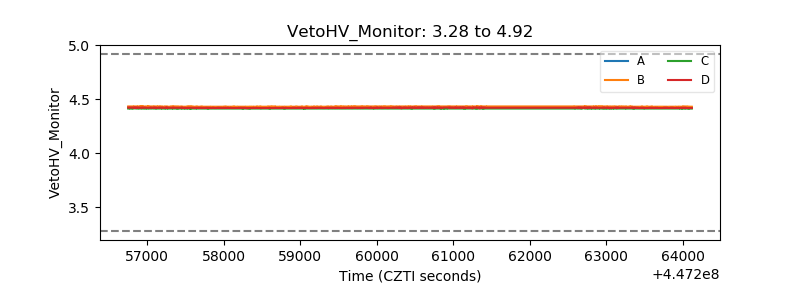 |
| Veto LLD | 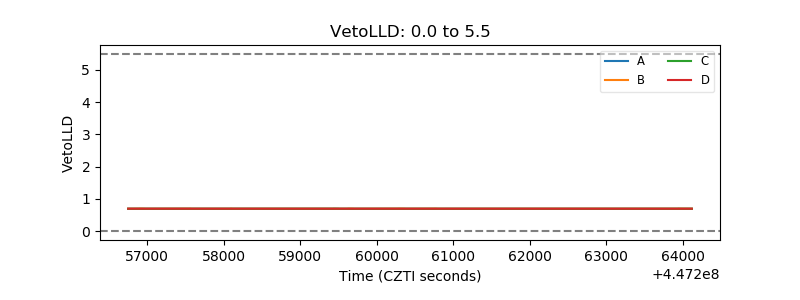 |
| Alpha Counter | 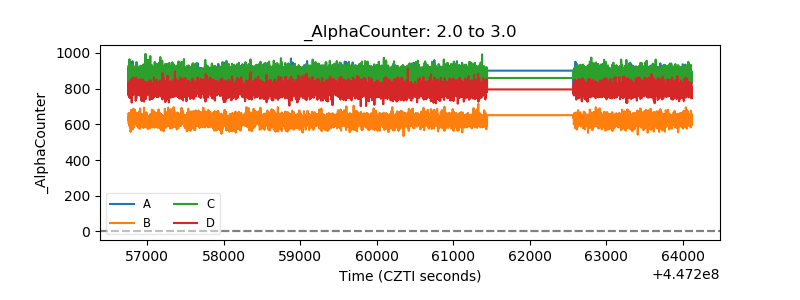 |
| _CPM_Rate | 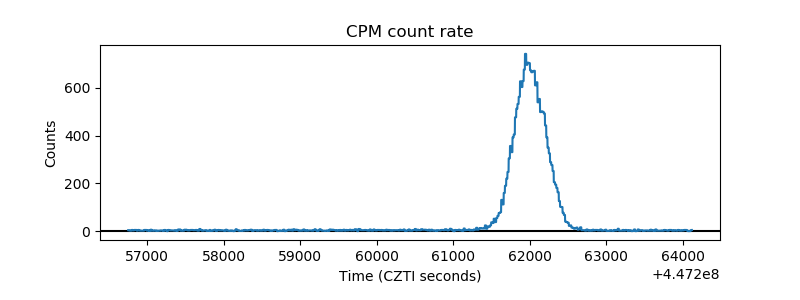 |
| CZT Counter | 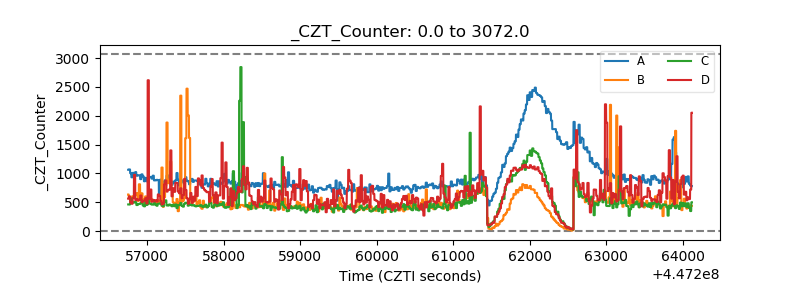 |
| +2.5 Volts monitor | 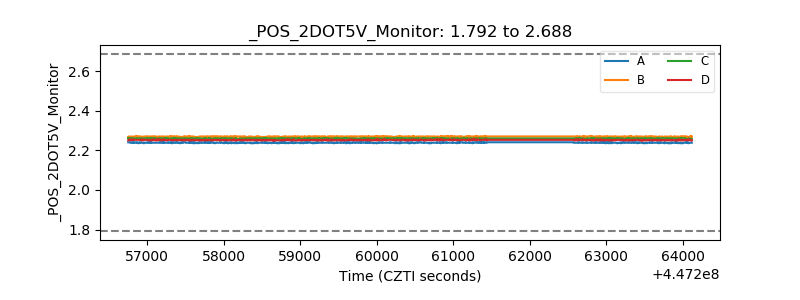 |
| +5 Volts monitor |  |
| _ROLL_ROT | 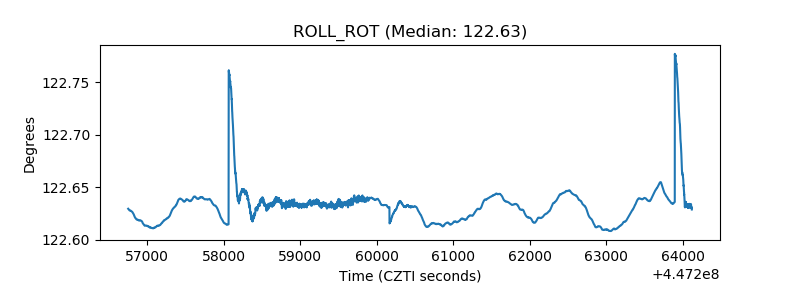 |
| _Roll_DEC | 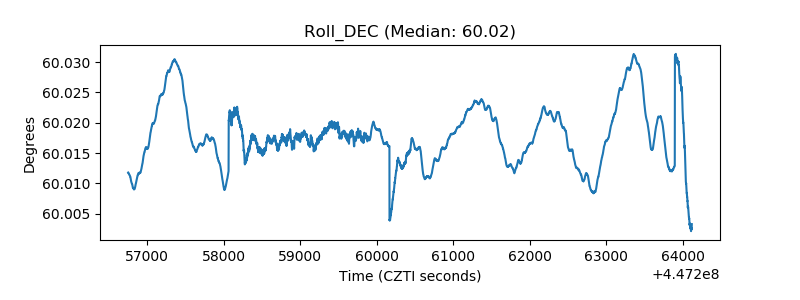 |
| _Roll_RA | 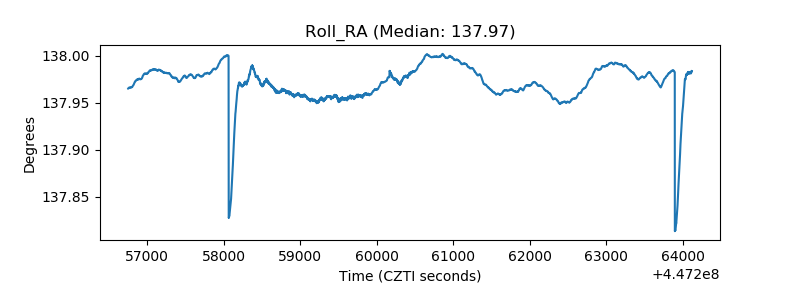 |
| Veto Counter | 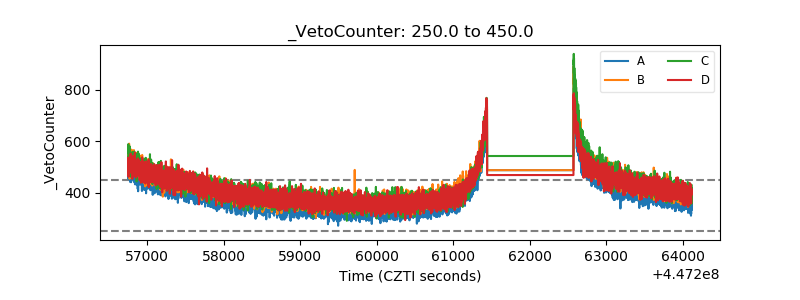 |