| Param | Original file | Final file |
|---|---|---|
| Filename | modeM0/AS1A13_082T02_9000006112_45606cztM0_level2.fits | modeM0/AS1A13_082T02_9000006112_45606cztM0_level2_quad_clean.evt |
| Size (bytes) | 441,976,320 | 106,850,880 |
| Size | 421.5 MB | 101.9 MB |
| Events in quadrant A | 5,400,892 | 708,086 |
| Events in quadrant B | 3,273,687 | 739,879 |
| Events in quadrant C | 2,887,994 | 709,461 |
| Events in quadrant D | 4,309,400 | 639,335 |
| Mode M0 | |||
|---|---|---|---|
| Quadrant | BADHDUFLAG | Total packets | Discarded packets |
| A | 0 | 20366 | 1 |
| B | 0 | 14056 | 1 |
| C | 0 | 13148 | 1 |
| D | 0 | 17084 | 1 |
| Mode M9 | |||
|---|---|---|---|
| Quadrant | BADHDUFLAG | Total packets | Discarded packets |
| A | 0 | 11 | 0 |
| B | 0 | 11 | 0 |
| C | 0 | 11 | 0 |
| D | 0 | 11 | 0 |
| Mode SS | |||
|---|---|---|---|
| Quadrant | BADHDUFLAG | Total packets | Discarded packets |
| A | 0 | 126 | 0 |
| B | 0 | 126 | 0 |
| C | 0 | 126 | 0 |
| D | 0 | 126 | 0 |
| Quadrant | Total seconds | Saturated seconds | Saturation percentage |
|---|---|---|---|
| A | 6291 | 189 | 3.004292% |
| B | 6292 | 142 | 2.256834% |
| C | 6292 | 57 | 0.905912% |
| D | 6292 | 171 | 2.717737% |
Noise dominated data is calculated using 1-second bins in cleaned event files. If a bin has >2000 counts, and if more than 50% of those come from <1% of pixels, then it is considered to be noise-dominated and hence unusable.
| Quadrant | # 1 sec bins | Bins with >0 counts | Bins with >2000 counts | High rate bins dominated by noise | Noise dominated (total time) | Noise dominated (detector-on time) | Marked lightcurve |
|---|---|---|---|---|---|---|---|
| A | 7366 | 6292 | 15 | 15 | 0.20% | 0.24% | 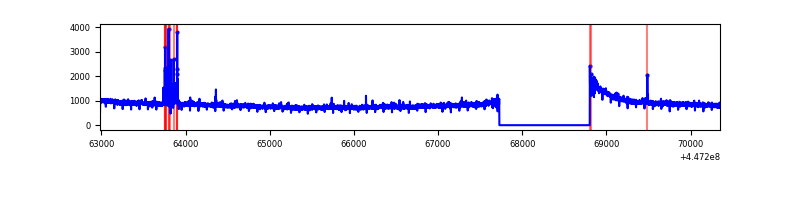 |
| B | 7367 | 6293 | 67 | 67 | 0.91% | 1.06% | 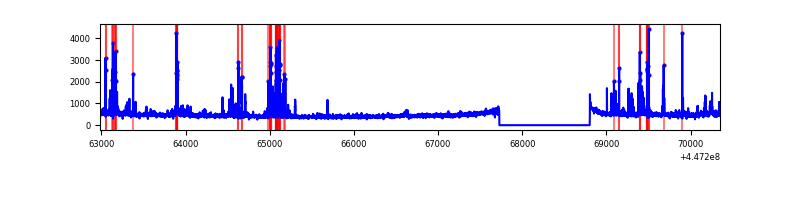 |
| C | 7367 | 6293 | 14 | 14 | 0.19% | 0.22% | 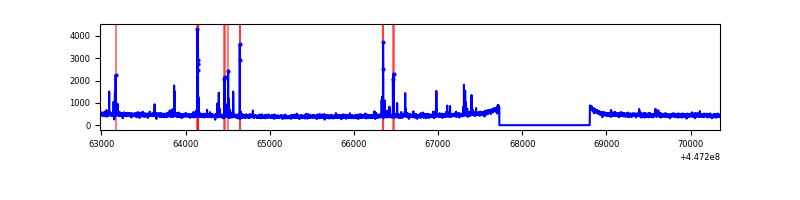 |
| D | 7367 | 6293 | 107 | 107 | 1.45% | 1.70% | 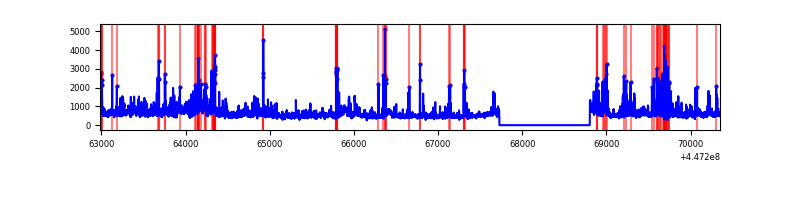 |
Top three noisy pixels from each quadrant. If the there are fewer than three noisy pixels in the level2.evt file, extra rows are filled as -1
| Pixel properties | Quadrant properties | ||||||
|---|---|---|---|---|---|---|---|
| Quadrant | DetID | PixID | Counts | Sigma | Mean | Median | Sigma |
| A | 10 | 83 | 2586089 | 17736.12 | 704 | 688 | 145.8 |
| A | 10 | 248 | 62111 | 421.37 | 704 | 688 | 145.8 |
| A | 0 | 243 | 19431 | 128.58 | 704 | 688 | 145.8 |
| B | 5 | 172 | 227991 | 1652.42 | 706 | 685 | 137.6 |
| B | 7 | 221 | 100177 | 723.27 | 706 | 685 | 137.6 |
| B | 3 | 112 | 56746 | 407.54 | 706 | 685 | 137.6 |
| C | 14 | 254 | 122215 | 740.52 | 705 | 710 | 164.1 |
| C | 9 | 237 | 6882 | 37.62 | 705 | 710 | 164.1 |
| C | 12 | 249 | 5293 | 27.93 | 705 | 710 | 164.1 |
| D | 11 | 241 | 556666 | 3183.53 | 696 | 675 | 174.6 |
| D | 8 | 48 | 207020 | 1181.5 | 696 | 675 | 174.6 |
| D | 11 | 224 | 148812 | 848.21 | 696 | 675 | 174.6 |
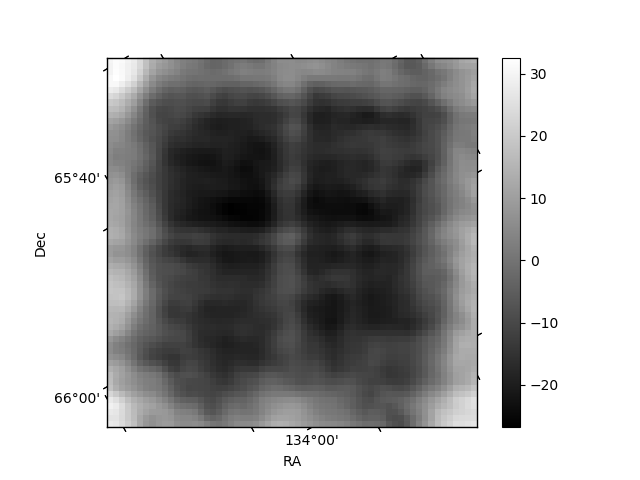
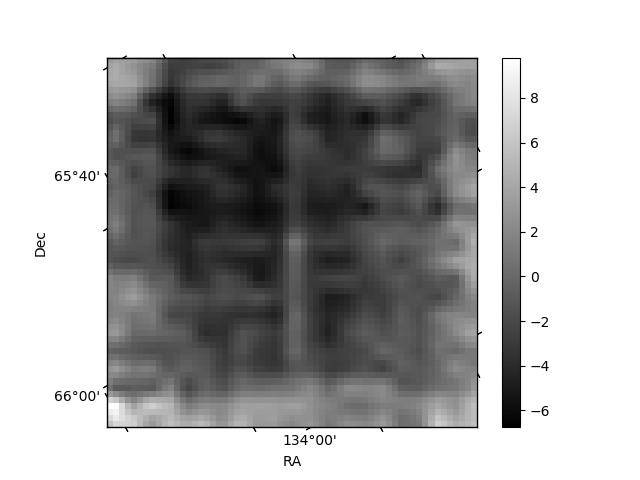
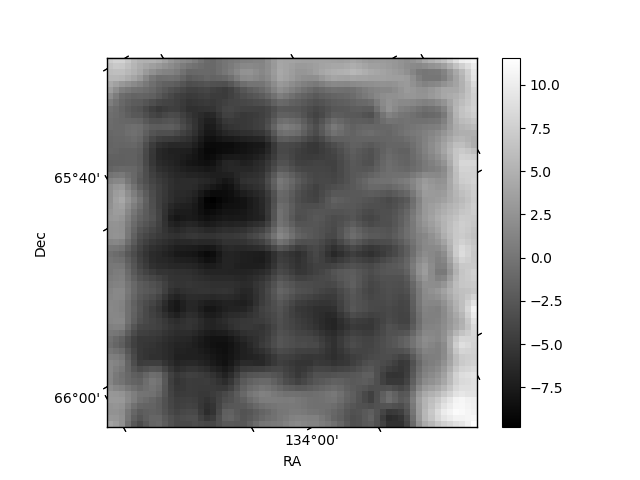
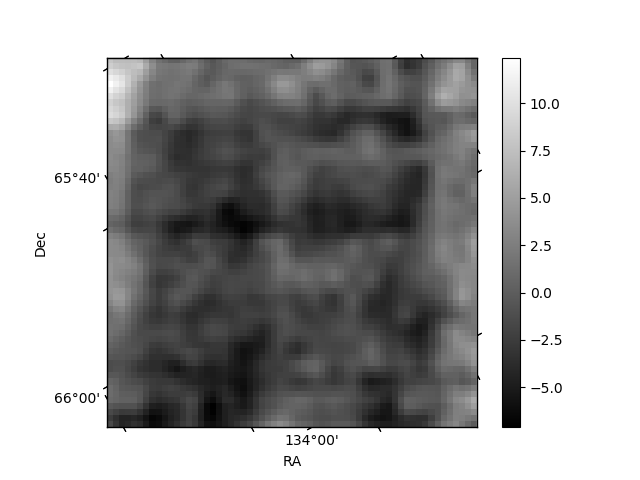
Histogram calculated using DETX and DETY for each event in the final _common_clean file
| Quadrant A | 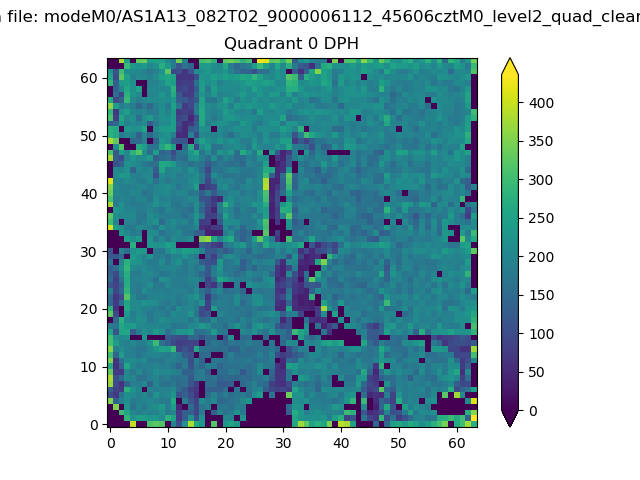 |
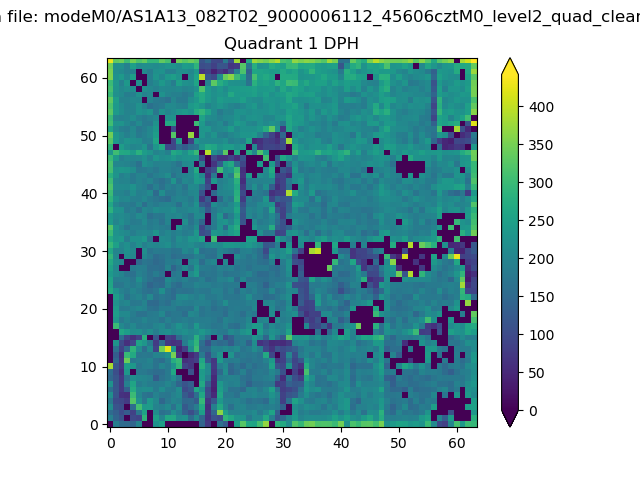 |
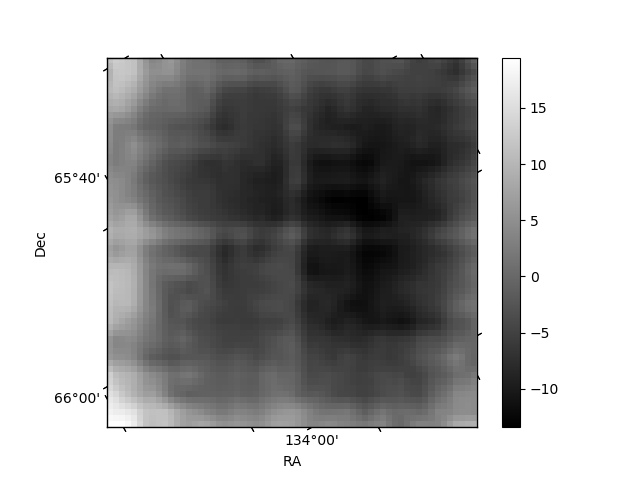
Quadrant B |
|---|---|---|---|
| Quadrant D | 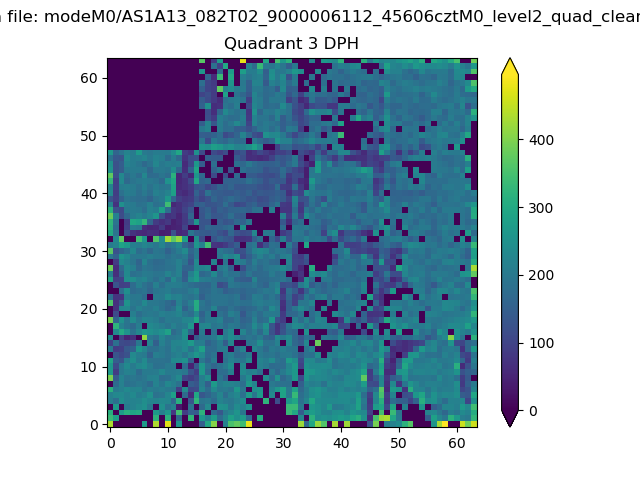 |
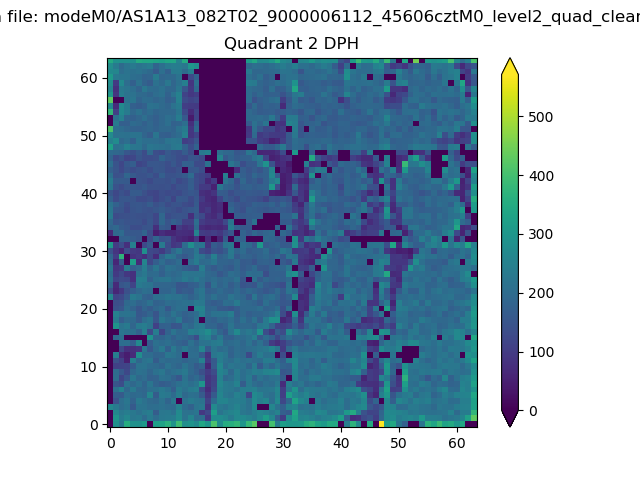 |
Quadrant C |
| Plot type | Count rate plots | Images |
|---|---|---|
| Comparison with Poisson distribution Blue bars denote a histogram of data divided into 1 sec bins. Red curve is a Poisson curve with rate = median count rate of data. |
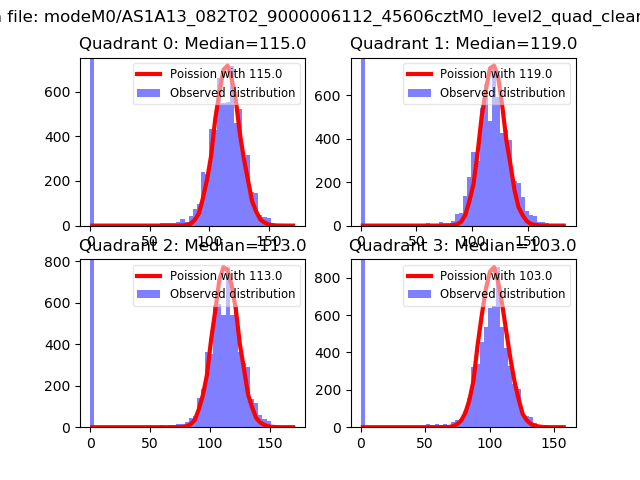 |
 |
| Quadrant-wise count rates Data is divided into 100 sec bins |
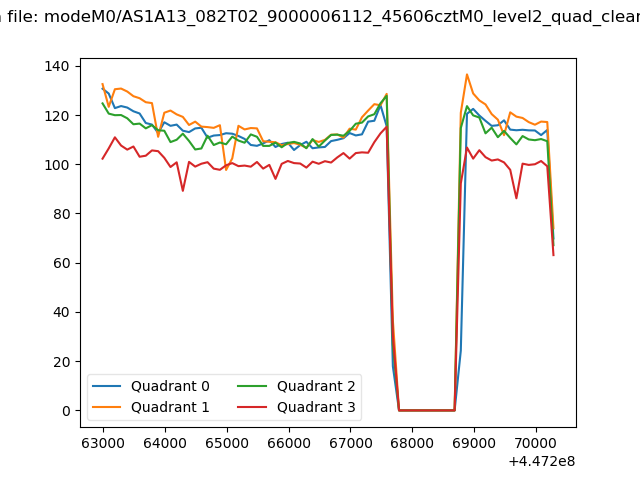 |
|
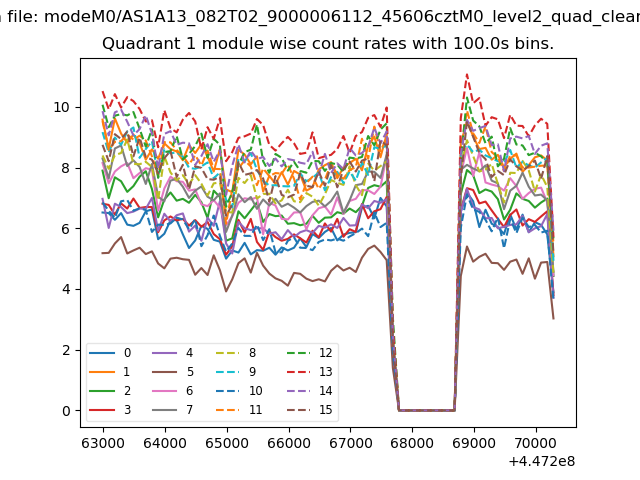
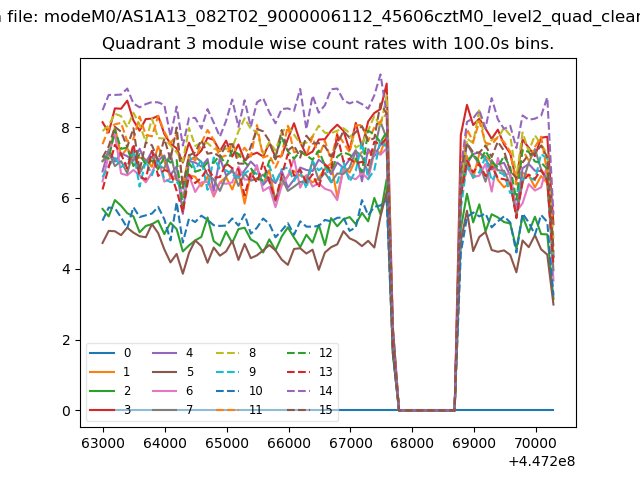
| Module-wise count rates for Quadrant A Data is divided into 100 sec bins |
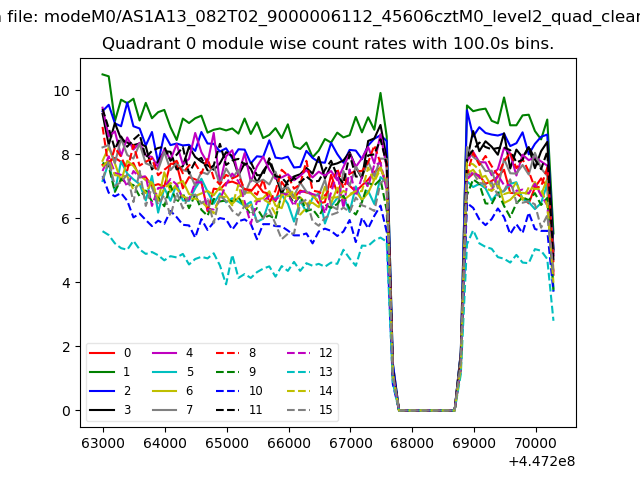 |
 |
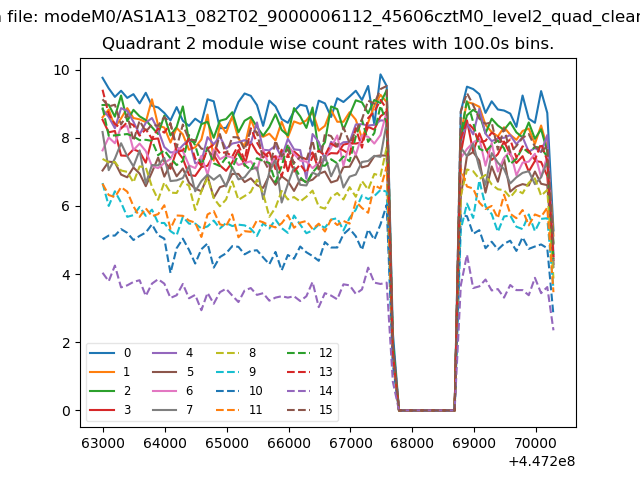
| Module-wise count rates for Quadrant B Data is divided into 100 sec bins |
 |
 |
| Module-wise count rates for Quadrant C Data is divided into 100 sec bins |
 |
 |
| Module-wise count rates for Quadrant D Data is divided into 100 sec bins |
 |
 |
| Parameter | Plot |
|---|---|
| CZT HV Monitor | 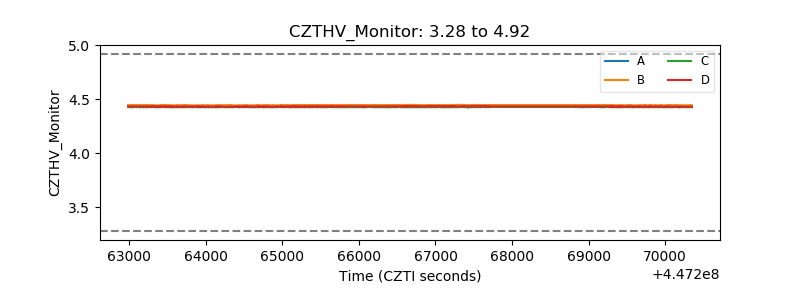 |
| D_VDD | 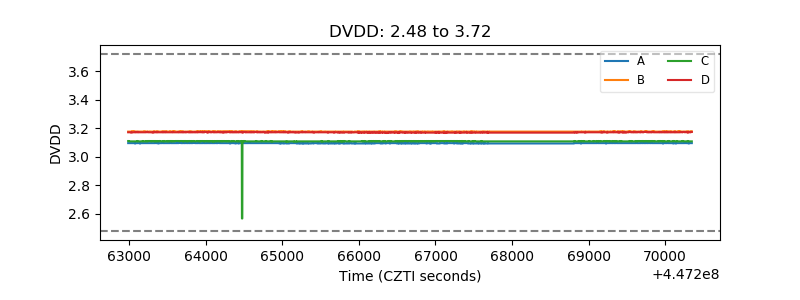 |
| Temperature 1 | 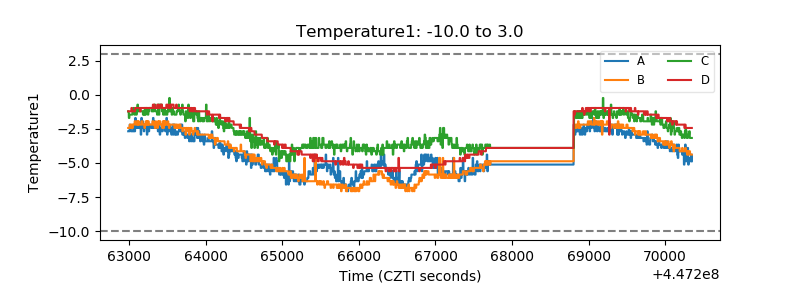 |
| Veto HV Monitor | 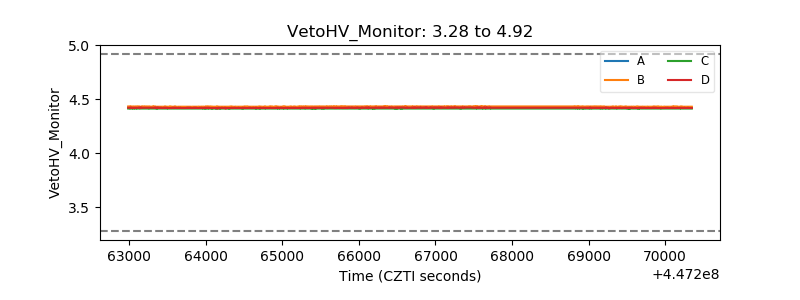 |
| Veto LLD | 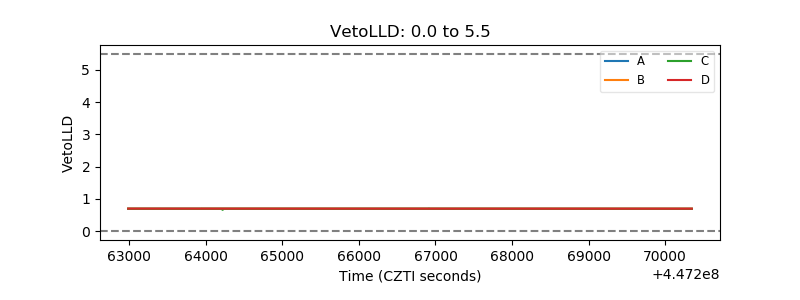 |
| Alpha Counter | 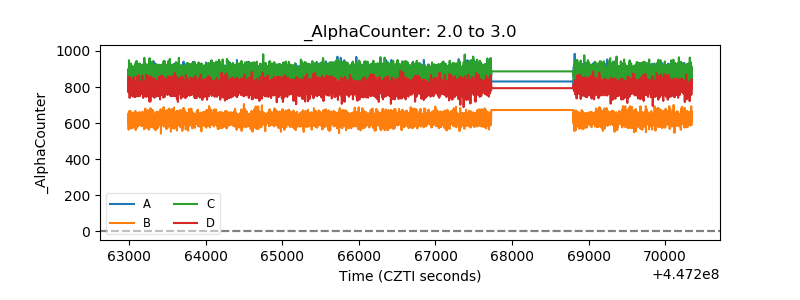 |
| _CPM_Rate | 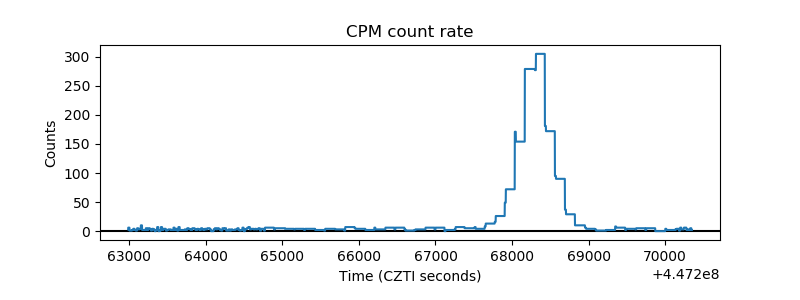 |
| CZT Counter | 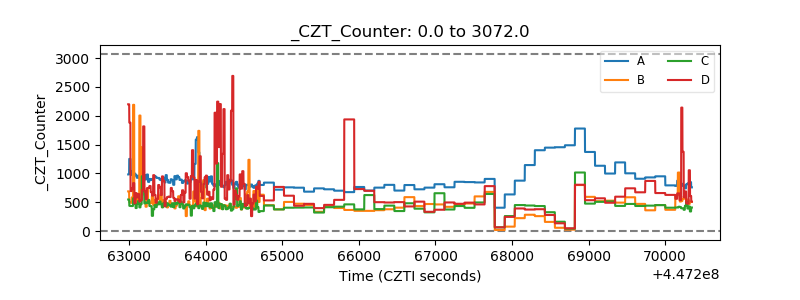 |
| +2.5 Volts monitor | 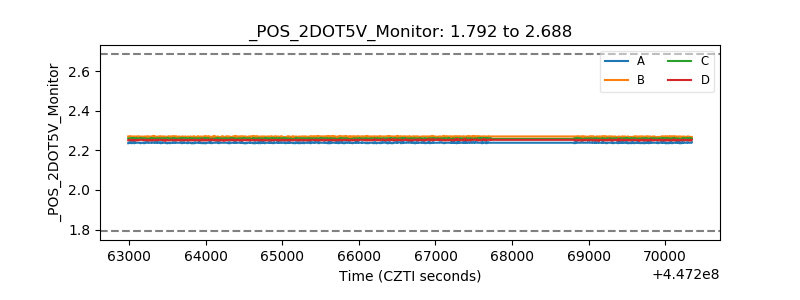 |
| +5 Volts monitor | 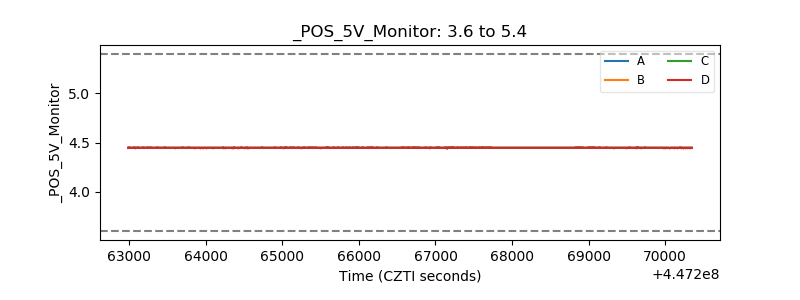 |
| _ROLL_ROT | 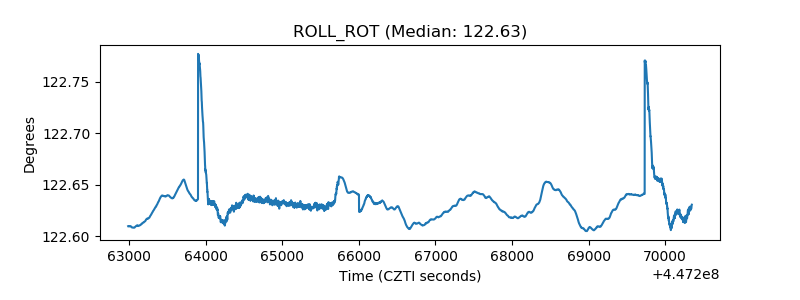 |
| _Roll_DEC | 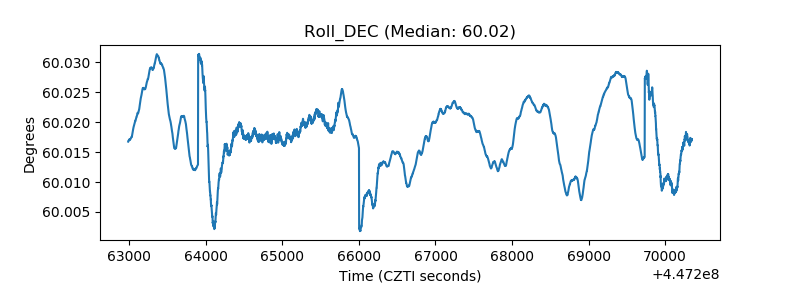 |
| _Roll_RA | 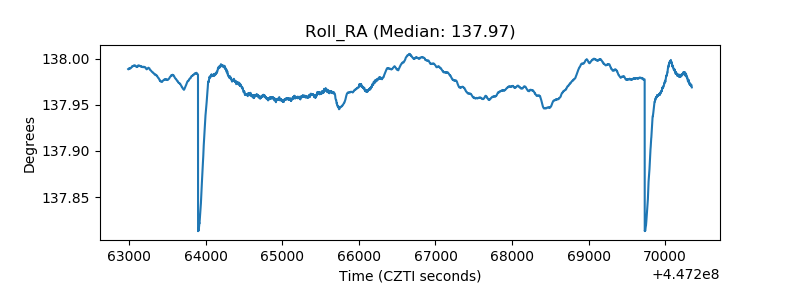 |
| Veto Counter | 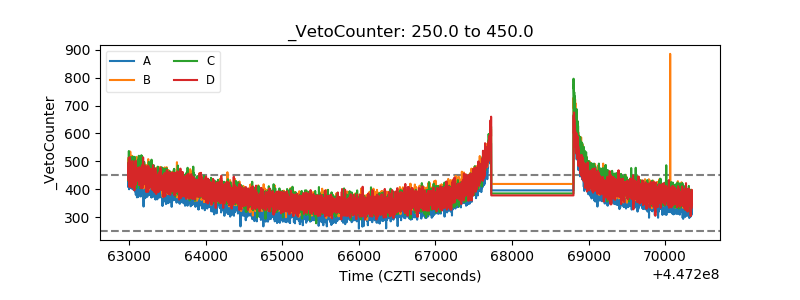 |