| Param | Original file | Final file |
|---|---|---|
| Filename | modeM0/AS1A13_082T02_9000006112_45608cztM0_level2.fits | modeM0/AS1A13_082T02_9000006112_45608cztM0_level2_quad_clean.evt |
| Size (bytes) | 192,211,200 | 41,641,920 |
| Size | 183.3 MB | 39.7 MB |
| Events in quadrant A | 2,223,443 | 273,725 |
| Events in quadrant B | 1,619,318 | 276,837 |
| Events in quadrant C | 1,495,622 | 273,711 |
| Events in quadrant D | 1,573,740 | 251,395 |
| Mode M0 | |||
|---|---|---|---|
| Quadrant | BADHDUFLAG | Total packets | Discarded packets |
| A | 0 | 8534 | 1 |
| B | 0 | 6682 | 1 |
| C | 0 | 6322 | 4 |
| D | 0 | 6345 | 1 |
| Mode M9 | |||
|---|---|---|---|
| Quadrant | BADHDUFLAG | Total packets | Discarded packets |
| A | 0 | 4 | 0 |
| B | 0 | 4 | 0 |
| C | 0 | 5 | 0 |
| D | 0 | 5 | 0 |
| Mode SS | |||
|---|---|---|---|
| Quadrant | BADHDUFLAG | Total packets | Discarded packets |
| A | 0 | 52 | 0 |
| B | 0 | 52 | 0 |
| C | 0 | 52 | 0 |
| D | 0 | 52 | 0 |
| Quadrant | Total seconds | Saturated seconds | Saturation percentage |
|---|---|---|---|
| A | 2585 | 101 | 3.907157% |
| B | 2585 | 199 | 7.698259% |
| C | 2583 | 79 | 3.058459% |
| D | 2585 | 49 | 1.895551% |
Noise dominated data is calculated using 1-second bins in cleaned event files. If a bin has >2000 counts, and if more than 50% of those come from <1% of pixels, then it is considered to be noise-dominated and hence unusable.
| Quadrant | # 1 sec bins | Bins with >0 counts | Bins with >2000 counts | High rate bins dominated by noise | Noise dominated (total time) | Noise dominated (detector-on time) | Marked lightcurve |
|---|---|---|---|---|---|---|---|
| A | 2585 | 2585 | 1 | 1 | 0.04% | 0.04% | 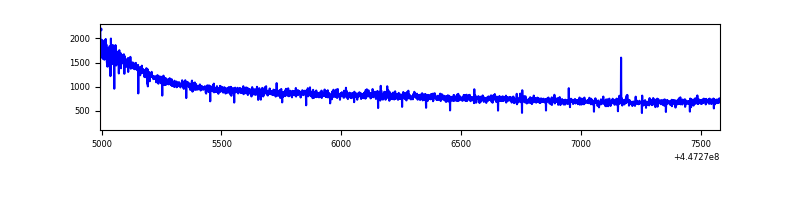 |
| B | 2585 | 2585 | 120 | 120 | 4.64% | 4.64% | 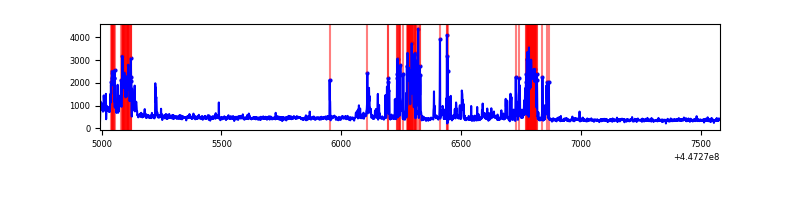 |
| C | 2585 | 2584 | 77 | 77 | 2.98% | 2.98% | 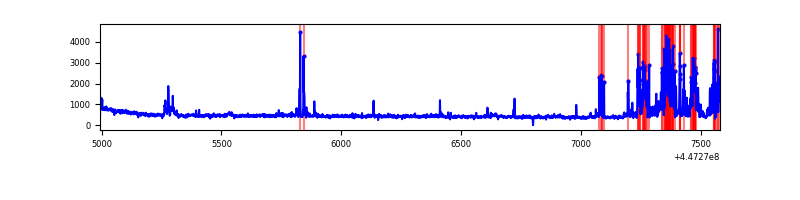 |
| D | 2585 | 2585 | 27 | 27 | 1.04% | 1.04% | 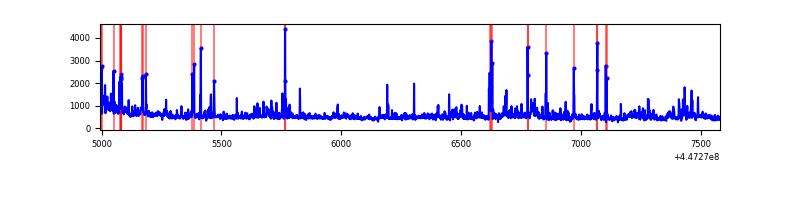 |
Top three noisy pixels from each quadrant. If the there are fewer than three noisy pixels in the level2.evt file, extra rows are filled as -1
| Pixel properties | Quadrant properties | ||||||
|---|---|---|---|---|---|---|---|
| Quadrant | DetID | PixID | Counts | Sigma | Mean | Median | Sigma |
| A | 10 | 83 | 1156483 | 19718.09 | 274 | 266 | 58.6 |
| A | 0 | 243 | 4699 | 75.6 | 274 | 266 | 58.6 |
| A | 14 | 235 | 3688 | 58.36 | 274 | 266 | 58.6 |
| B | 5 | 172 | 182886 | 3328.08 | 271 | 263 | 54.9 |
| B | 7 | 221 | 167443 | 3046.65 | 271 | 263 | 54.9 |
| B | 15 | 201 | 87721 | 1593.82 | 271 | 263 | 54.9 |
| C | 12 | 2 | 360658 | 5396.75 | 278 | 279 | 66.8 |
| C | 14 | 254 | 42627 | 634.17 | 278 | 279 | 66.8 |
| C | 0 | 207 | 3024 | 41.11 | 278 | 279 | 66.8 |
| D | 11 | 241 | 171890 | 2428.31 | 278 | 269 | 70.7 |
| D | 11 | 224 | 70481 | 993.44 | 278 | 269 | 70.7 |
| D | 3 | 13 | 57490 | 809.63 | 278 | 269 | 70.7 |
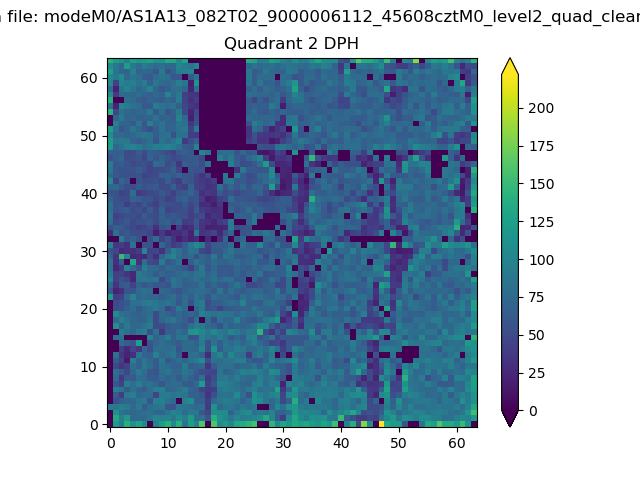
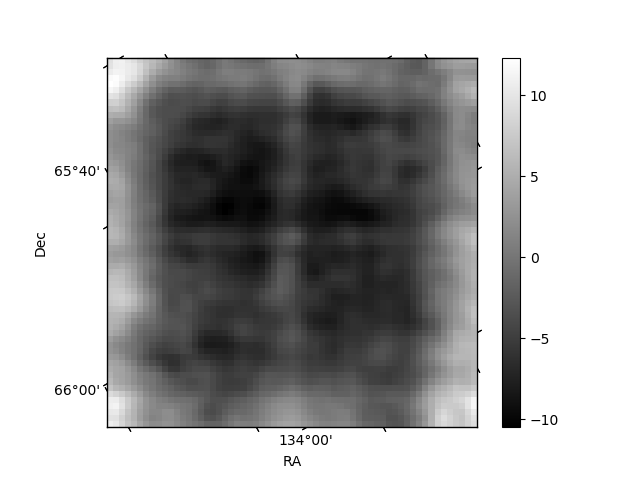
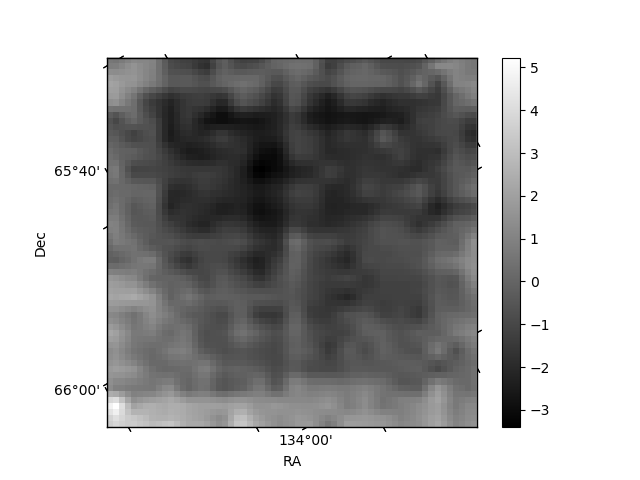
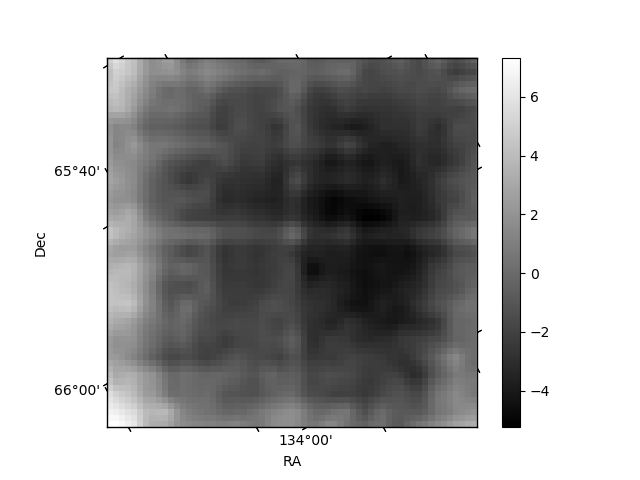
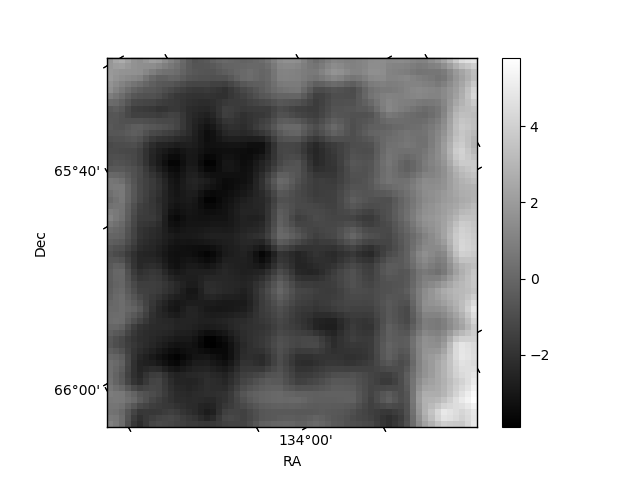
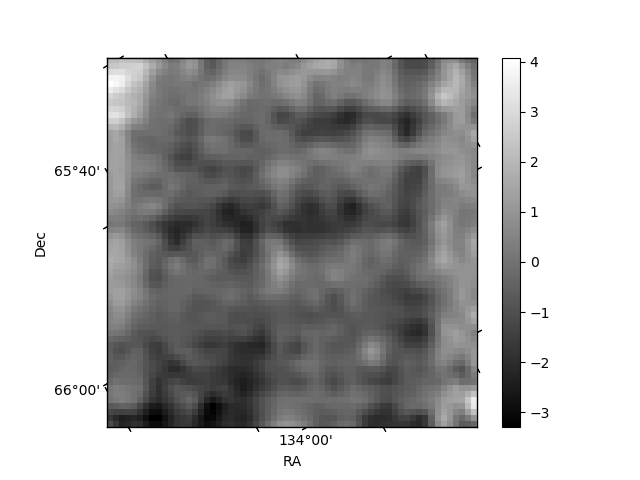
Histogram calculated using DETX and DETY for each event in the final _common_clean file
| Quadrant A | 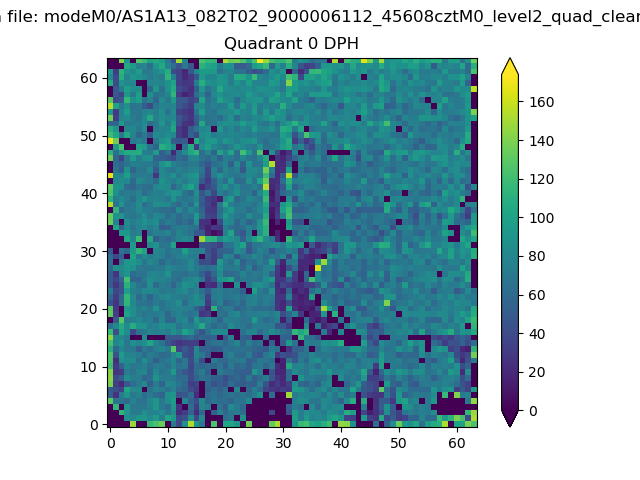 |
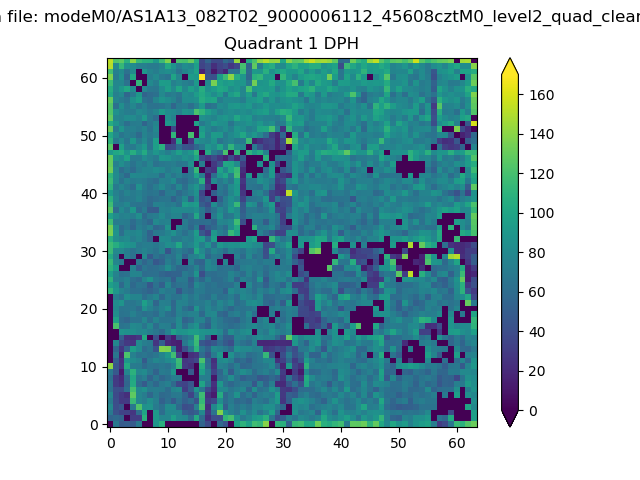 |
Quadrant B |
|---|---|---|---|
| Quadrant D | 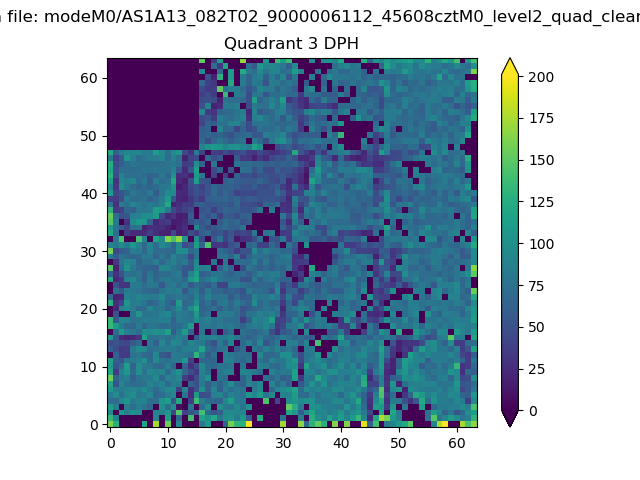 |
 |
Quadrant C |
| Plot type | Count rate plots | Images |
|---|---|---|
| Comparison with Poisson distribution Blue bars denote a histogram of data divided into 1 sec bins. Red curve is a Poisson curve with rate = median count rate of data. |
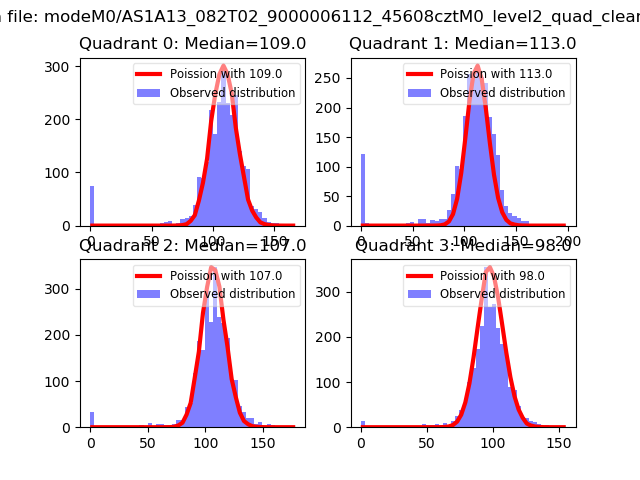 |
 |
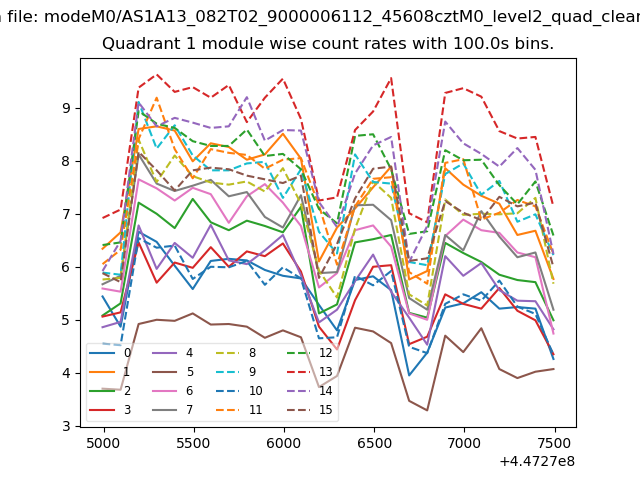
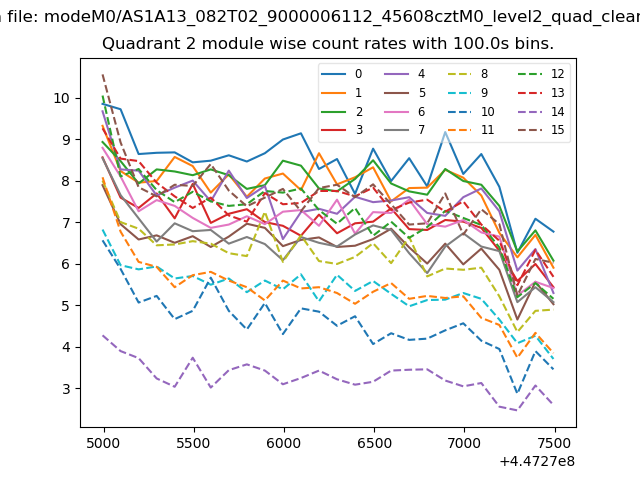
| Quadrant-wise count rates Data is divided into 100 sec bins |
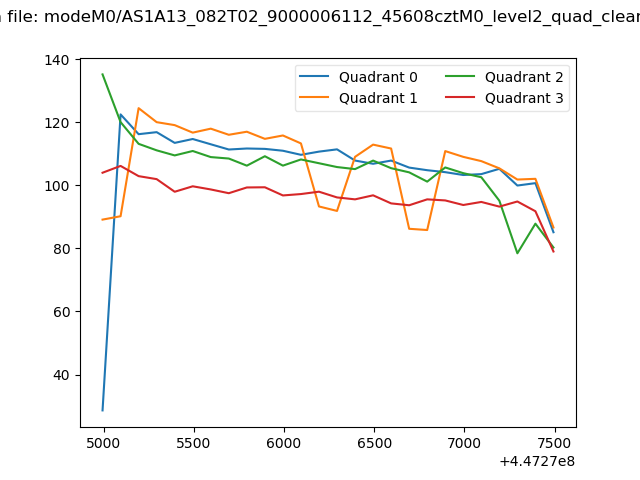 |
|
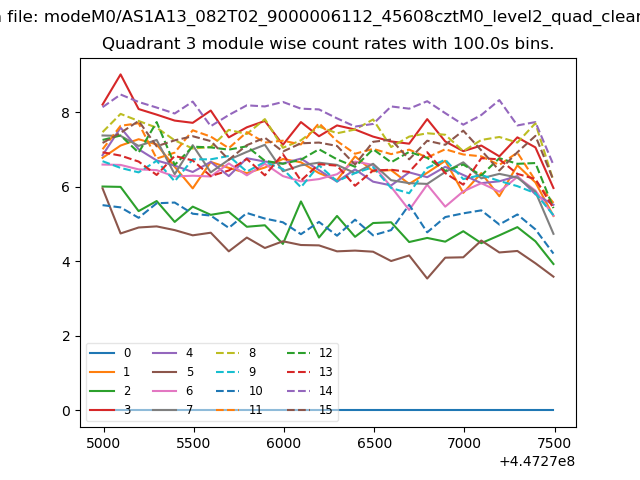
| Module-wise count rates for Quadrant A Data is divided into 100 sec bins |
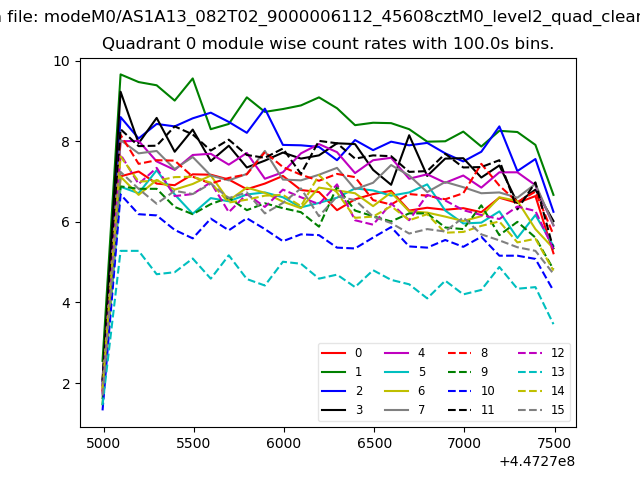 |
 |
| Module-wise count rates for Quadrant B Data is divided into 100 sec bins |
 |
 |
| Module-wise count rates for Quadrant C Data is divided into 100 sec bins |
 |
 |
| Module-wise count rates for Quadrant D Data is divided into 100 sec bins |
 |
 |
| Parameter | Plot |
|---|---|
| CZT HV Monitor | 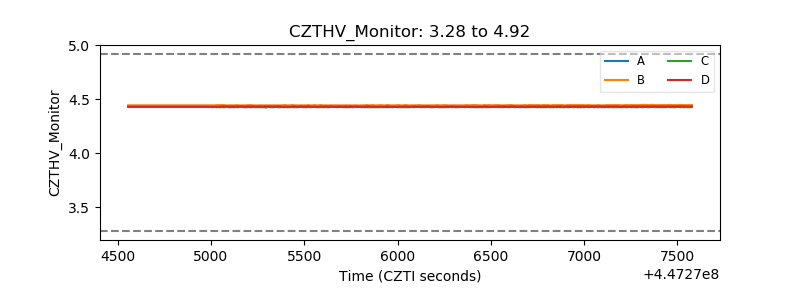 |
| D_VDD | 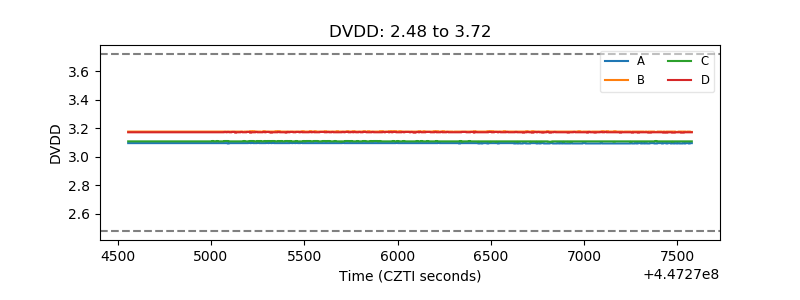 |
| Temperature 1 | 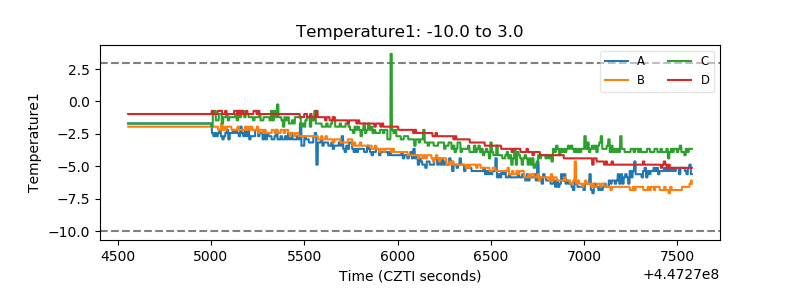 |
| Veto HV Monitor | 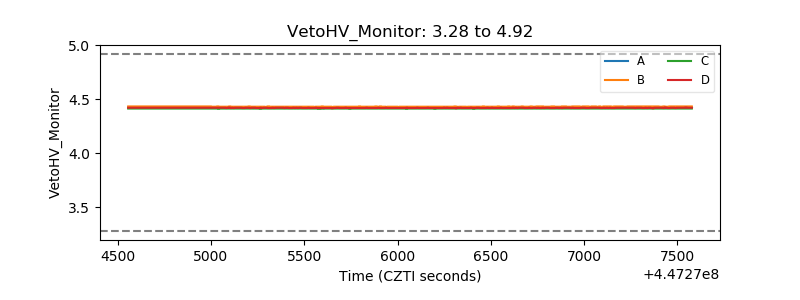 |
| Veto LLD | 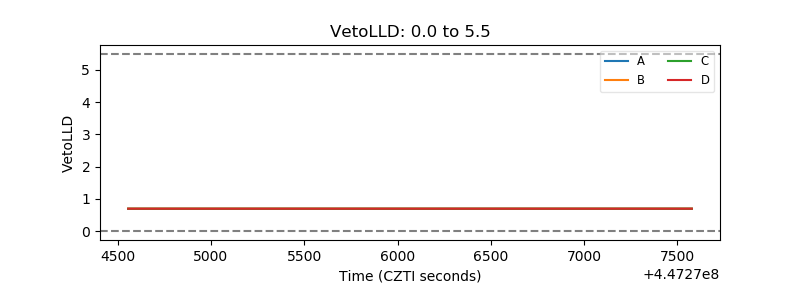 |
| Alpha Counter | 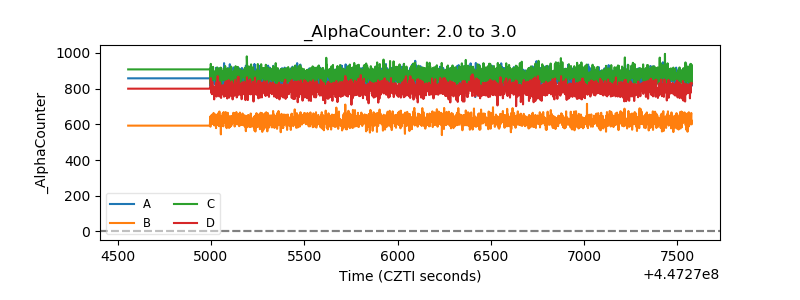 |
| _CPM_Rate | 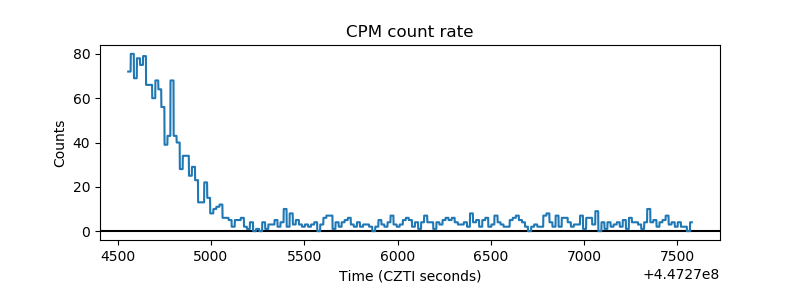 |
| CZT Counter | 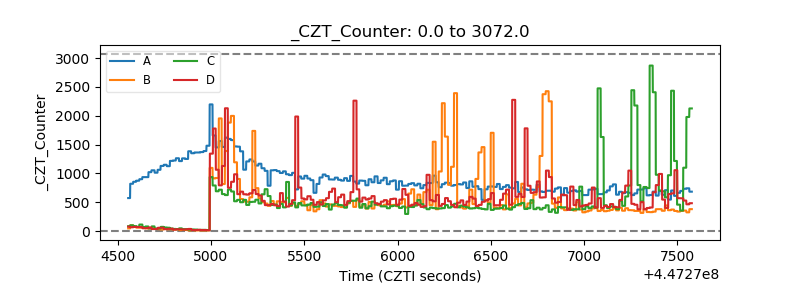 |
| +2.5 Volts monitor | 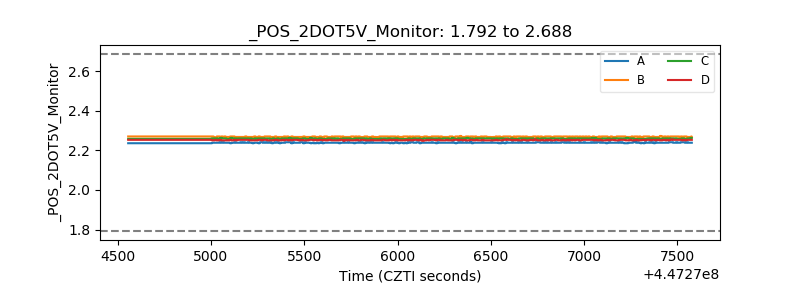 |
| +5 Volts monitor | 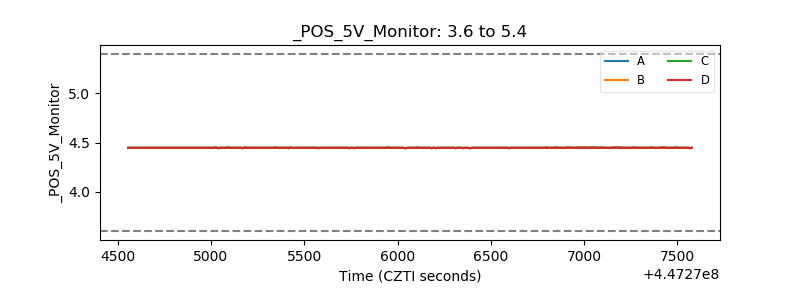 |
| _ROLL_ROT | 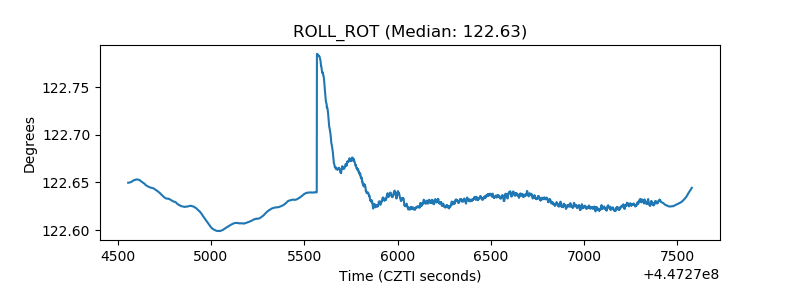 |
| _Roll_DEC | 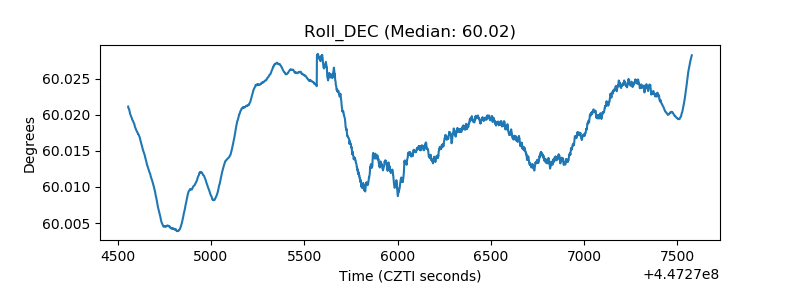 |
| _Roll_RA | 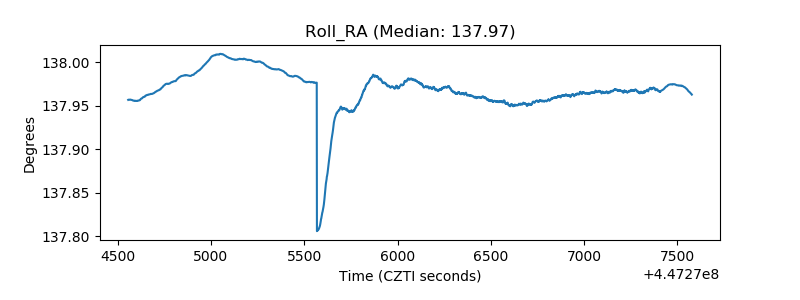 |
| Veto Counter | 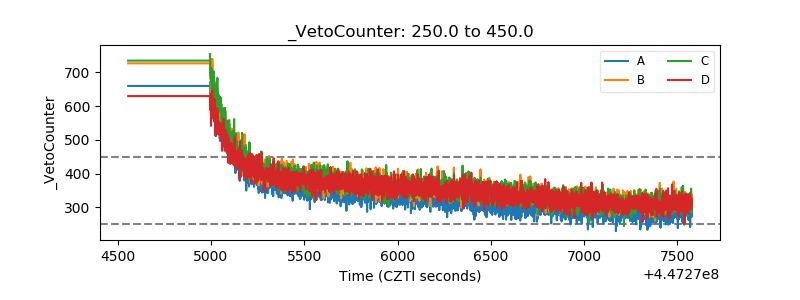 |