| Param | Original file | Final file |
|---|---|---|
| Filename | modeM0/AS1A13_071T08_9000006114_45608cztM0_level2.fits | modeM0/AS1A13_071T08_9000006114_45608cztM0_level2_quad_clean.evt |
| Size (bytes) | 312,079,680 | 55,595,520 |
| Size | 297.6 MB | 53.0 MB |
| Events in quadrant A | 3,229,450 | 364,853 |
| Events in quadrant B | 2,651,491 | 352,886 |
| Events in quadrant C | 1,948,475 | 383,631 |
| Events in quadrant D | 3,445,604 | 330,639 |
| Mode M9 | |||
|---|---|---|---|
| Quadrant | BADHDUFLAG | Total packets | Discarded packets |
| A | 0 | 2 | 0 |
| B | 0 | 2 | 0 |
| C | 0 | 2 | 0 |
| D | 0 | 2 | 0 |
| Mode M0 | |||
|---|---|---|---|
| Quadrant | BADHDUFLAG | Total packets | Discarded packets |
| A | 0 | 11867 | 1 |
| B | 0 | 10239 | 1 |
| C | 0 | 8307 | 1 |
| D | 0 | 12706 | 1 |
| Mode SS | |||
|---|---|---|---|
| Quadrant | BADHDUFLAG | Total packets | Discarded packets |
| A | 0 | 72 | 0 |
| B | 0 | 72 | 0 |
| C | 0 | 72 | 0 |
| D | 0 | 72 | 0 |
| Quadrant | Total seconds | Saturated seconds | Saturation percentage |
|---|---|---|---|
| A | 3553 | 327 | 9.203490% |
| B | 3553 | 523 | 14.719955% |
| C | 3553 | 133 | 3.743316% |
| D | 3553 | 340 | 9.569378% |
Noise dominated data is calculated using 1-second bins in cleaned event files. If a bin has >2000 counts, and if more than 50% of those come from <1% of pixels, then it is considered to be noise-dominated and hence unusable.
| Quadrant | # 1 sec bins | Bins with >0 counts | Bins with >2000 counts | High rate bins dominated by noise | Noise dominated (total time) | Noise dominated (detector-on time) | Marked lightcurve |
|---|---|---|---|---|---|---|---|
| A | 3748 | 3554 | 20 | 20 | 0.53% | 0.56% | 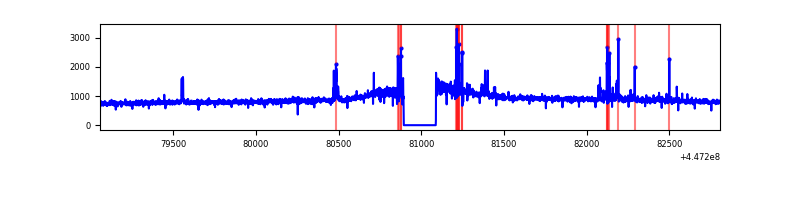 |
| B | 3748 | 3554 | 135 | 135 | 3.60% | 3.80% | 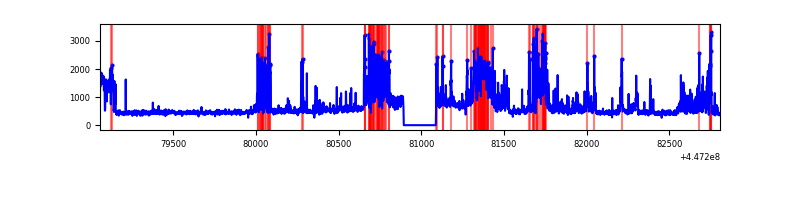 |
| C | 3748 | 3554 | 54 | 54 | 1.44% | 1.52% | 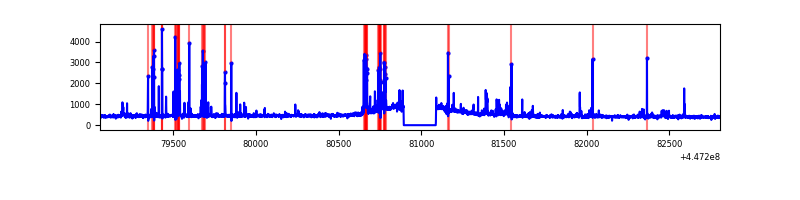 |
| D | 3748 | 3554 | 145 | 145 | 3.87% | 4.08% | 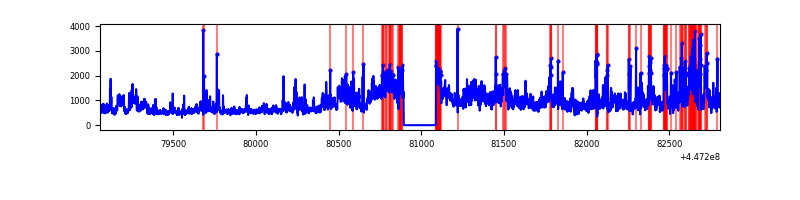 |
Top three noisy pixels from each quadrant. If the there are fewer than three noisy pixels in the level2.evt file, extra rows are filled as -1
| Pixel properties | Quadrant properties | ||||||
|---|---|---|---|---|---|---|---|
| Quadrant | DetID | PixID | Counts | Sigma | Mean | Median | Sigma |
| A | 10 | 83 | 1433100 | 15509.6 | 432 | 422 | 92.4 |
| A | 10 | 248 | 89256 | 961.68 | 432 | 422 | 92.4 |
| A | 15 | 174 | 15014 | 157.97 | 432 | 422 | 92.4 |
| B | 12 | 18 | 450465 | 5427.83 | 409 | 396 | 82.9 |
| B | 15 | 201 | 299115 | 3602.55 | 409 | 396 | 82.9 |
| B | 5 | 172 | 200669 | 2415.29 | 409 | 396 | 82.9 |
| C | 14 | 254 | 152540 | 1522.86 | 421 | 423 | 99.9 |
| C | 12 | 2 | 123696 | 1234.1 | 421 | 423 | 99.9 |
| C | 2 | 14 | 15976 | 155.7 | 421 | 423 | 99.9 |
| D | 11 | 241 | 912975 | 8555.44 | 415 | 399 | 106.7 |
| D | 8 | 48 | 427965 | 4008.45 | 415 | 399 | 106.7 |
| D | 12 | 233 | 150885 | 1410.81 | 415 | 399 | 106.7 |
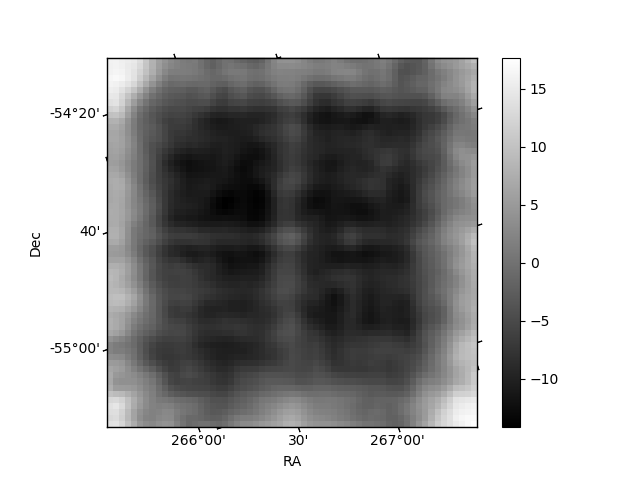
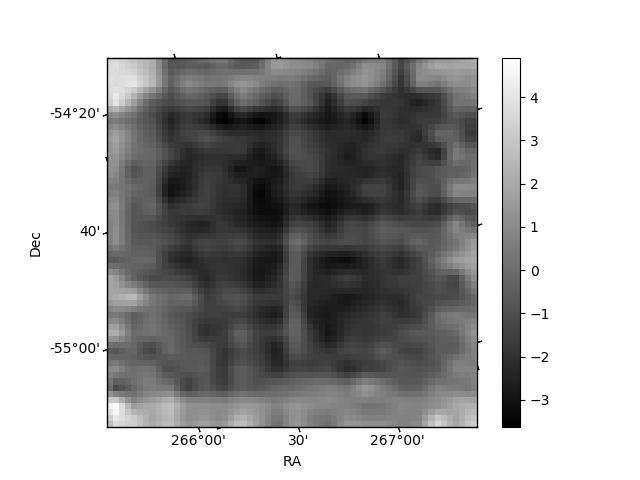
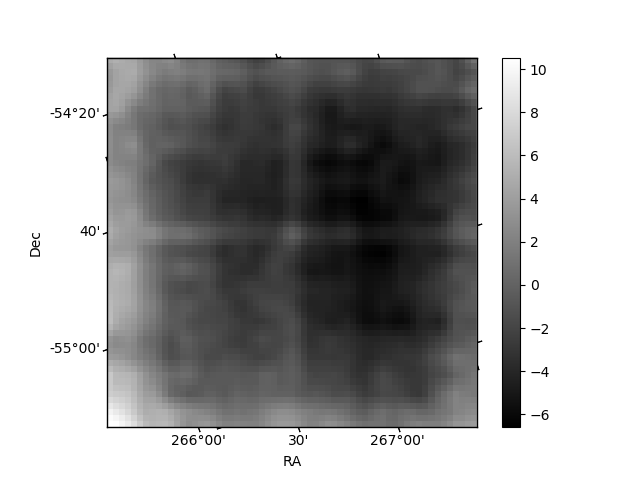
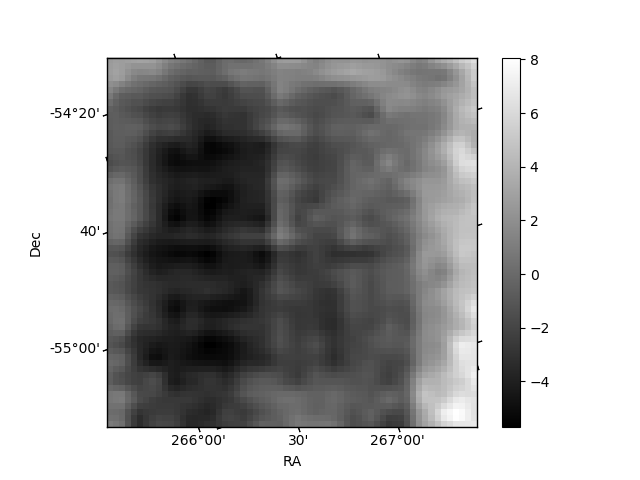
Histogram calculated using DETX and DETY for each event in the final _common_clean file
| Quadrant A | 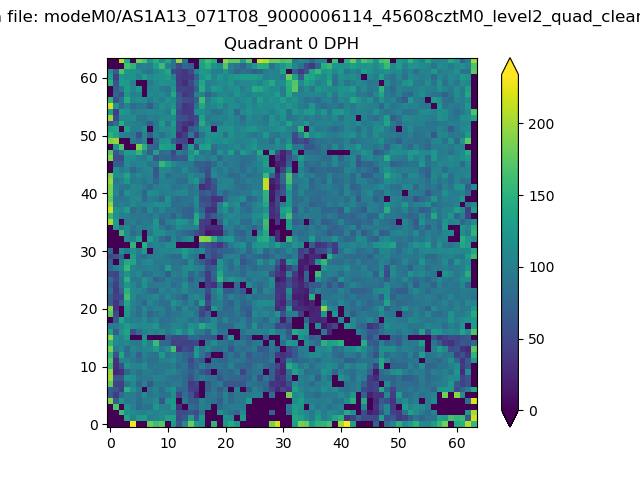 |
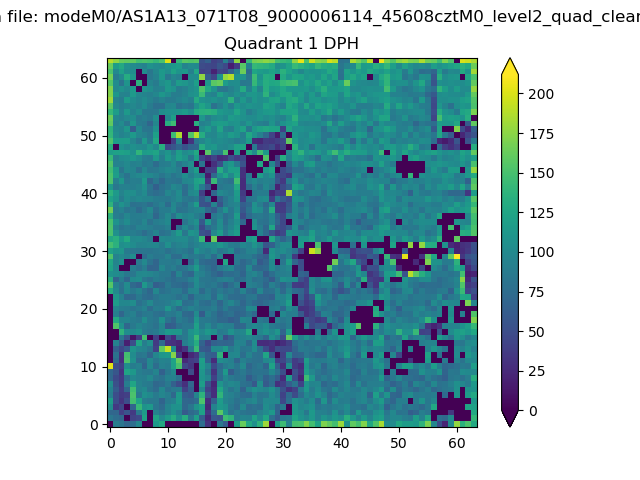 |
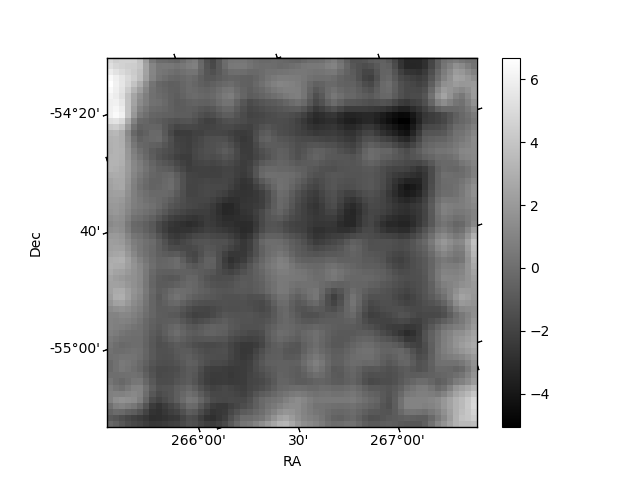
Quadrant B |
|---|---|---|---|
| Quadrant D | 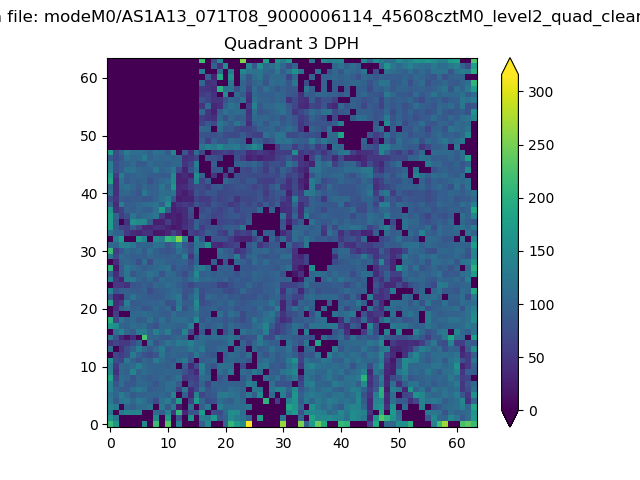 |
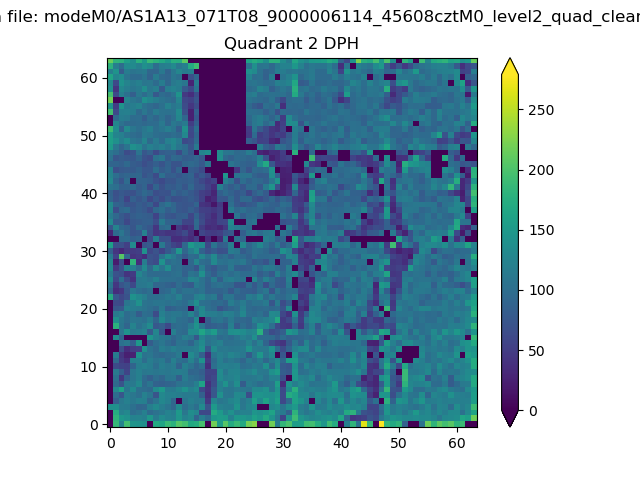 |
Quadrant C |
| Plot type | Count rate plots | Images |
|---|---|---|
| Comparison with Poisson distribution Blue bars denote a histogram of data divided into 1 sec bins. Red curve is a Poisson curve with rate = median count rate of data. |
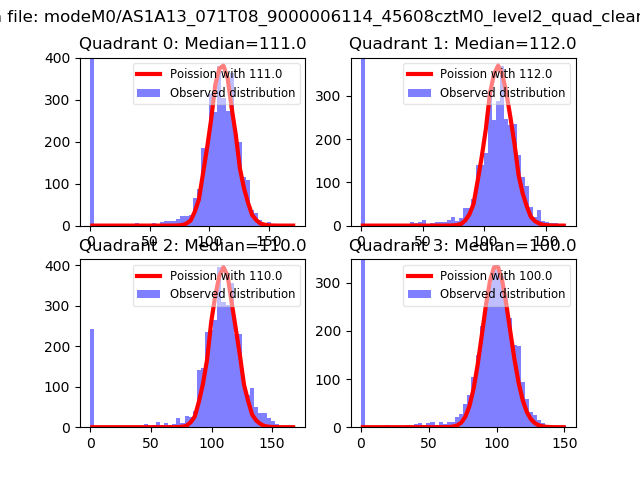 |
 |
| Quadrant-wise count rates Data is divided into 100 sec bins |
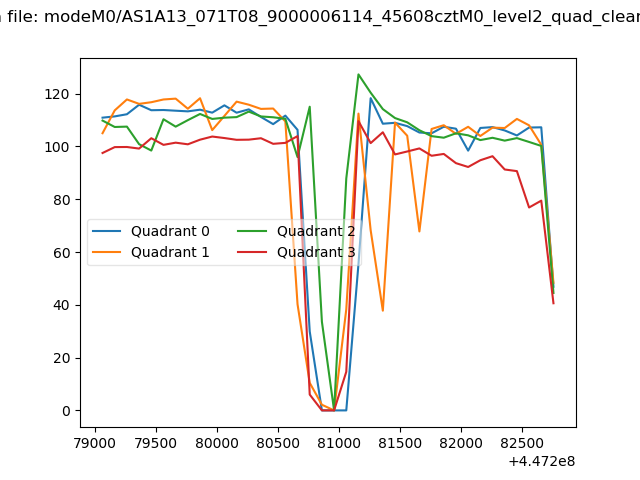 |
|
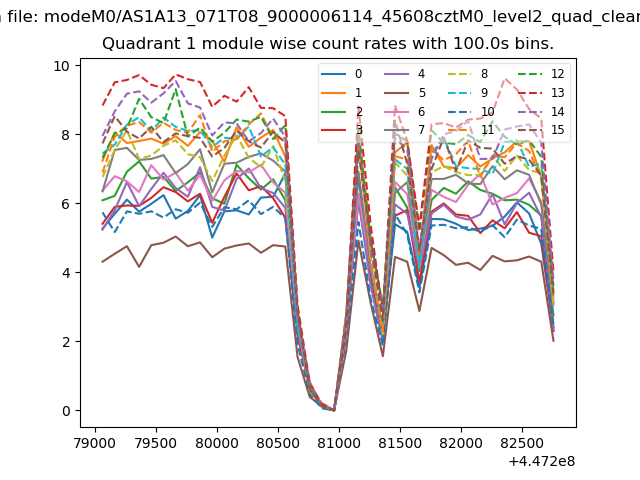
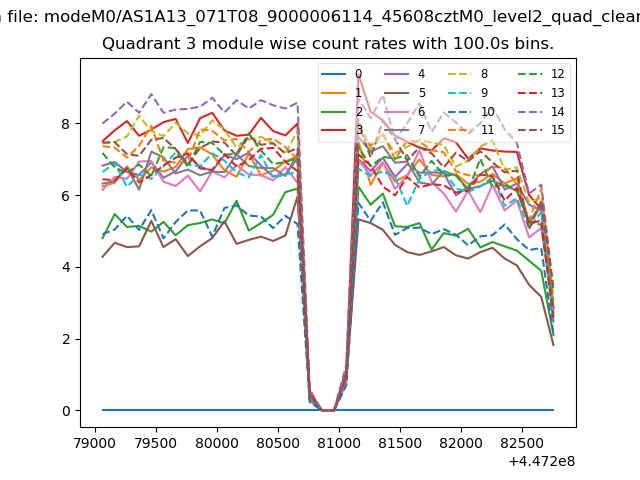
| Module-wise count rates for Quadrant A Data is divided into 100 sec bins |
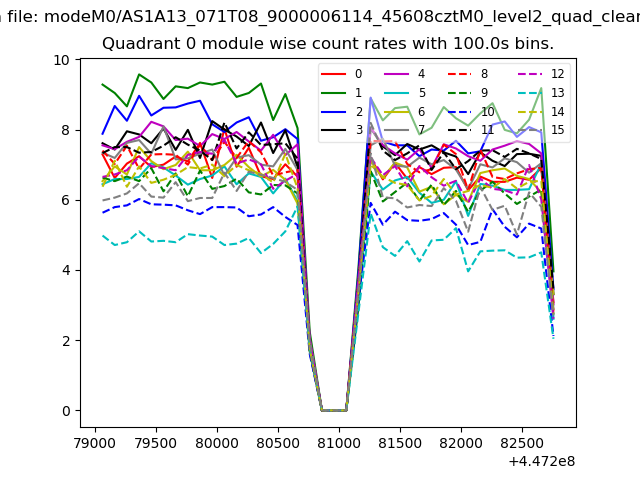 |
 |
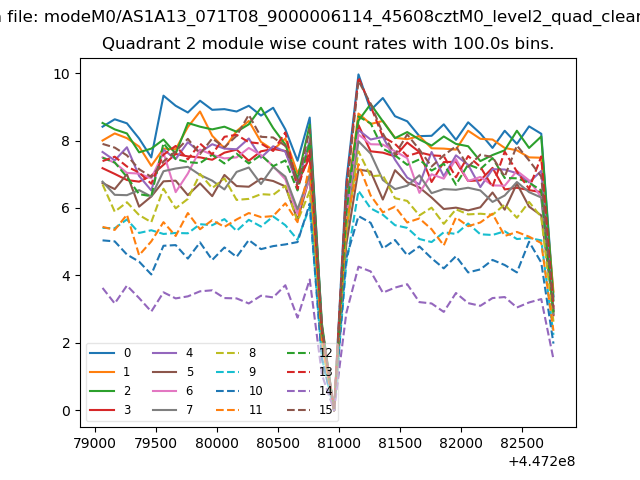
| Module-wise count rates for Quadrant B Data is divided into 100 sec bins |
 |
 |
| Module-wise count rates for Quadrant C Data is divided into 100 sec bins |
 |
 |
| Module-wise count rates for Quadrant D Data is divided into 100 sec bins |
 |
 |
| Parameter | Plot |
|---|---|
| CZT HV Monitor |  |
| D_VDD | 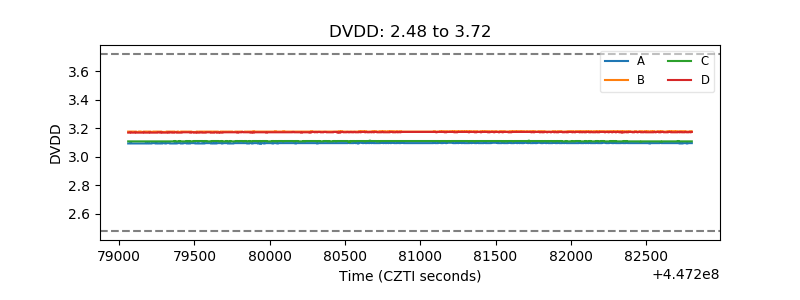 |
| Temperature 1 | 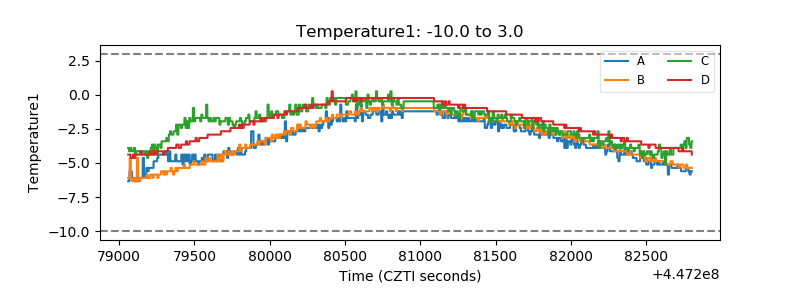 |
| Veto HV Monitor | 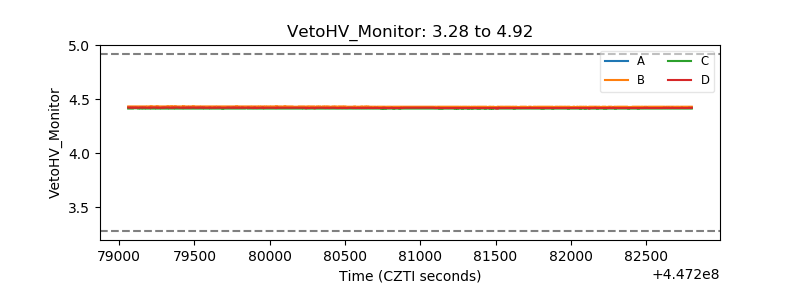 |
| Veto LLD | 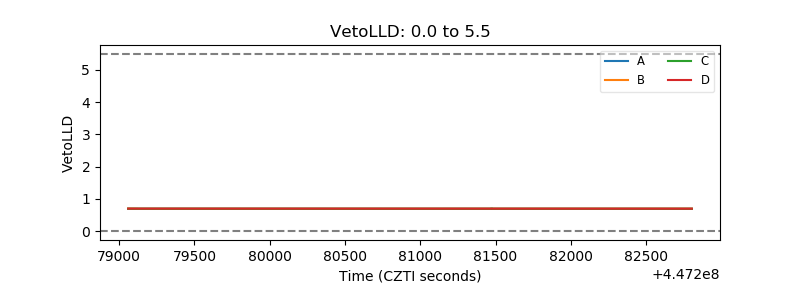 |
| Alpha Counter | 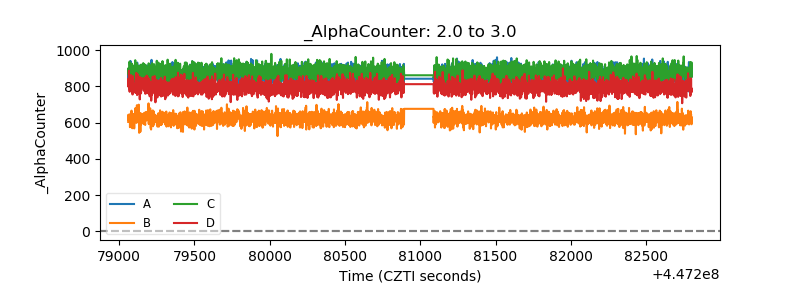 |
| _CPM_Rate | 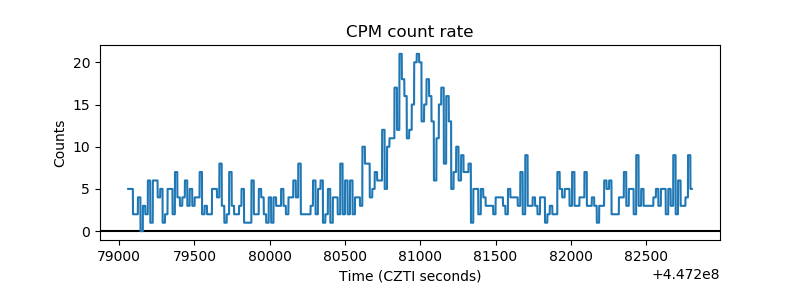 |
| CZT Counter | 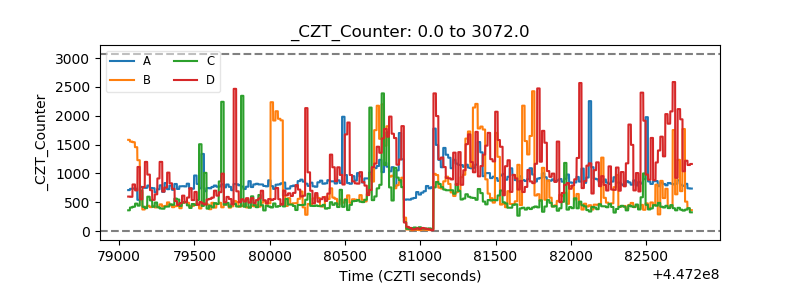 |
| +2.5 Volts monitor |  |
| +5 Volts monitor | 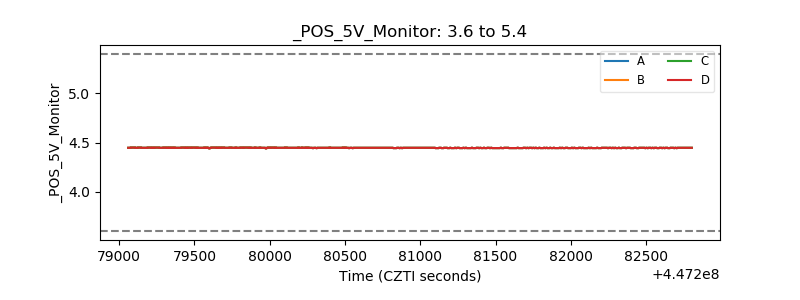 |
| _ROLL_ROT | 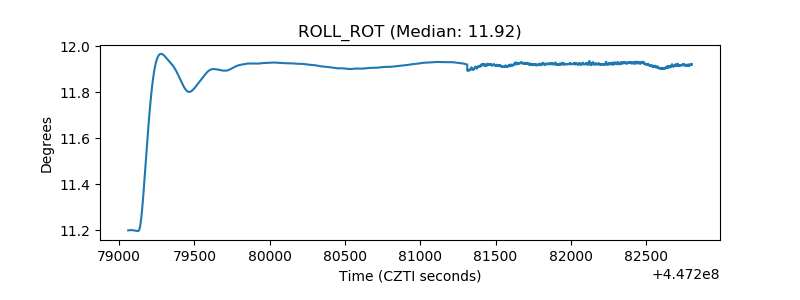 |
| _Roll_DEC | 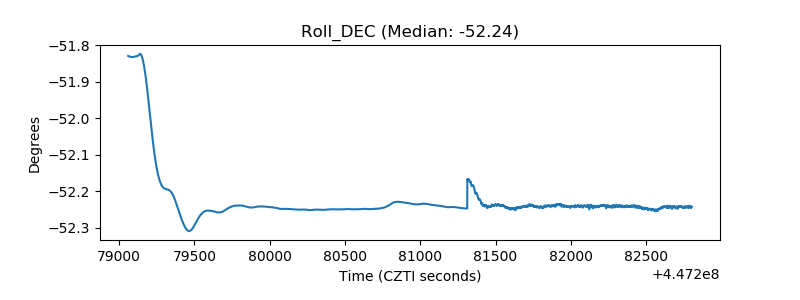 |
| _Roll_RA | 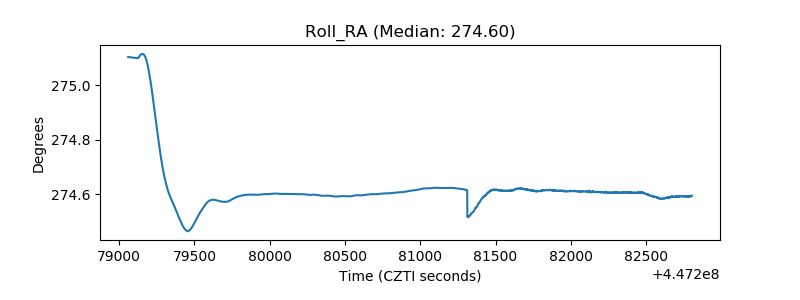 |
| Veto Counter | 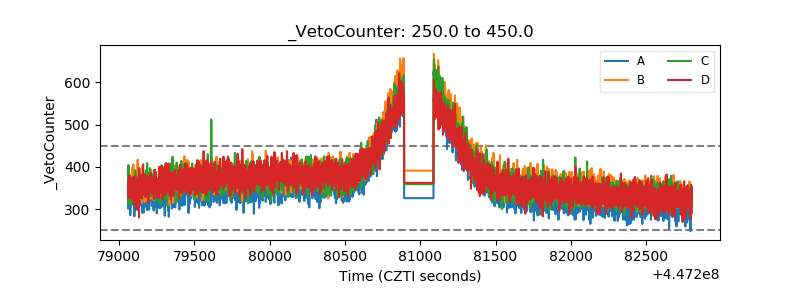 |