| Param | Original file | Final file |
|---|---|---|
| Filename | modeM0/AS1A13_071T08_9000006114_45609cztM0_level2.fits | modeM0/AS1A13_071T08_9000006114_45609cztM0_level2_quad_clean.evt |
| Size (bytes) | 665,507,520 | 117,118,080 |
| Size | 634.7 MB | 111.7 MB |
| Events in quadrant A | 6,475,332 | 812,885 |
| Events in quadrant B | 4,986,708 | 785,080 |
| Events in quadrant C | 3,371,351 | 799,364 |
| Events in quadrant D | 9,212,722 | 619,565 |
| Mode M0 | |||
|---|---|---|---|
| Quadrant | BADHDUFLAG | Total packets | Discarded packets |
| A | 0 | 24425 | 0 |
| B | 0 | 20137 | 0 |
| C | 0 | 15751 | 0 |
| D | 0 | 32622 | 1 |
| Mode SS | |||
|---|---|---|---|
| Quadrant | BADHDUFLAG | Total packets | Discarded packets |
| A | 0 | 152 | 0 |
| B | 0 | 152 | 0 |
| C | 0 | 152 | 0 |
| D | 0 | 152 | 0 |
| Quadrant | Total seconds | Saturated seconds | Saturation percentage |
|---|---|---|---|
| A | 7604 | 139 | 1.827985% |
| B | 7604 | 522 | 6.864808% |
| C | 7605 | 19 | 0.249836% |
| D | 7604 | 1359 | 17.872173% |
Noise dominated data is calculated using 1-second bins in cleaned event files. If a bin has >2000 counts, and if more than 50% of those come from <1% of pixels, then it is considered to be noise-dominated and hence unusable.
| Quadrant | # 1 sec bins | Bins with >0 counts | Bins with >2000 counts | High rate bins dominated by noise | Noise dominated (total time) | Noise dominated (detector-on time) | Marked lightcurve |
|---|---|---|---|---|---|---|---|
| A | 7604 | 7604 | 59 | 59 | 0.78% | 0.78% | 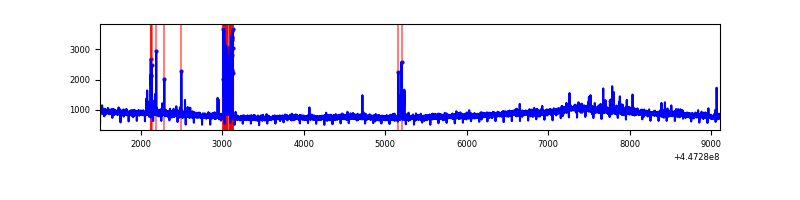 |
| B | 7604 | 7604 | 319 | 319 | 4.20% | 4.20% | 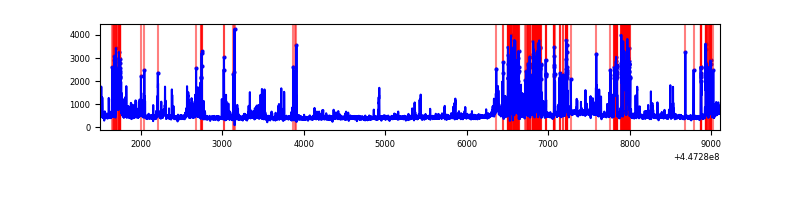 |
| C | 7605 | 7605 | 16 | 16 | 0.21% | 0.21% | 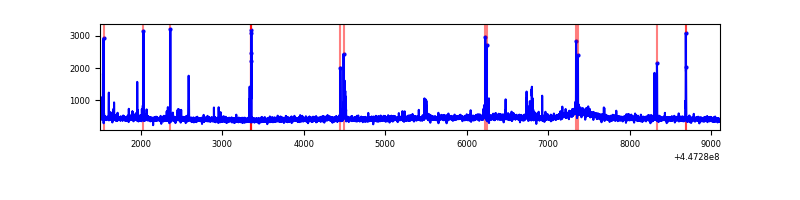 |
| D | 7604 | 7604 | 1186 | 1186 | 15.60% | 15.60% | 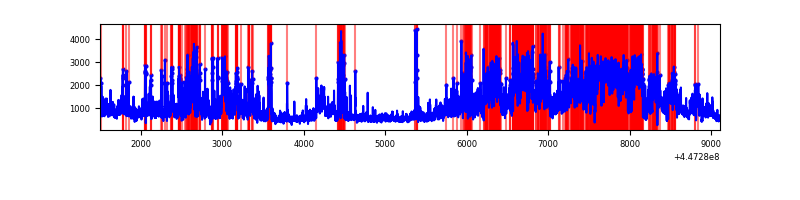 |
Top three noisy pixels from each quadrant. If the there are fewer than three noisy pixels in the level2.evt file, extra rows are filled as -1
| Pixel properties | Quadrant properties | ||||||
|---|---|---|---|---|---|---|---|
| Quadrant | DetID | PixID | Counts | Sigma | Mean | Median | Sigma |
| A | 10 | 83 | 2978377 | 17096.48 | 834 | 818 | 174.2 |
| A | 10 | 248 | 215338 | 1231.73 | 834 | 818 | 174.2 |
| A | 0 | 243 | 40391 | 227.22 | 834 | 818 | 174.2 |
| B | 15 | 201 | 637282 | 3998.48 | 813 | 789 | 159.2 |
| B | 5 | 172 | 567943 | 3562.89 | 813 | 789 | 159.2 |
| B | 12 | 18 | 325383 | 2039.12 | 813 | 789 | 159.2 |
| C | 14 | 254 | 113406 | 587.94 | 818 | 823 | 191.5 |
| C | 2 | 14 | 36521 | 186.43 | 818 | 823 | 191.5 |
| C | 12 | 2 | 17693 | 88.1 | 818 | 823 | 191.5 |
| D | 8 | 48 | 2860449 | 14640.11 | 769 | 743 | 195.3 |
| D | 11 | 241 | 2266053 | 11597.13 | 769 | 743 | 195.3 |
| D | 13 | 249 | 317259 | 1620.39 | 769 | 743 | 195.3 |
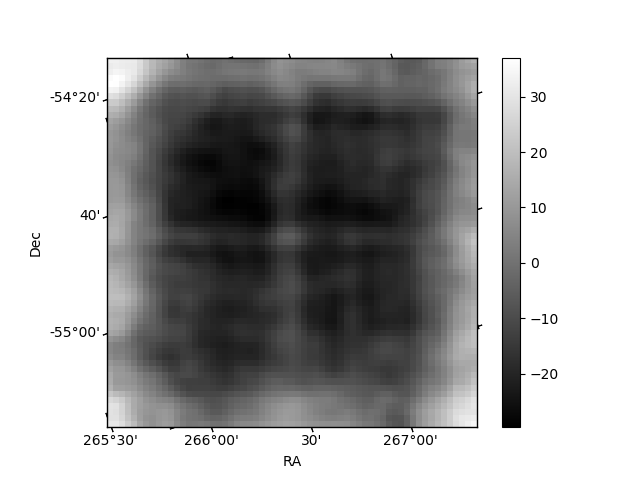
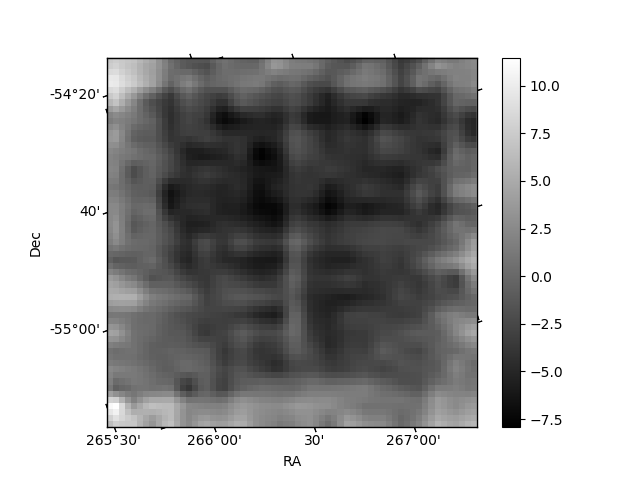
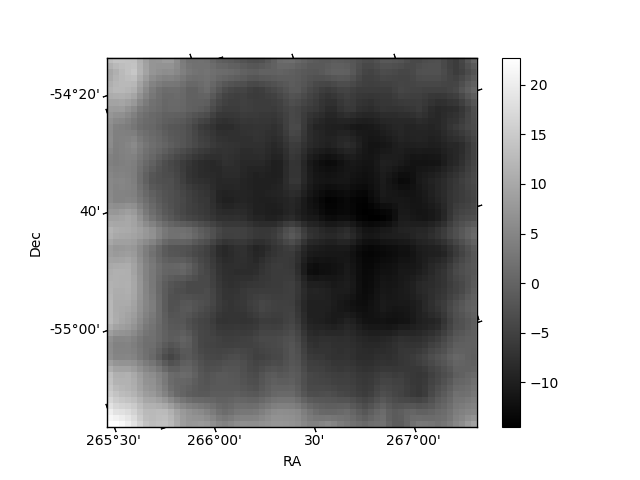
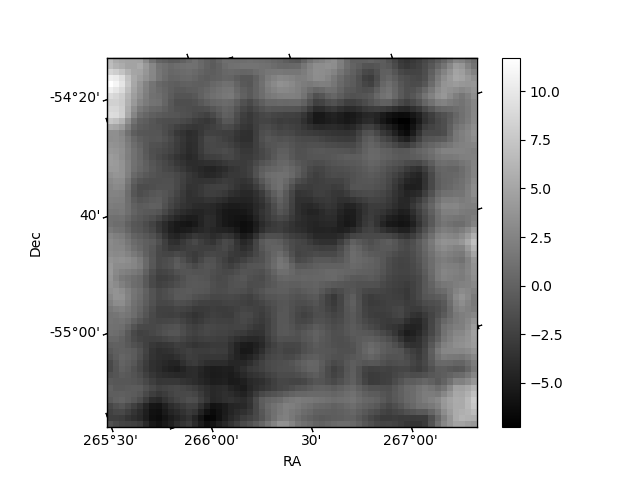
Histogram calculated using DETX and DETY for each event in the final _common_clean file
| Quadrant A | 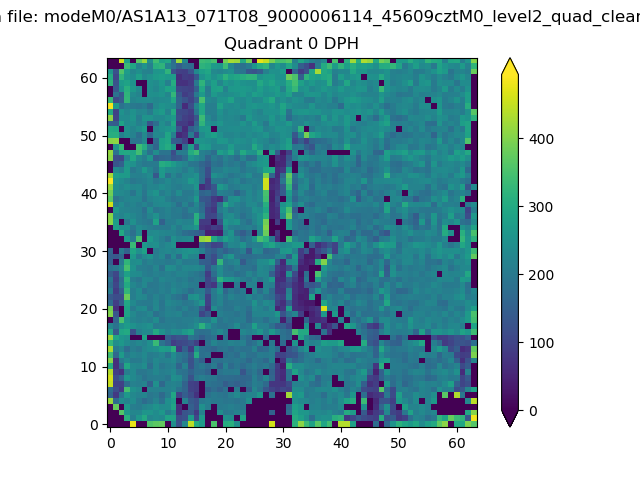 |
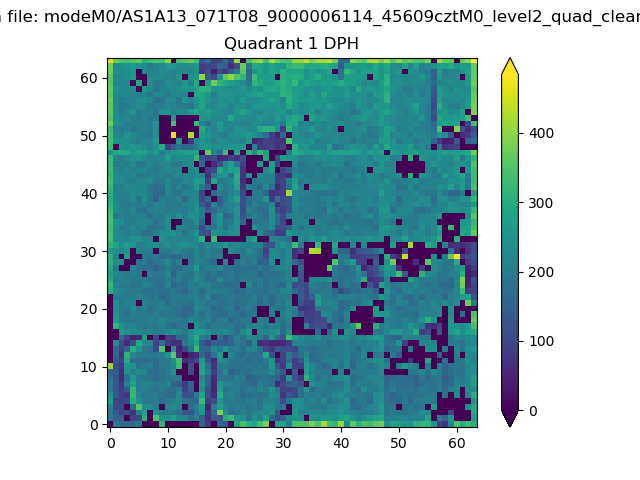 |
Quadrant B |
|---|---|---|---|
| Quadrant D | 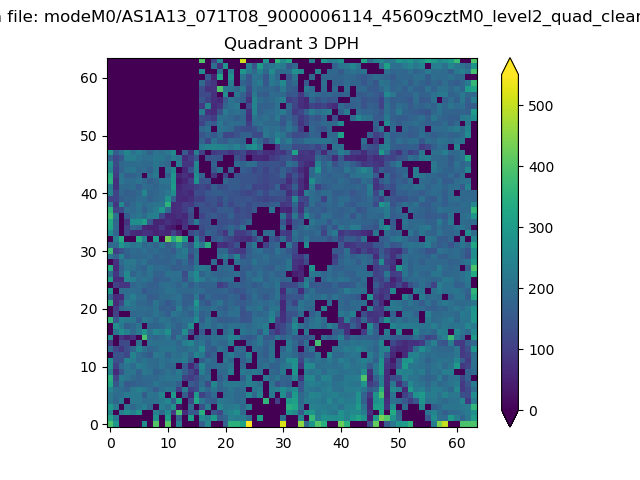 |
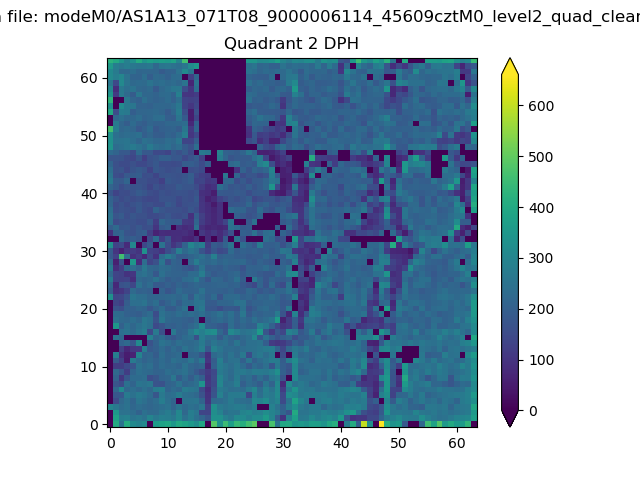 |
Quadrant C |
| Plot type | Count rate plots | Images |
|---|---|---|
| Comparison with Poisson distribution Blue bars denote a histogram of data divided into 1 sec bins. Red curve is a Poisson curve with rate = median count rate of data. |
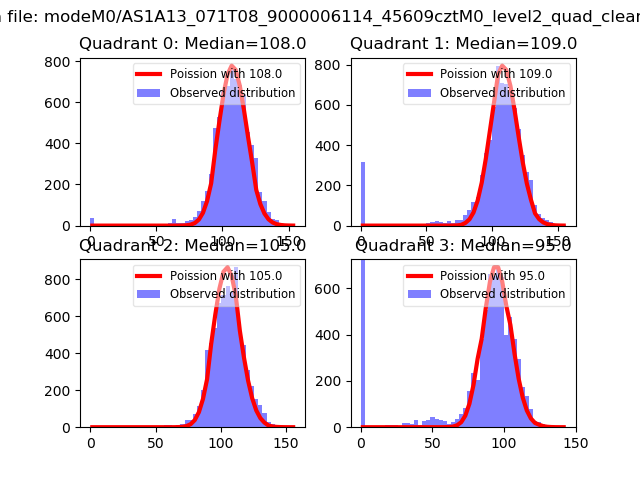 |
 |
| Quadrant-wise count rates Data is divided into 100 sec bins |
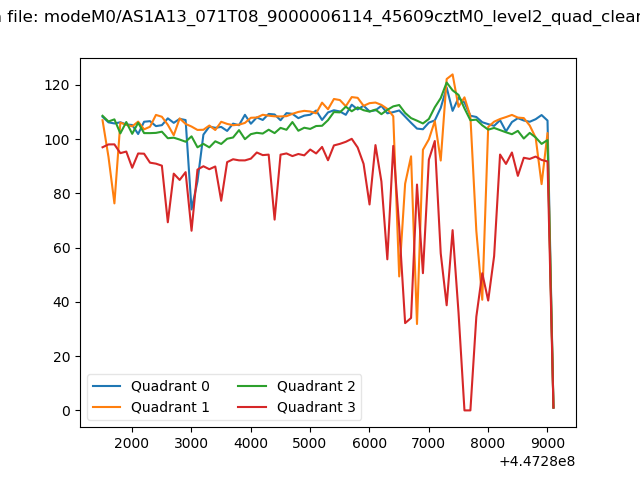 |
|
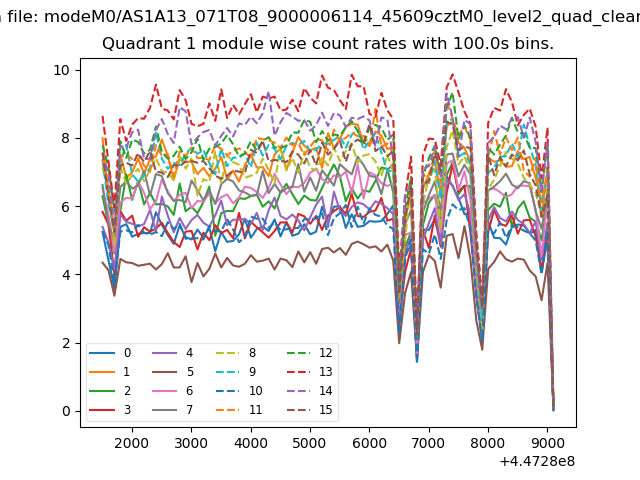
| Module-wise count rates for Quadrant A Data is divided into 100 sec bins |
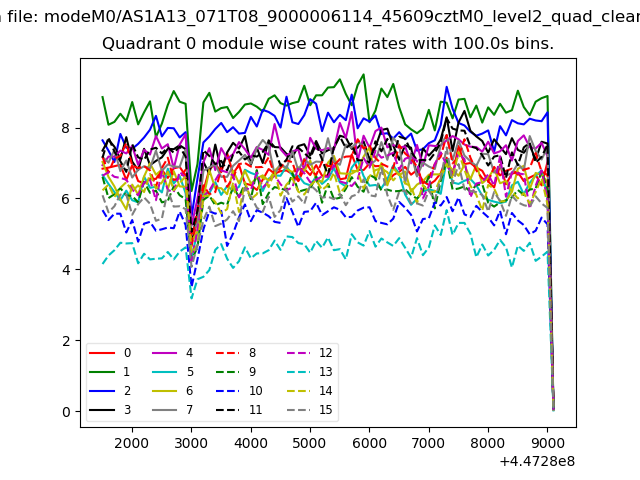 |
 |
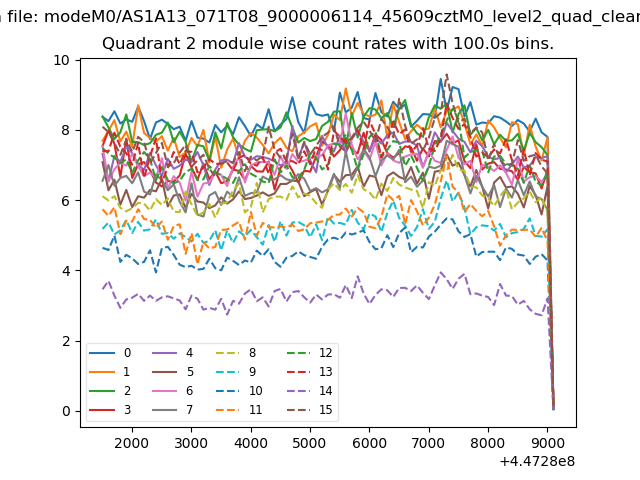
| Module-wise count rates for Quadrant B Data is divided into 100 sec bins |
 |
 |
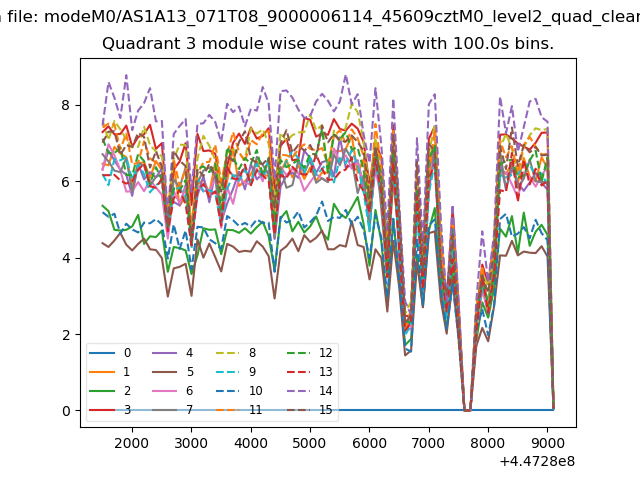
| Module-wise count rates for Quadrant C Data is divided into 100 sec bins |
 |
 |
| Module-wise count rates for Quadrant D Data is divided into 100 sec bins |
 |
 |
| Parameter | Plot |
|---|---|
| CZT HV Monitor |  |
| D_VDD | 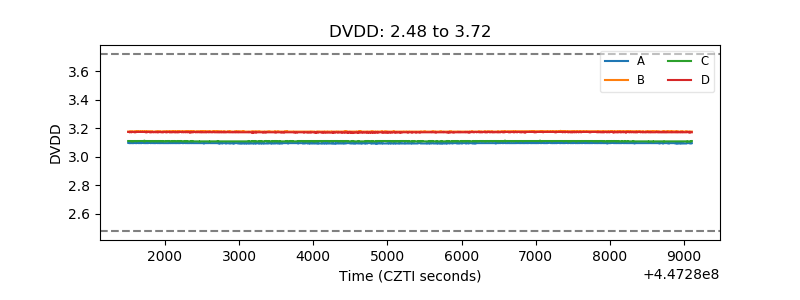 |
| Temperature 1 | 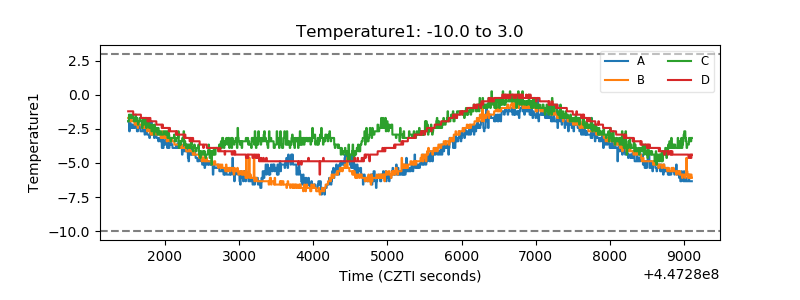 |
| Veto HV Monitor | 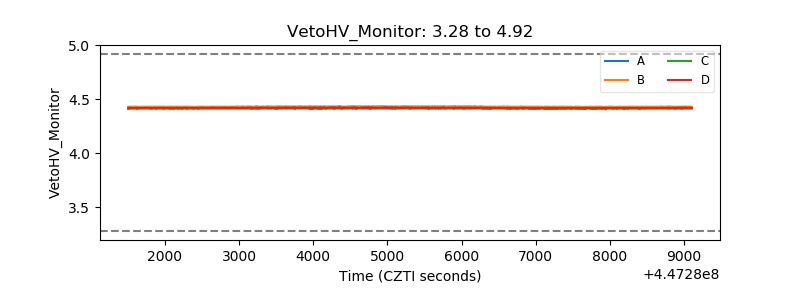 |
| Veto LLD | 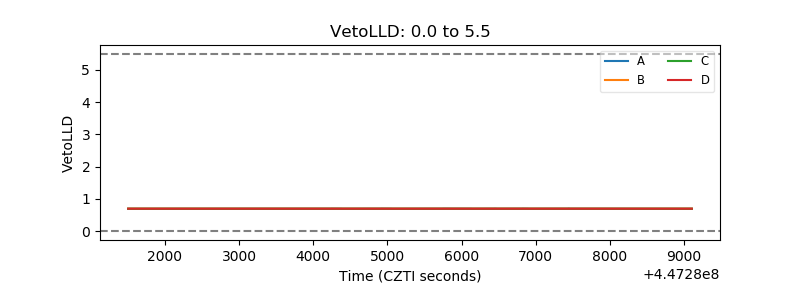 |
| Alpha Counter | 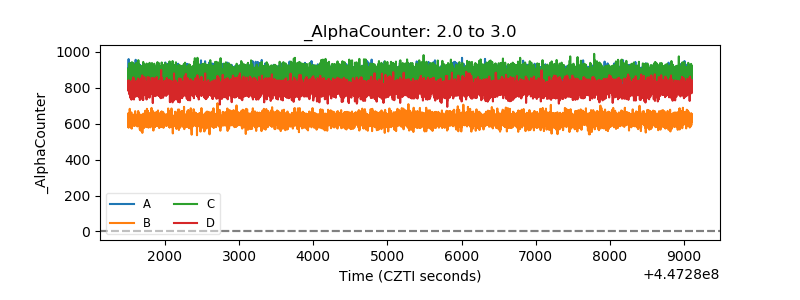 |
| _CPM_Rate | 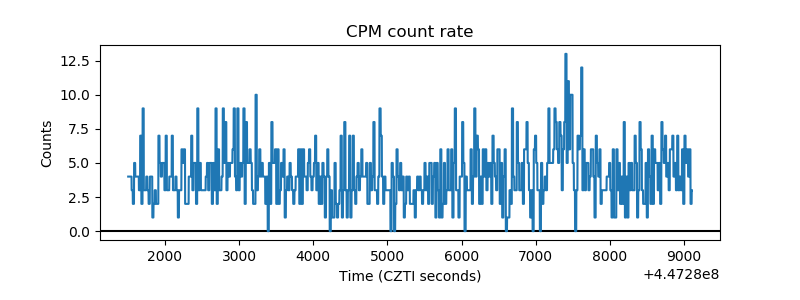 |
| CZT Counter | 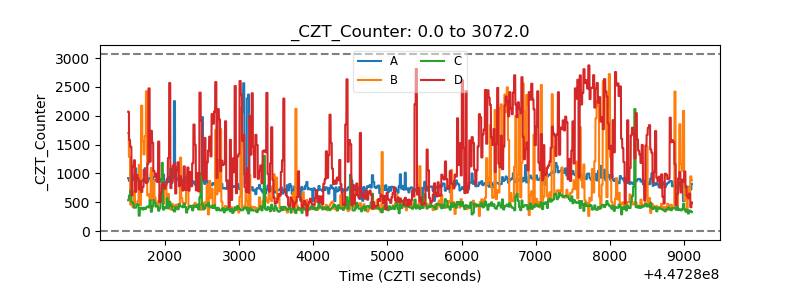 |
| +2.5 Volts monitor | 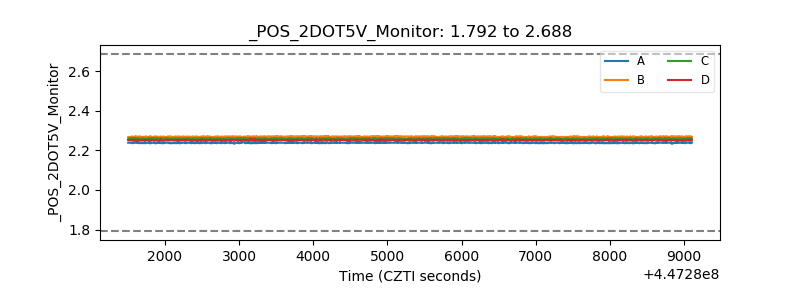 |
| +5 Volts monitor | 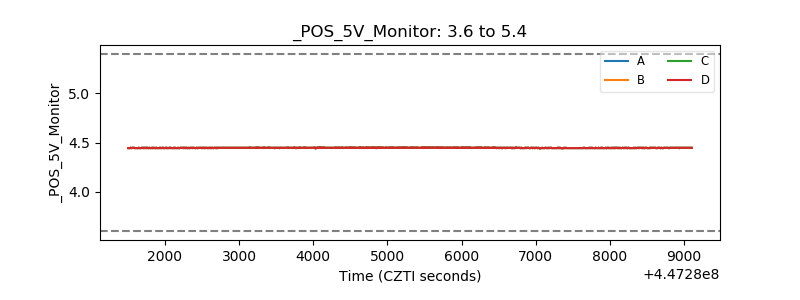 |
| _ROLL_ROT | 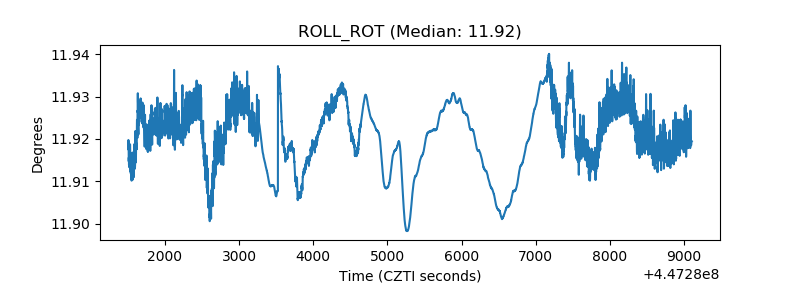 |
| _Roll_DEC | 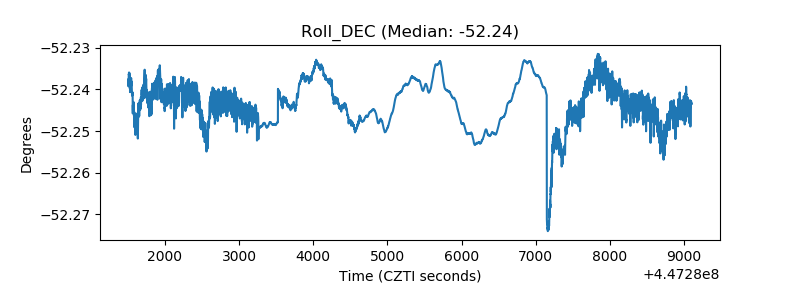 |
| _Roll_RA | 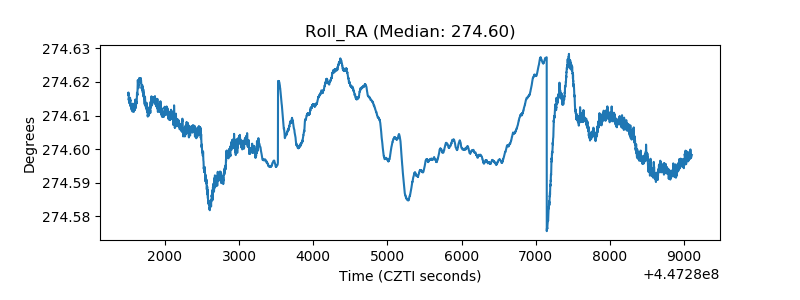 |
| Veto Counter | 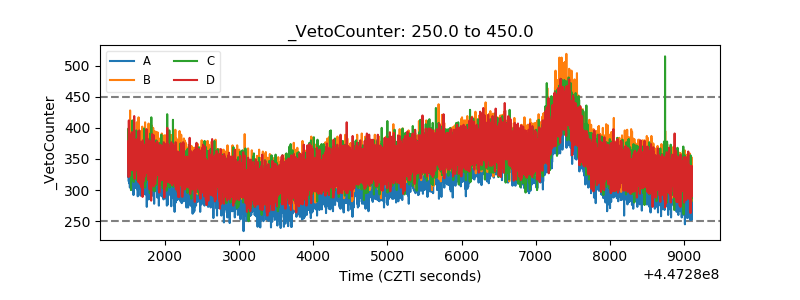 |