| Param | Original file | Final file |
|---|---|---|
| Filename | modeM0/AS1A13_071T08_9000006114_45618cztM0_level2.fits | modeM0/AS1A13_071T08_9000006114_45618cztM0_level2_quad_clean.evt |
| Size (bytes) | 516,314,880 | 109,333,440 |
| Size | 492.4 MB | 104.3 MB |
| Events in quadrant A | 5,581,056 | 748,648 |
| Events in quadrant B | 4,130,982 | 749,950 |
| Events in quadrant C | 3,001,879 | 741,112 |
| Events in quadrant D | 5,910,060 | 631,370 |
| Mode M9 | |||
|---|---|---|---|
| Quadrant | BADHDUFLAG | Total packets | Discarded packets |
| A | 0 | 12 | 0 |
| B | 0 | 12 | 0 |
| C | 0 | 12 | 0 |
| D | 0 | 12 | 0 |
| Mode M0 | |||
|---|---|---|---|
| Quadrant | BADHDUFLAG | Total packets | Discarded packets |
| A | 0 | 20158 | 0 |
| B | 0 | 16297 | 1 |
| C | 0 | 13243 | 0 |
| D | 0 | 22054 | 0 |
| Mode SS | |||
|---|---|---|---|
| Quadrant | BADHDUFLAG | Total packets | Discarded packets |
| A | 0 | 128 | 0 |
| B | 0 | 128 | 0 |
| C | 0 | 128 | 0 |
| D | 0 | 128 | 0 |
| Quadrant | Total seconds | Saturated seconds | Saturation percentage |
|---|---|---|---|
| A | 6299 | 148 | 2.349579% |
| B | 6299 | 327 | 5.191300% |
| C | 6299 | 33 | 0.523893% |
| D | 6299 | 565 | 8.969678% |
Noise dominated data is calculated using 1-second bins in cleaned event files. If a bin has >2000 counts, and if more than 50% of those come from <1% of pixels, then it is considered to be noise-dominated and hence unusable.
| Quadrant | # 1 sec bins | Bins with >0 counts | Bins with >2000 counts | High rate bins dominated by noise | Noise dominated (total time) | Noise dominated (detector-on time) | Marked lightcurve |
|---|---|---|---|---|---|---|---|
| A | 7479 | 6300 | 3 | 3 | 0.04% | 0.05% | 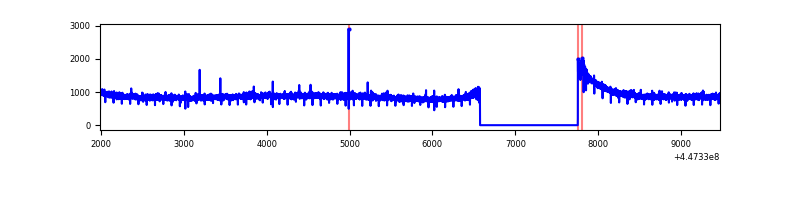 |
| B | 7479 | 6300 | 175 | 175 | 2.34% | 2.78% | 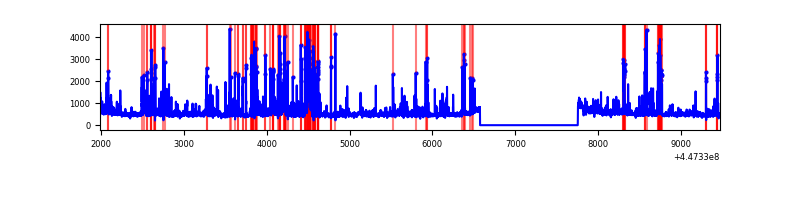 |
| C | 7479 | 6300 | 5 | 5 | 0.07% | 0.08% | 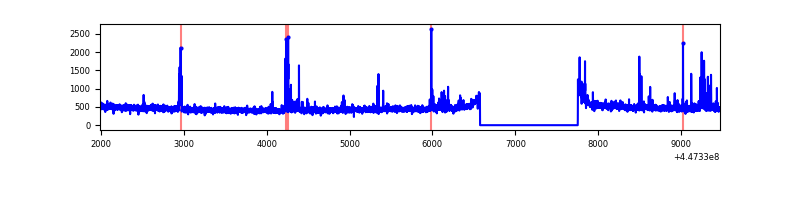 |
| D | 7479 | 6300 | 469 | 469 | 6.27% | 7.44% | 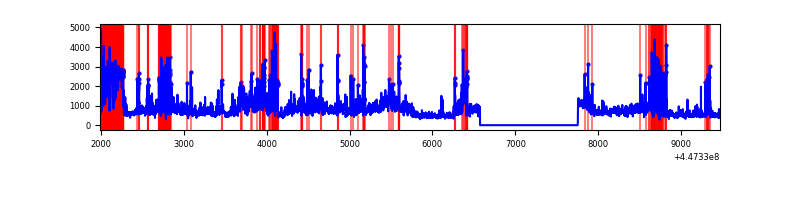 |
Top three noisy pixels from each quadrant. If the there are fewer than three noisy pixels in the level2.evt file, extra rows are filled as -1
| Pixel properties | Quadrant properties | ||||||
|---|---|---|---|---|---|---|---|
| Quadrant | DetID | PixID | Counts | Sigma | Mean | Median | Sigma |
| A | 10 | 83 | 2676287 | 17535.98 | 744 | 728 | 152.6 |
| A | 13 | 6 | 13386 | 82.96 | 744 | 728 | 152.6 |
| A | 0 | 243 | 9443 | 57.12 | 744 | 728 | 152.6 |
| B | 5 | 172 | 577872 | 4117.04 | 726 | 706 | 140.2 |
| B | 3 | 112 | 184722 | 1312.62 | 726 | 706 | 140.2 |
| B | 12 | 18 | 150087 | 1065.56 | 726 | 706 | 140.2 |
| C | 12 | 2 | 79478 | 466.55 | 724 | 730 | 168.8 |
| C | 0 | 207 | 44503 | 259.34 | 724 | 730 | 168.8 |
| C | 14 | 254 | 36304 | 210.76 | 724 | 730 | 168.8 |
| D | 11 | 241 | 1173527 | 6605.18 | 706 | 683 | 177.6 |
| D | 11 | 224 | 637158 | 3584.48 | 706 | 683 | 177.6 |
| D | 13 | 249 | 449498 | 2527.62 | 706 | 683 | 177.6 |
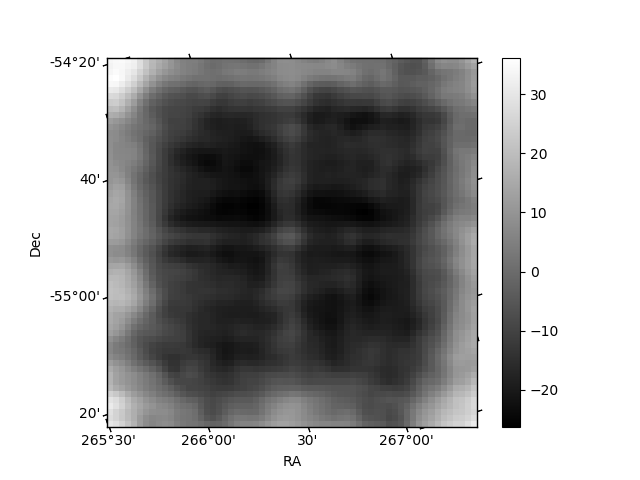
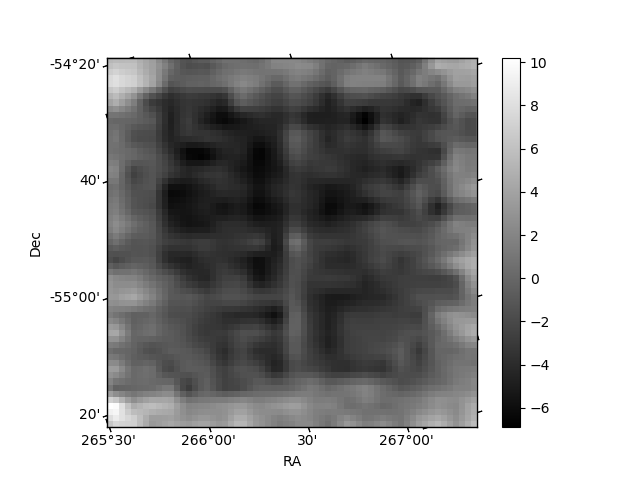
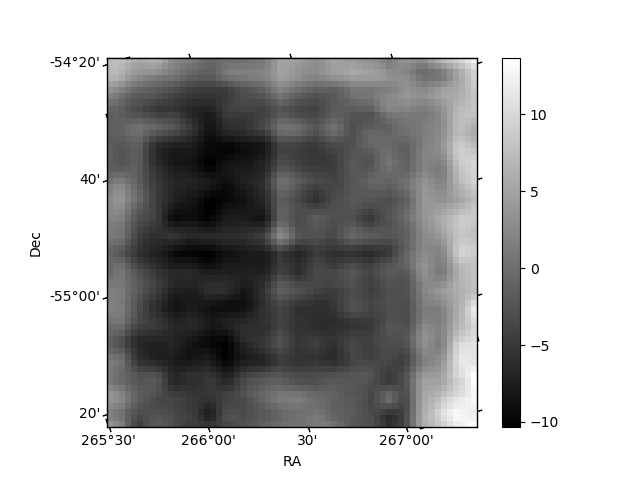
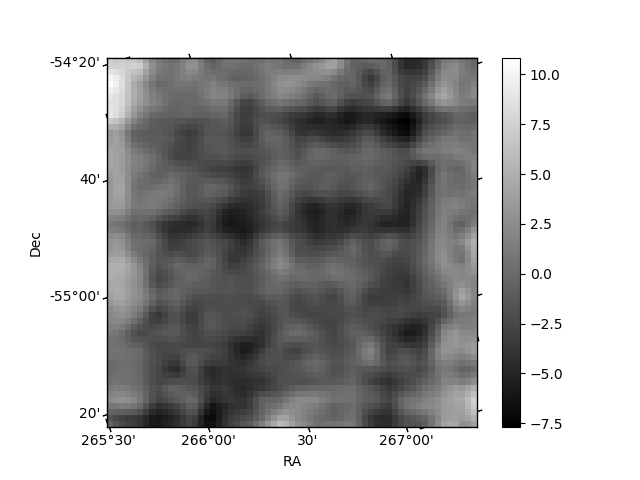
Histogram calculated using DETX and DETY for each event in the final _common_clean file
| Quadrant A | 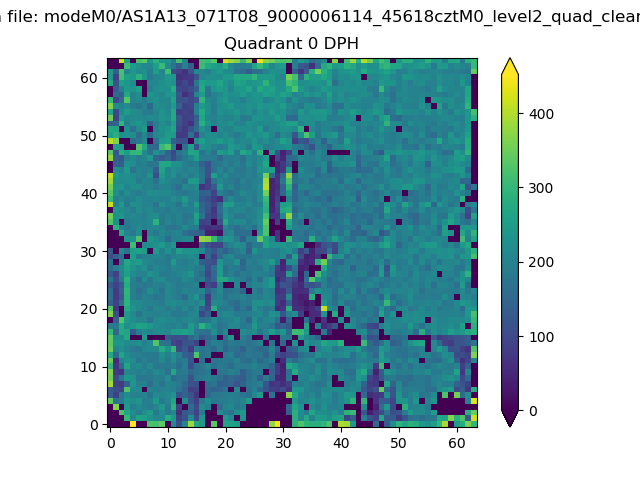 |
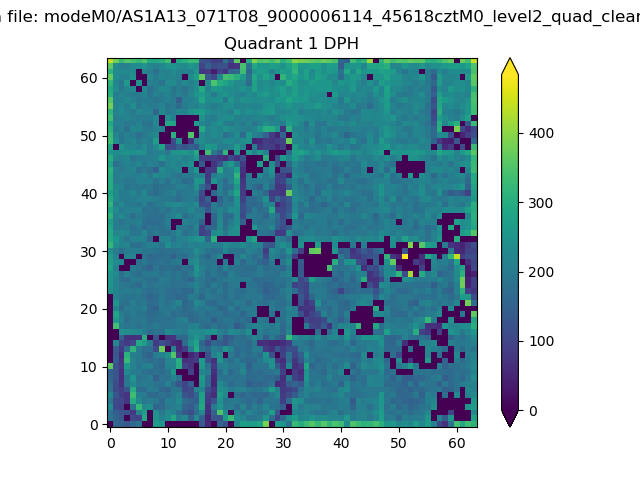 |
Quadrant B |
|---|---|---|---|
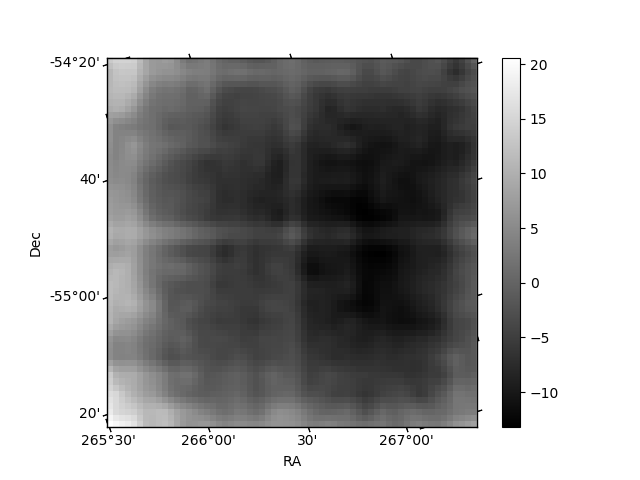
| Quadrant D | 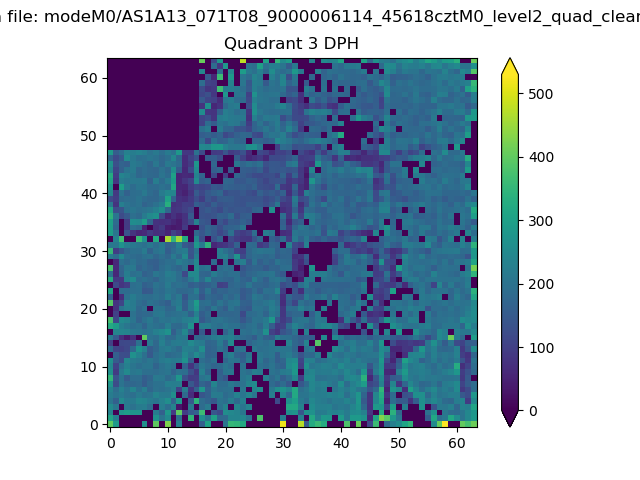 |
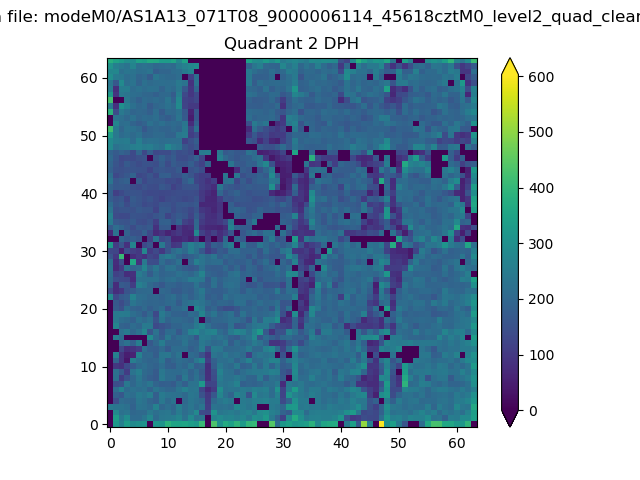 |
Quadrant C |
| Plot type | Count rate plots | Images |
|---|---|---|
| Comparison with Poisson distribution Blue bars denote a histogram of data divided into 1 sec bins. Red curve is a Poisson curve with rate = median count rate of data. |
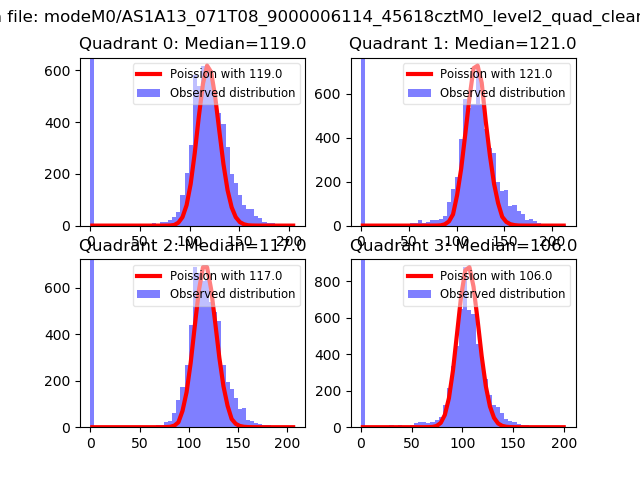 |
 |
| Quadrant-wise count rates Data is divided into 100 sec bins |
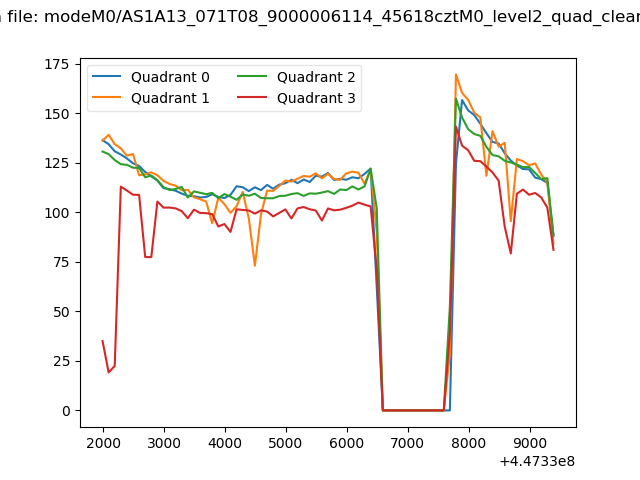 |
|
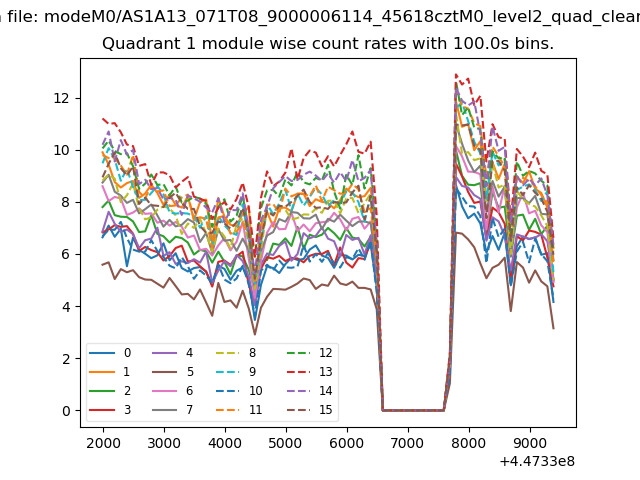
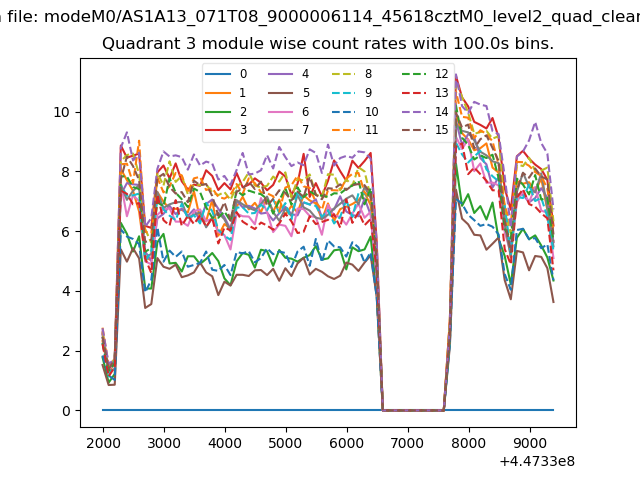
| Module-wise count rates for Quadrant A Data is divided into 100 sec bins |
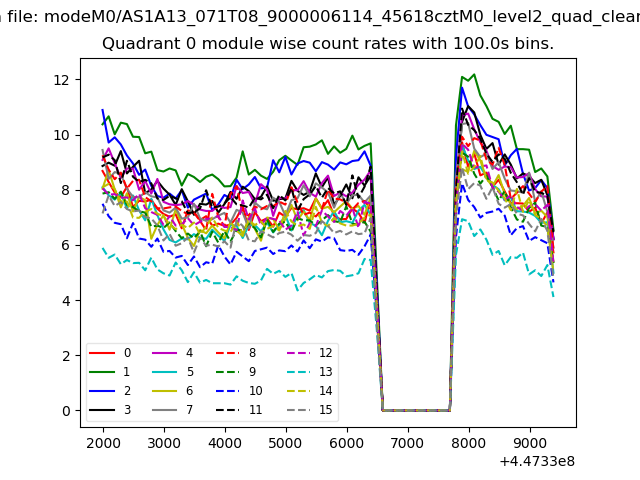 |
 |
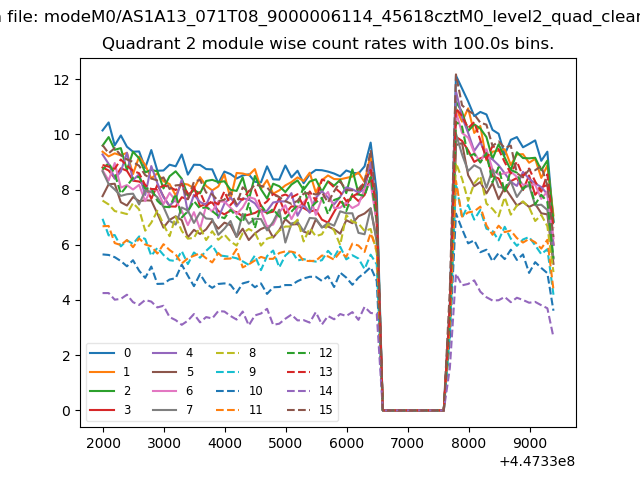
| Module-wise count rates for Quadrant B Data is divided into 100 sec bins |
 |
 |
| Module-wise count rates for Quadrant C Data is divided into 100 sec bins |
 |
 |
| Module-wise count rates for Quadrant D Data is divided into 100 sec bins |
 |
 |
| Parameter | Plot |
|---|---|
| CZT HV Monitor | 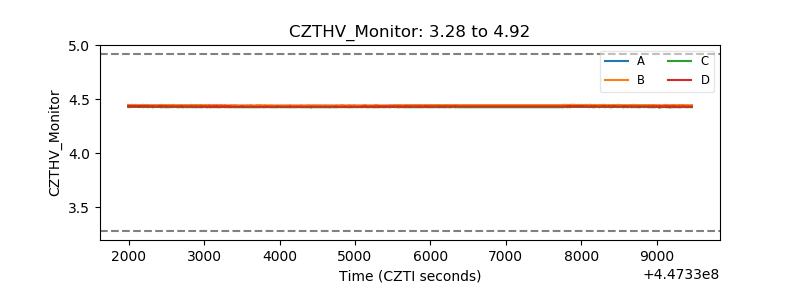 |
| D_VDD | 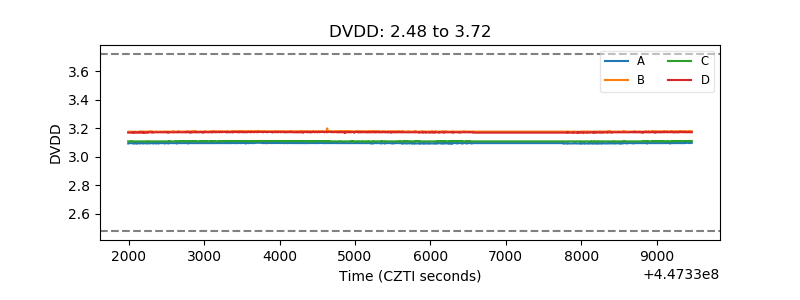 |
| Temperature 1 | 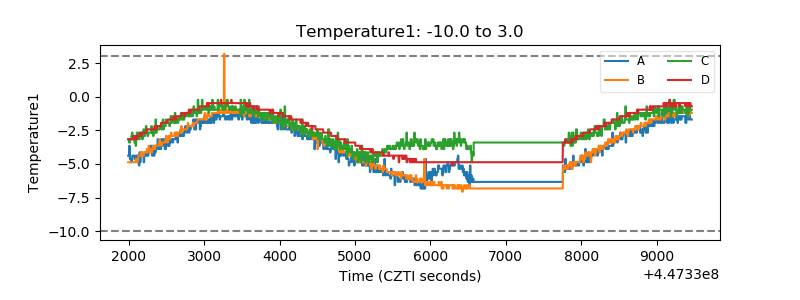 |
| Veto HV Monitor | 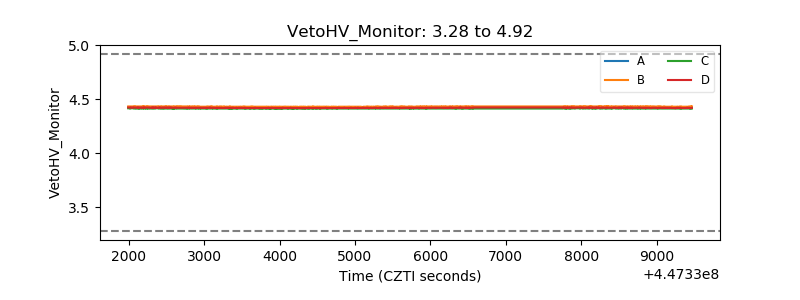 |
| Veto LLD | 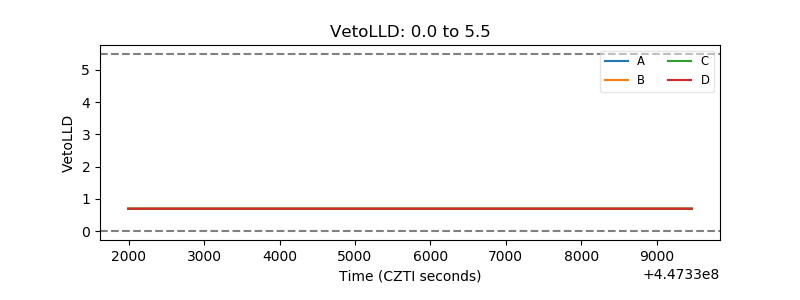 |
| Alpha Counter | 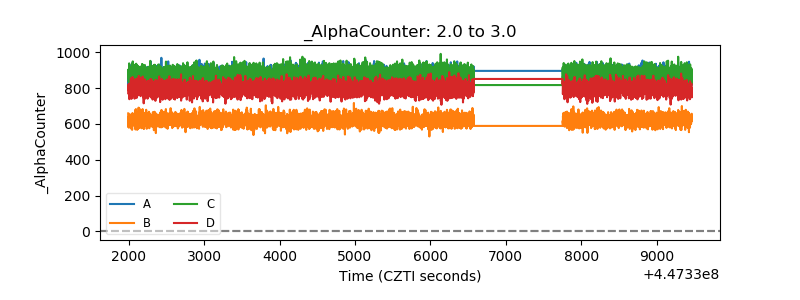 |
| _CPM_Rate | 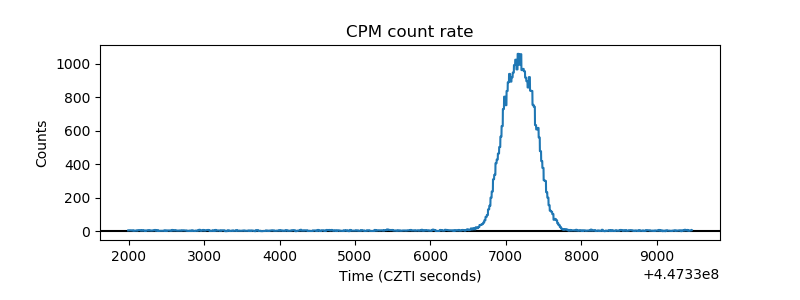 |
| CZT Counter | 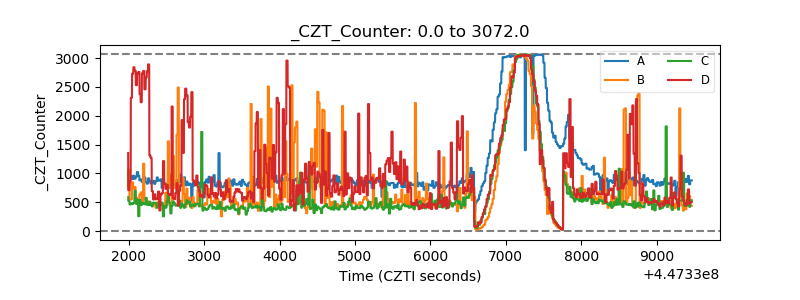 |
| +2.5 Volts monitor | 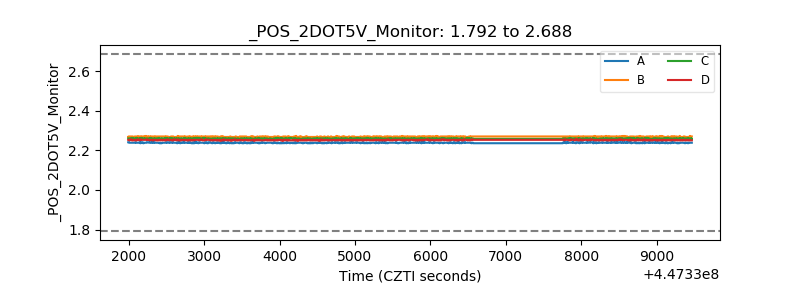 |
| +5 Volts monitor | 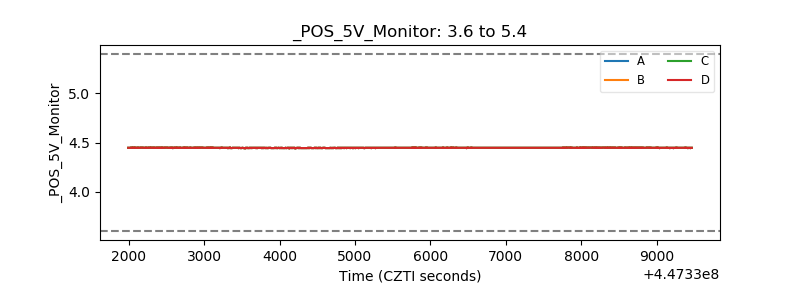 |
| _ROLL_ROT | 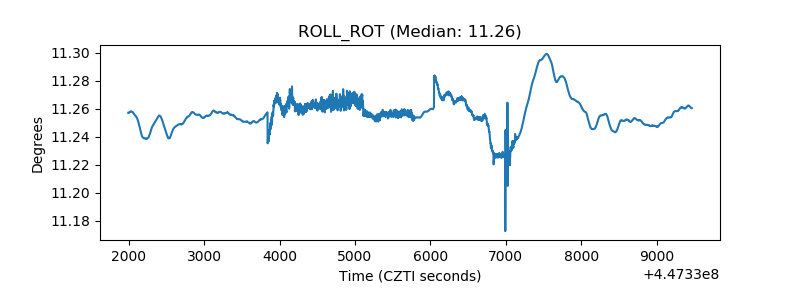 |
| _Roll_DEC | 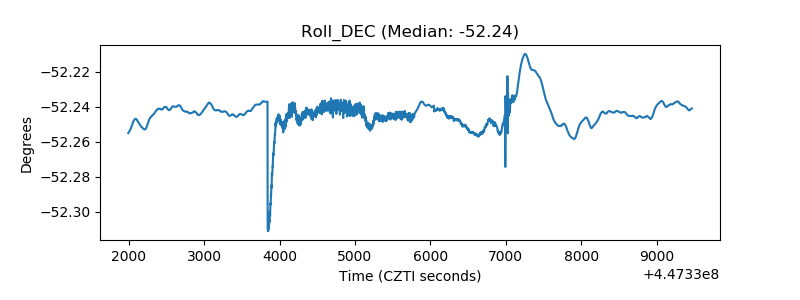 |
| _Roll_RA | 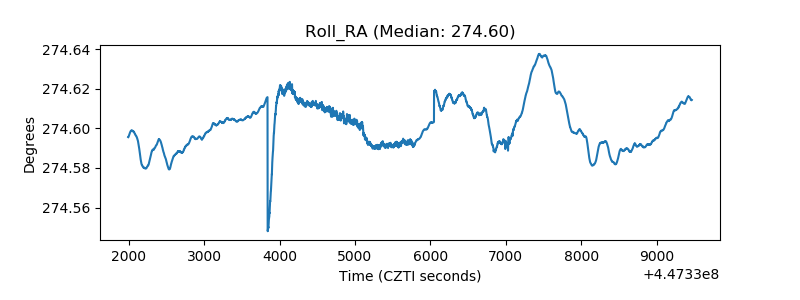 |
| Veto Counter | 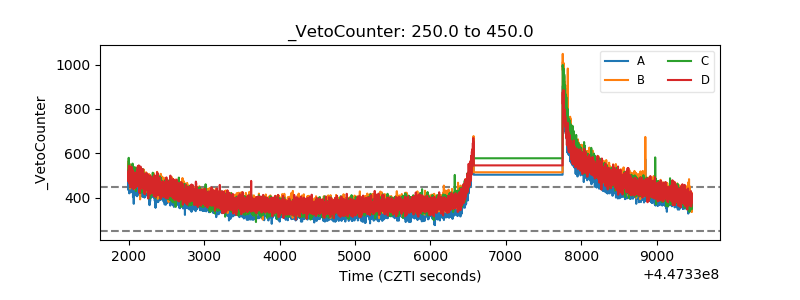 |