| Param | Original file | Final file |
|---|---|---|
| Filename | modeM0/AS1A13_071T08_9000006114_45619cztM0_level2.fits | modeM0/AS1A13_071T08_9000006114_45619cztM0_level2_quad_clean.evt |
| Size (bytes) | 551,733,120 | 111,994,560 |
| Size | 526.2 MB | 106.8 MB |
| Events in quadrant A | 5,811,909 | 775,705 |
| Events in quadrant B | 4,535,826 | 740,054 |
| Events in quadrant C | 3,600,087 | 759,372 |
| Events in quadrant D | 5,977,424 | 667,835 |
| Mode M9 | |||
|---|---|---|---|
| Quadrant | BADHDUFLAG | Total packets | Discarded packets |
| A | 0 | 12 | 0 |
| B | 0 | 12 | 0 |
| C | 0 | 12 | 0 |
| D | 0 | 12 | 0 |
| Mode M0 | |||
|---|---|---|---|
| Quadrant | BADHDUFLAG | Total packets | Discarded packets |
| A | 0 | 21056 | 1 |
| B | 0 | 17631 | 1 |
| C | 0 | 15001 | 1 |
| D | 0 | 22118 | 1 |
| Mode SS | |||
|---|---|---|---|
| Quadrant | BADHDUFLAG | Total packets | Discarded packets |
| A | 0 | 130 | 0 |
| B | 0 | 130 | 0 |
| C | 0 | 130 | 0 |
| D | 0 | 130 | 0 |
| Quadrant | Total seconds | Saturated seconds | Saturation percentage |
|---|---|---|---|
| A | 6428 | 195 | 3.033603% |
| B | 6428 | 624 | 9.707530% |
| C | 6428 | 149 | 2.317984% |
| D | 6428 | 532 | 8.276291% |
Noise dominated data is calculated using 1-second bins in cleaned event files. If a bin has >2000 counts, and if more than 50% of those come from <1% of pixels, then it is considered to be noise-dominated and hence unusable.
| Quadrant | # 1 sec bins | Bins with >0 counts | Bins with >2000 counts | High rate bins dominated by noise | Noise dominated (total time) | Noise dominated (detector-on time) | Marked lightcurve |
|---|---|---|---|---|---|---|---|
| A | 7628 | 6429 | 19 | 19 | 0.25% | 0.30% | 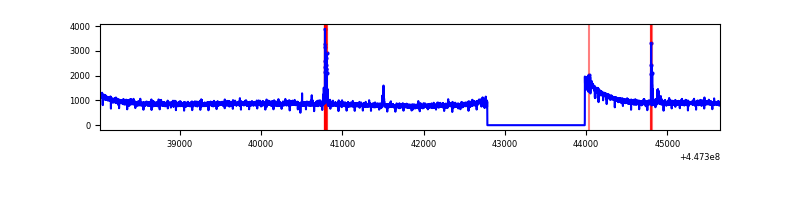 |
| B | 7628 | 6429 | 411 | 411 | 5.39% | 6.39% | 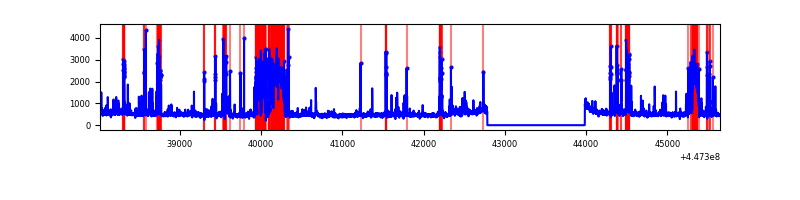 |
| C | 7628 | 6429 | 97 | 97 | 1.27% | 1.51% | 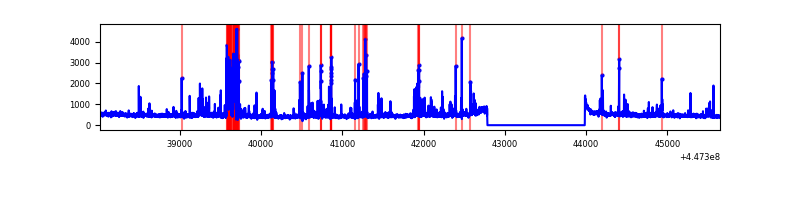 |
| D | 7628 | 6429 | 408 | 408 | 5.35% | 6.35% | 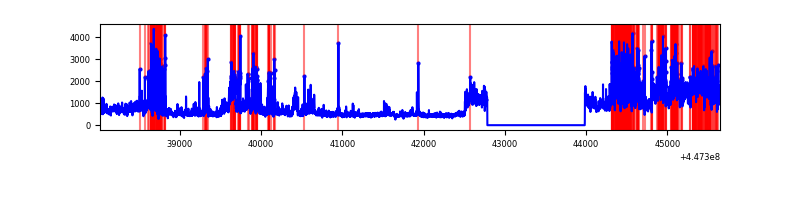 |
Top three noisy pixels from each quadrant. If the there are fewer than three noisy pixels in the level2.evt file, extra rows are filled as -1
| Pixel properties | Quadrant properties | ||||||
|---|---|---|---|---|---|---|---|
| Quadrant | DetID | PixID | Counts | Sigma | Mean | Median | Sigma |
| A | 10 | 83 | 2747883 | 17438.95 | 769 | 753 | 157.5 |
| A | 10 | 248 | 42328 | 263.92 | 769 | 753 | 157.5 |
| A | 13 | 248 | 26514 | 163.53 | 769 | 753 | 157.5 |
| B | 5 | 172 | 946221 | 6757.72 | 730 | 712 | 139.9 |
| B | 15 | 201 | 427821 | 3052.62 | 730 | 712 | 139.9 |
| B | 4 | 170 | 102749 | 729.28 | 730 | 712 | 139.9 |
| C | 12 | 2 | 352617 | 2035.66 | 744 | 750 | 172.9 |
| C | 14 | 254 | 260932 | 1505.23 | 744 | 750 | 172.9 |
| C | 0 | 207 | 55214 | 315.09 | 744 | 750 | 172.9 |
| D | 11 | 241 | 1920497 | 10398.82 | 738 | 716 | 184.6 |
| D | 13 | 249 | 562709 | 3044.13 | 738 | 716 | 184.6 |
| D | 1 | 52 | 298327 | 1612.06 | 738 | 716 | 184.6 |
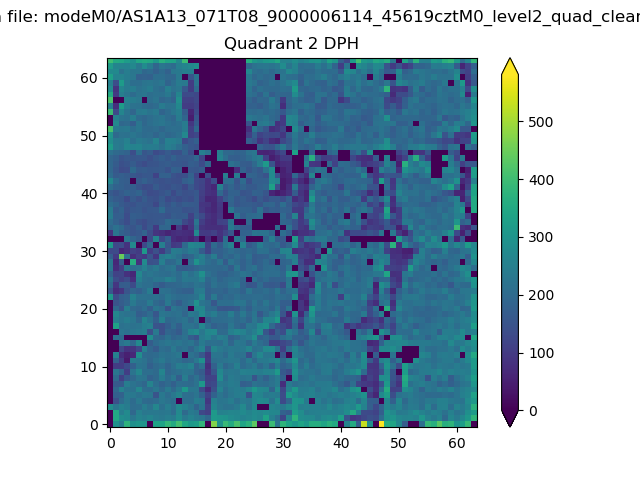
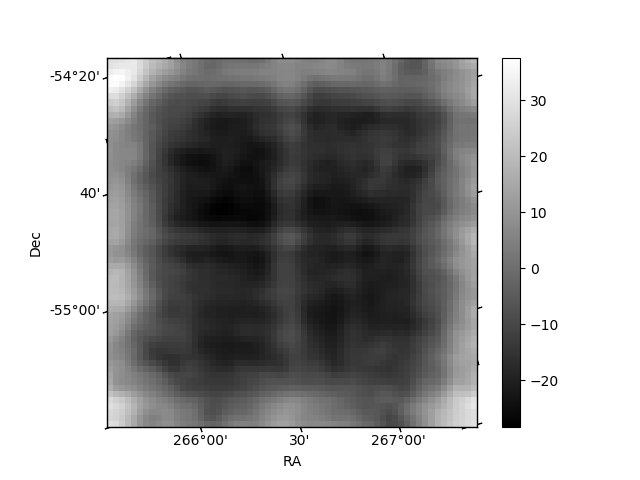
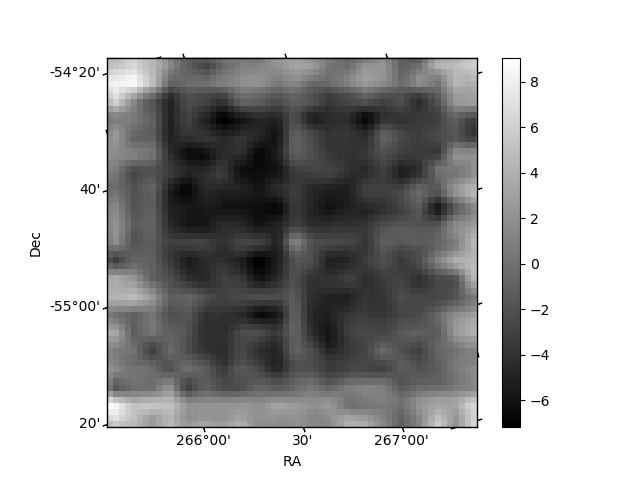
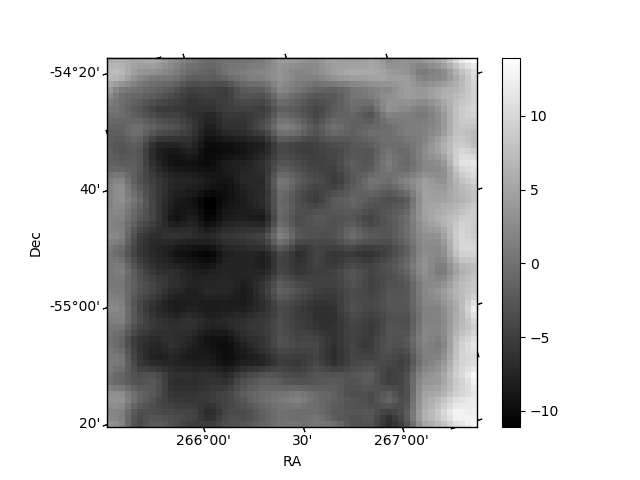
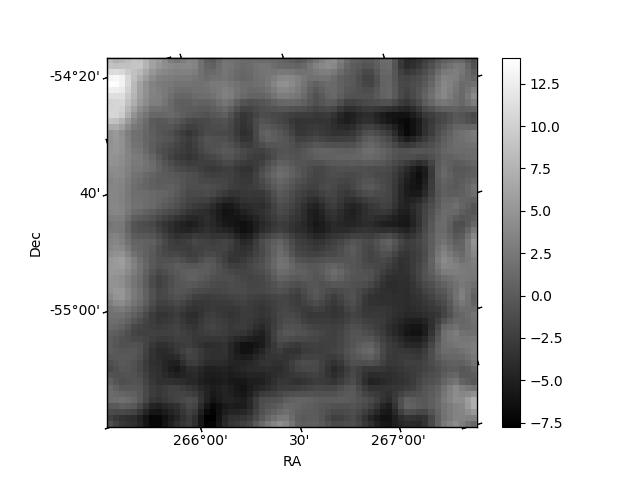
Histogram calculated using DETX and DETY for each event in the final _common_clean file
| Quadrant A | 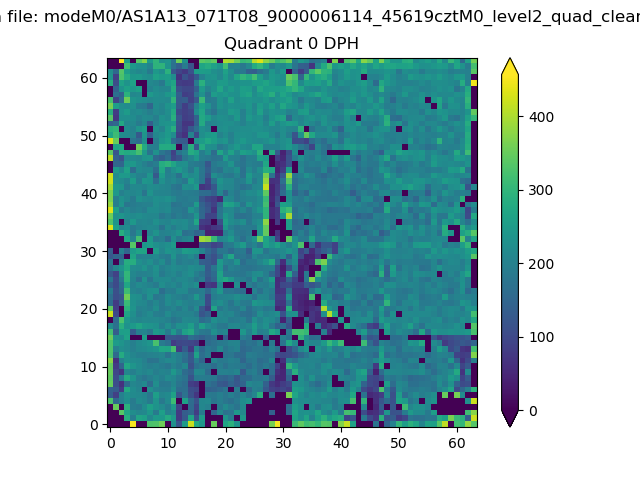 |
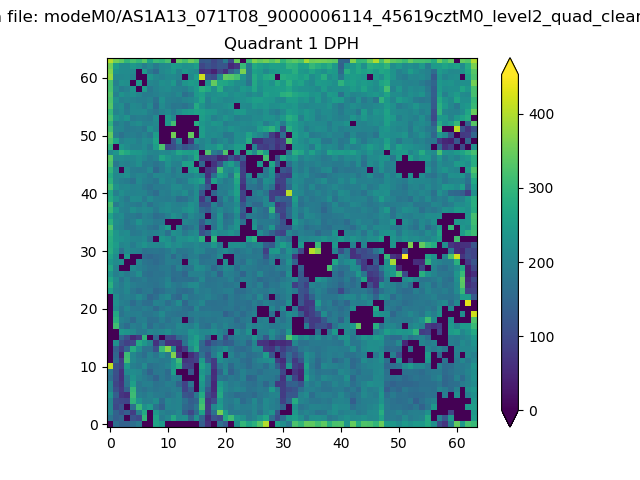 |
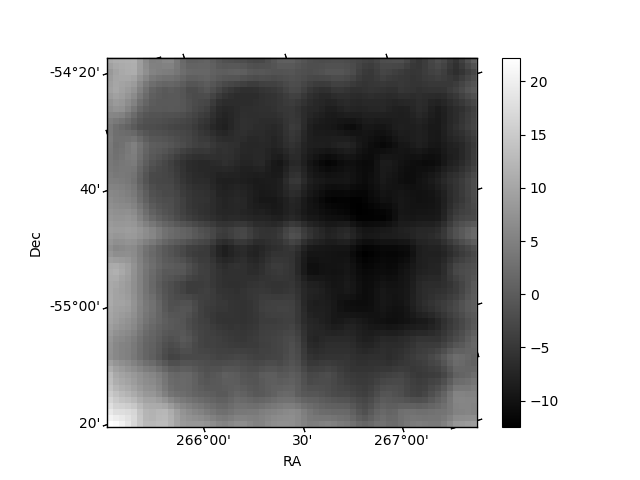
Quadrant B |
|---|---|---|---|
| Quadrant D | 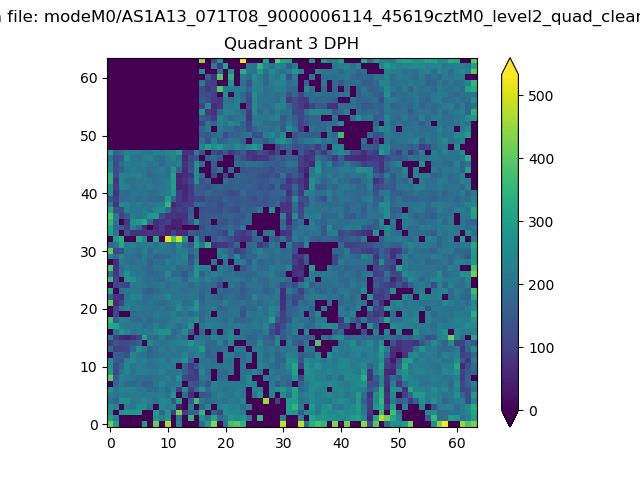 |
 |
Quadrant C |
| Plot type | Count rate plots | Images |
|---|---|---|
| Comparison with Poisson distribution Blue bars denote a histogram of data divided into 1 sec bins. Red curve is a Poisson curve with rate = median count rate of data. |
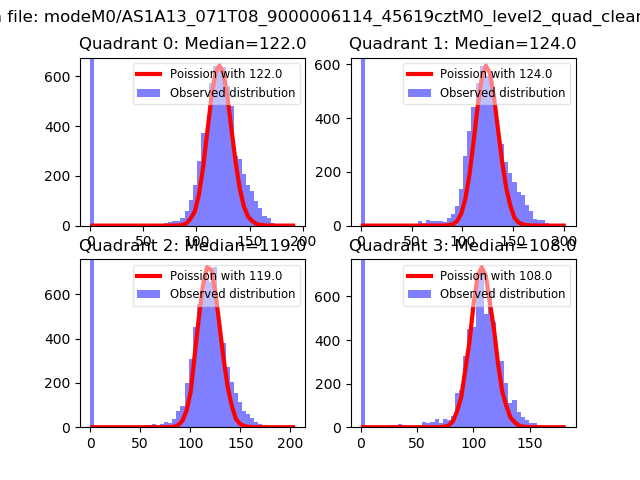 |
 |
| Quadrant-wise count rates Data is divided into 100 sec bins |
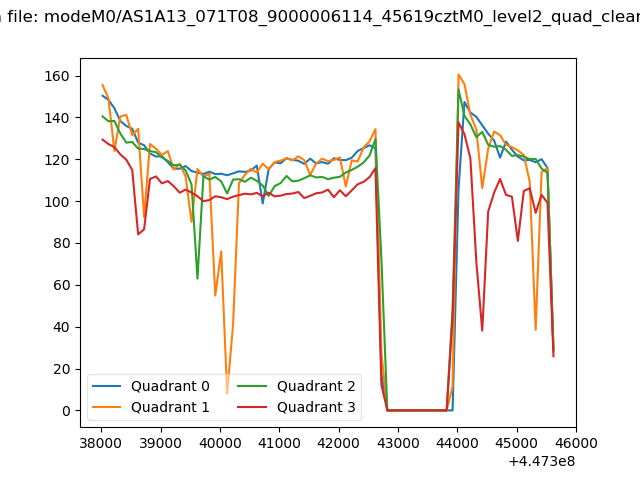 |
|
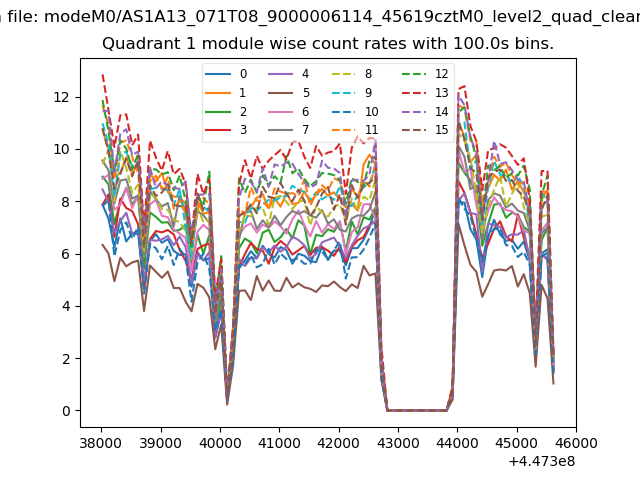
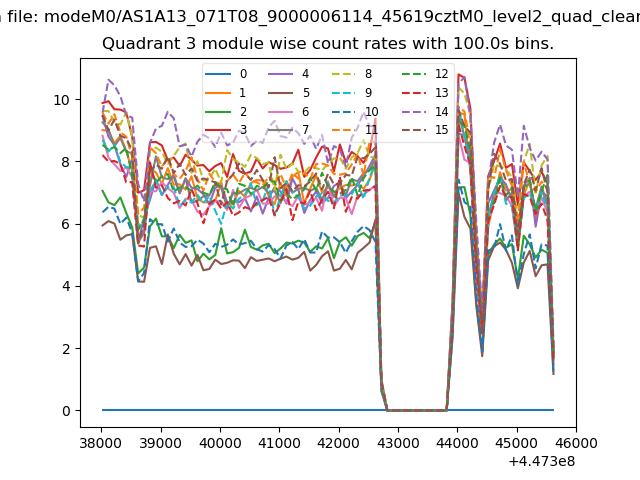
| Module-wise count rates for Quadrant A Data is divided into 100 sec bins |
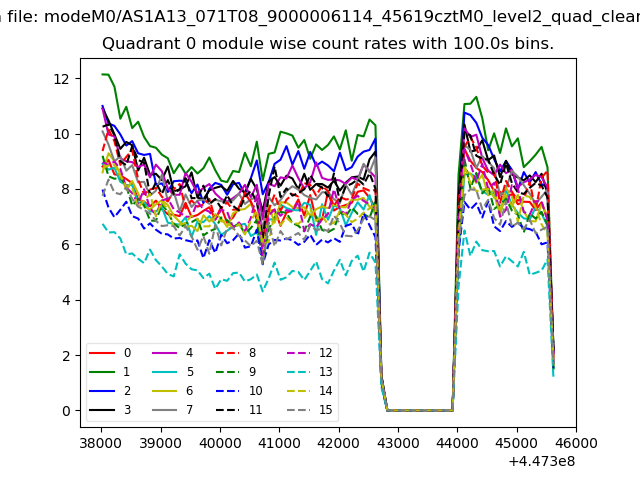 |
 |
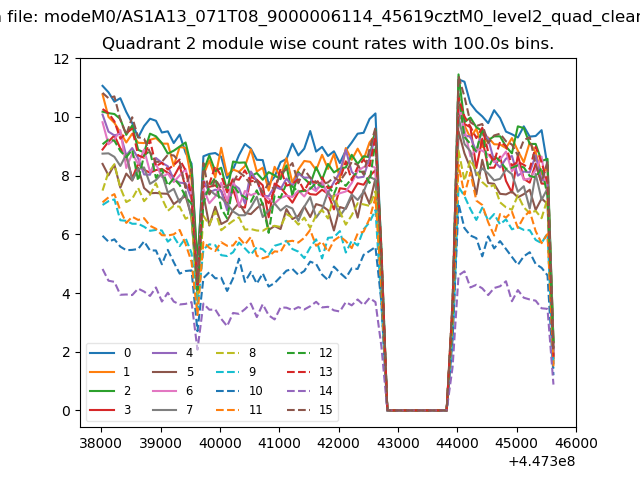
| Module-wise count rates for Quadrant B Data is divided into 100 sec bins |
 |
 |
| Module-wise count rates for Quadrant C Data is divided into 100 sec bins |
 |
 |
| Module-wise count rates for Quadrant D Data is divided into 100 sec bins |
 |
 |
| Parameter | Plot |
|---|---|
| CZT HV Monitor | 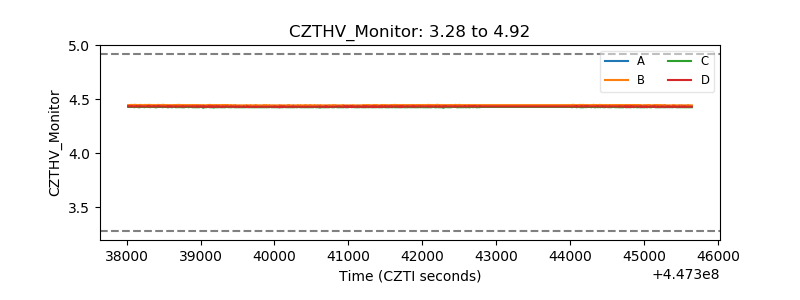 |
| D_VDD | 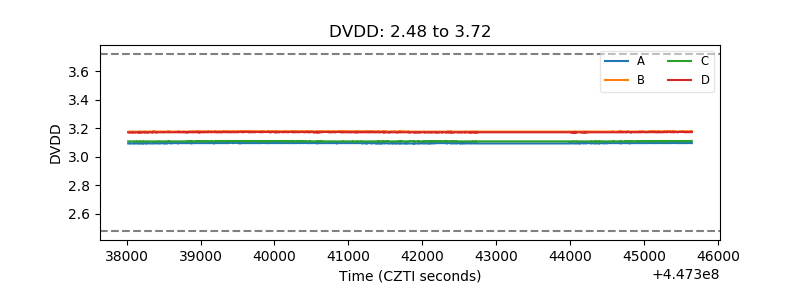 |
| Temperature 1 | 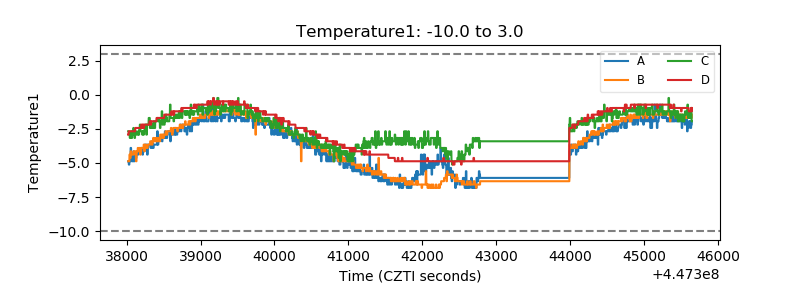 |
| Veto HV Monitor | 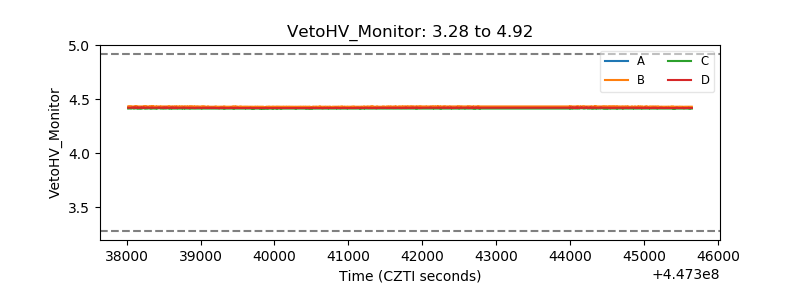 |
| Veto LLD | 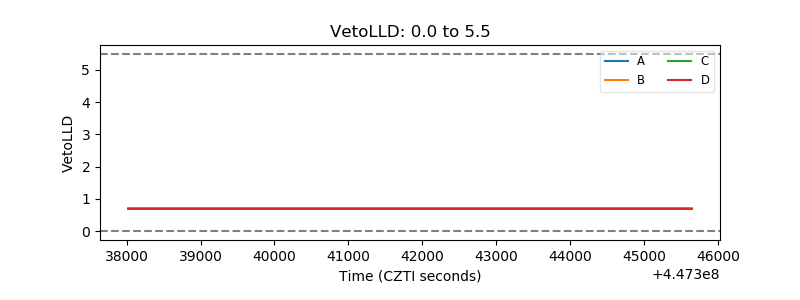 |
| Alpha Counter | 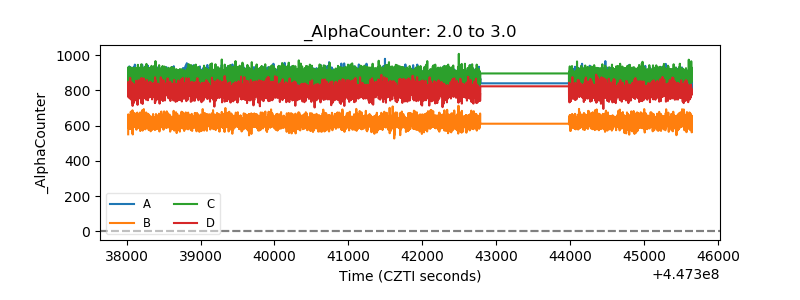 |
| _CPM_Rate | 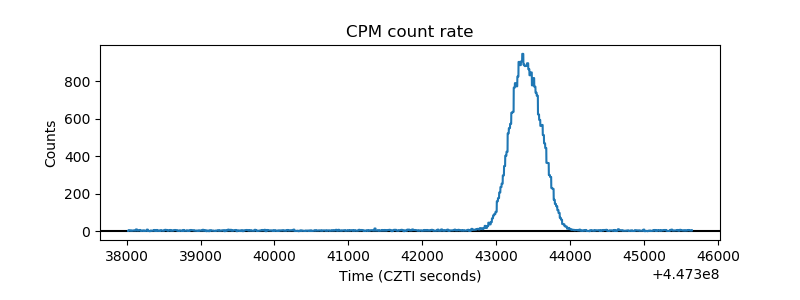 |
| CZT Counter | 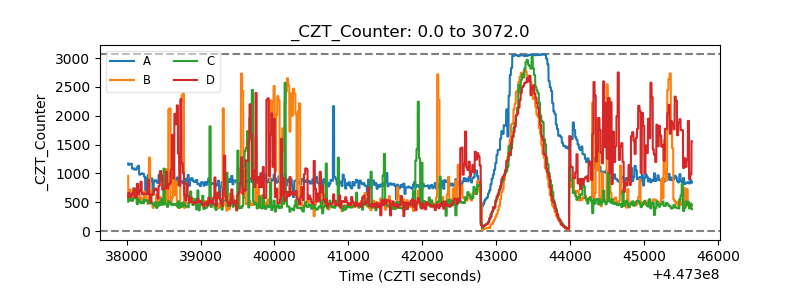 |
| +2.5 Volts monitor | 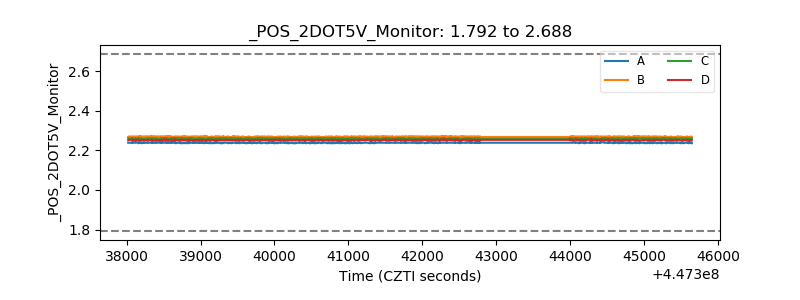 |
| +5 Volts monitor | 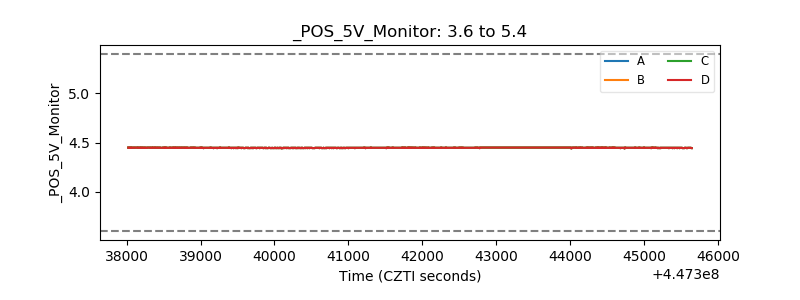 |
| _ROLL_ROT | 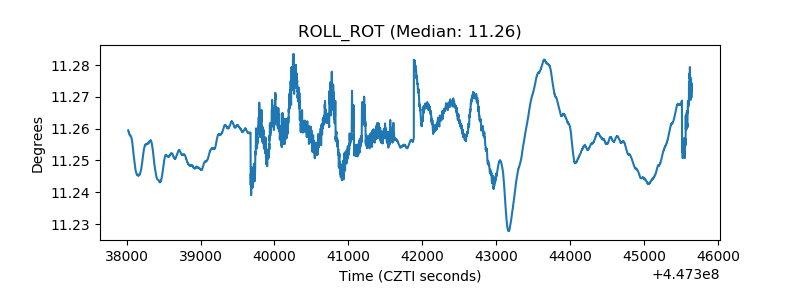 |
| _Roll_DEC | 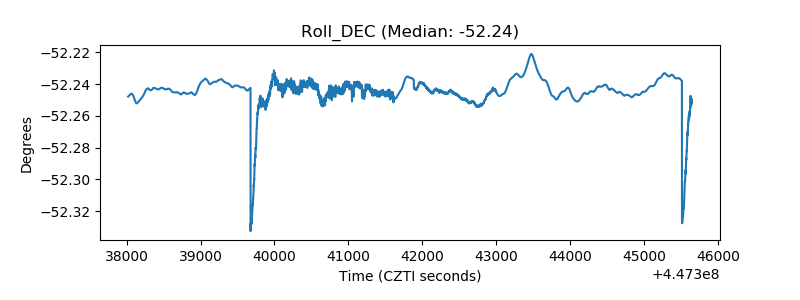 |
| _Roll_RA | 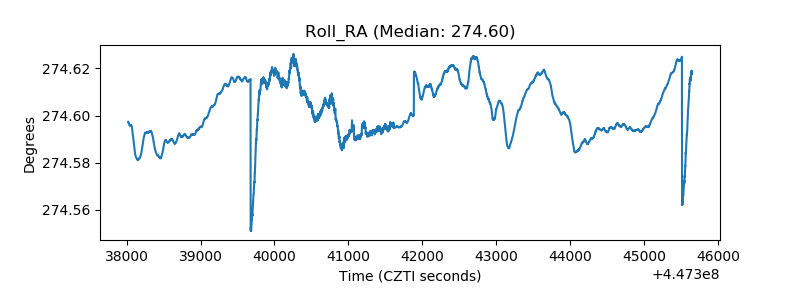 |
| Veto Counter | 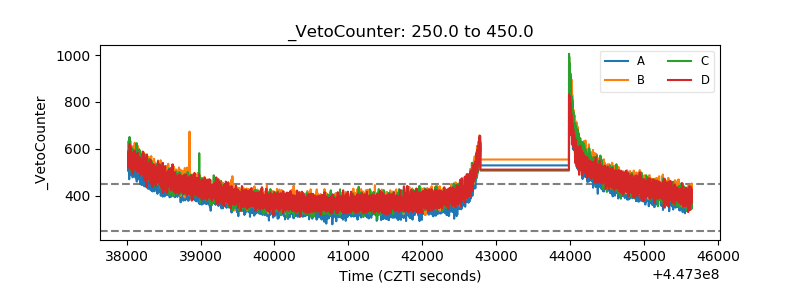 |