| Param | Original file | Final file |
|---|---|---|
| Filename | modeM0/AS1A13_071T08_9000006114_45622cztM0_level2.fits | modeM0/AS1A13_071T08_9000006114_45622cztM0_level2_quad_clean.evt |
| Size (bytes) | 695,566,080 | 107,899,200 |
| Size | 663.3 MB | 102.9 MB |
| Events in quadrant A | 6,426,736 | 763,261 |
| Events in quadrant B | 4,559,952 | 765,177 |
| Events in quadrant C | 3,514,728 | 766,495 |
| Events in quadrant D | 10,689,324 | 471,713 |
| Mode M9 | |||
|---|---|---|---|
| Quadrant | BADHDUFLAG | Total packets | Discarded packets |
| A | 0 | 6 | 0 |
| B | 0 | 7 | 0 |
| C | 0 | 7 | 0 |
| D | 0 | 7 | 0 |
| Mode M0 | |||
|---|---|---|---|
| Quadrant | BADHDUFLAG | Total packets | Discarded packets |
| A | 0 | 24093 | 2 |
| B | 0 | 18458 | 2 |
| C | 0 | 15777 | 2 |
| D | 0 | 36646 | 2 |
| Mode SS | |||
|---|---|---|---|
| Quadrant | BADHDUFLAG | Total packets | Discarded packets |
| A | 0 | 146 | 0 |
| B | 0 | 146 | 0 |
| C | 0 | 146 | 0 |
| D | 0 | 146 | 0 |
| Quadrant | Total seconds | Saturated seconds | Saturation percentage |
|---|---|---|---|
| A | 7183 | 360 | 5.011833% |
| B | 7183 | 569 | 7.921481% |
| C | 7183 | 122 | 1.698455% |
| D | 7182 | 2664 | 37.092732% |
Noise dominated data is calculated using 1-second bins in cleaned event files. If a bin has >2000 counts, and if more than 50% of those come from <1% of pixels, then it is considered to be noise-dominated and hence unusable.
| Quadrant | # 1 sec bins | Bins with >0 counts | Bins with >2000 counts | High rate bins dominated by noise | Noise dominated (total time) | Noise dominated (detector-on time) | Marked lightcurve |
|---|---|---|---|---|---|---|---|
| A | 7803 | 7184 | 8 | 8 | 0.10% | 0.11% | 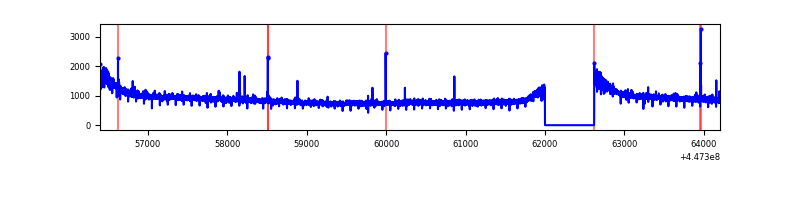 |
| B | 7803 | 7184 | 265 | 265 | 3.40% | 3.69% | 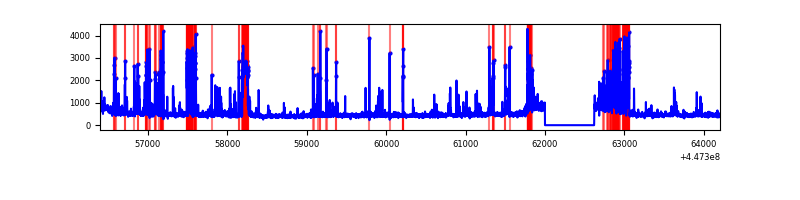 |
| C | 7803 | 7184 | 47 | 47 | 0.60% | 0.65% | 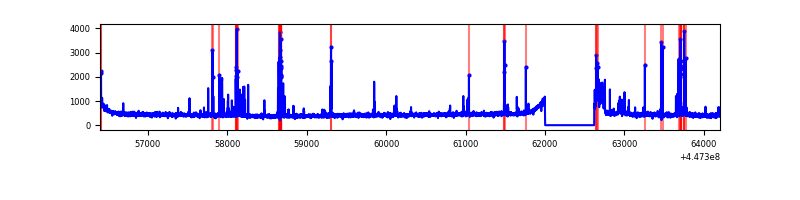 |
| D | 7802 | 7183 | 2417 | 2417 | 30.98% | 33.65% | 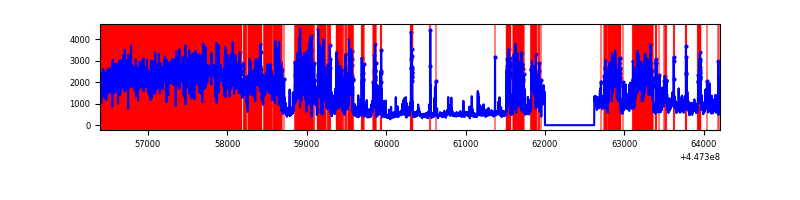 |
Top three noisy pixels from each quadrant. If the there are fewer than three noisy pixels in the level2.evt file, extra rows are filled as -1
| Pixel properties | Quadrant properties | ||||||
|---|---|---|---|---|---|---|---|
| Quadrant | DetID | PixID | Counts | Sigma | Mean | Median | Sigma |
| A | 10 | 83 | 3205373 | 18943.02 | 814 | 797 | 169.2 |
| A | 0 | 243 | 23035 | 131.45 | 814 | 797 | 169.2 |
| A | 10 | 255 | 18340 | 103.7 | 814 | 797 | 169.2 |
| B | 3 | 112 | 394181 | 2482.92 | 802 | 776 | 158.4 |
| B | 5 | 172 | 319180 | 2009.56 | 802 | 776 | 158.4 |
| B | 4 | 171 | 288524 | 1816.08 | 802 | 776 | 158.4 |
| C | 14 | 254 | 267895 | 1419.6 | 797 | 798 | 188.1 |
| C | 0 | 207 | 98108 | 517.2 | 797 | 798 | 188.1 |
| C | 2 | 14 | 23206 | 119.1 | 797 | 798 | 188.1 |
| D | 11 | 241 | 3479393 | 19877.41 | 689 | 668 | 175.0 |
| D | 8 | 48 | 1829505 | 10449.96 | 689 | 668 | 175.0 |
| D | 8 | 129 | 1204884 | 6880.88 | 689 | 668 | 175.0 |
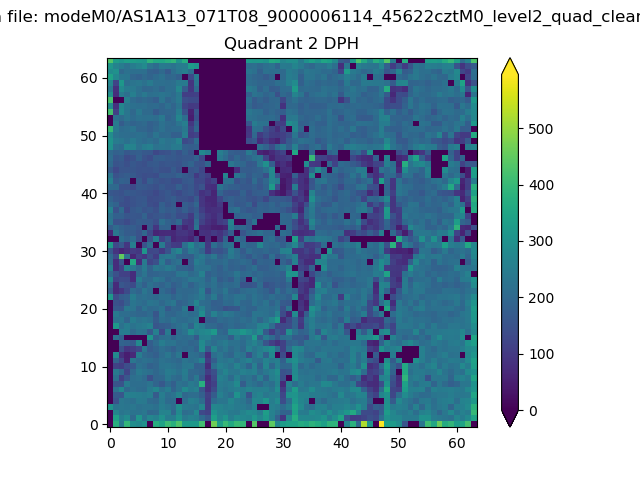
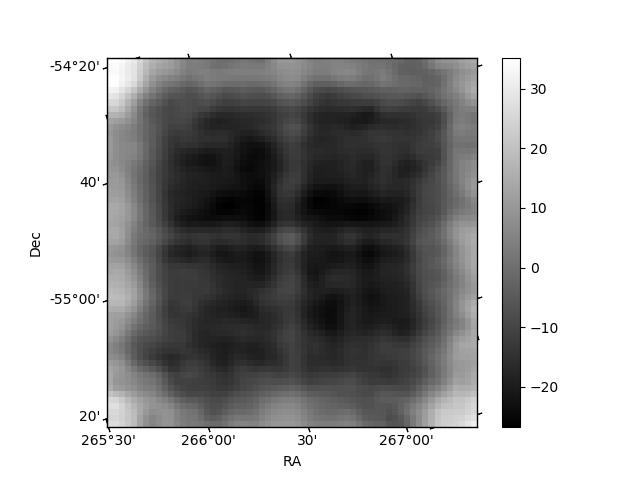
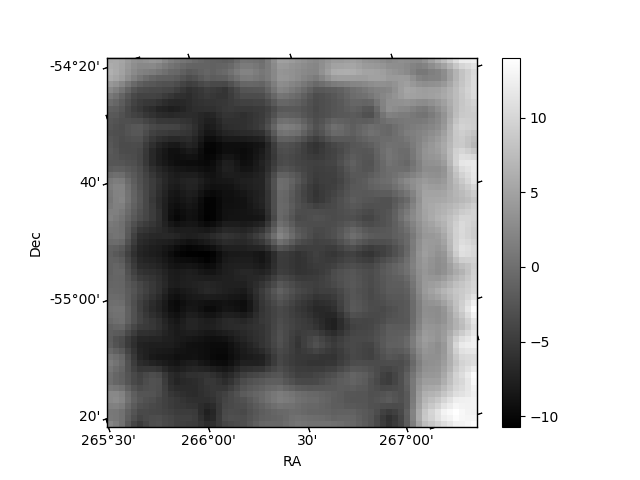
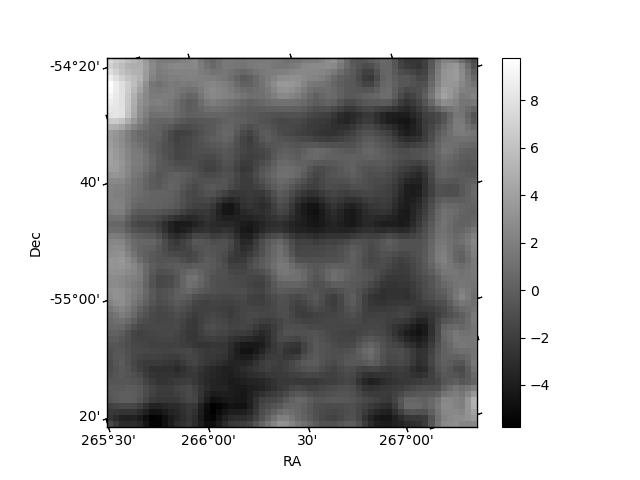
Histogram calculated using DETX and DETY for each event in the final _common_clean file
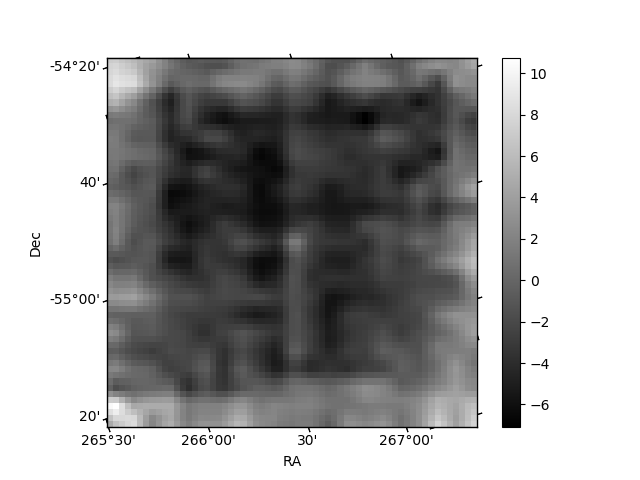
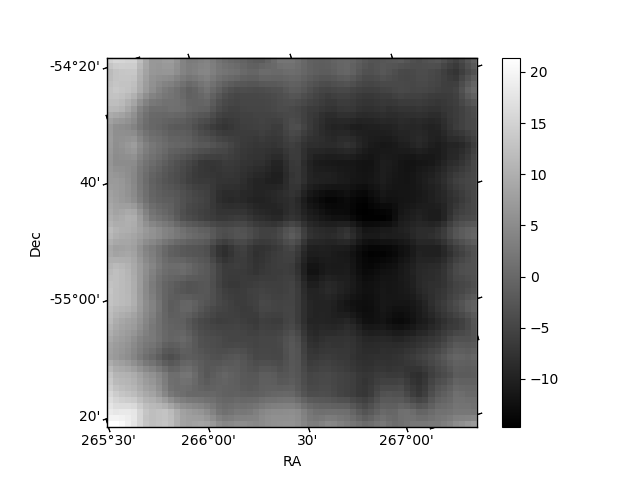
| Quadrant A | 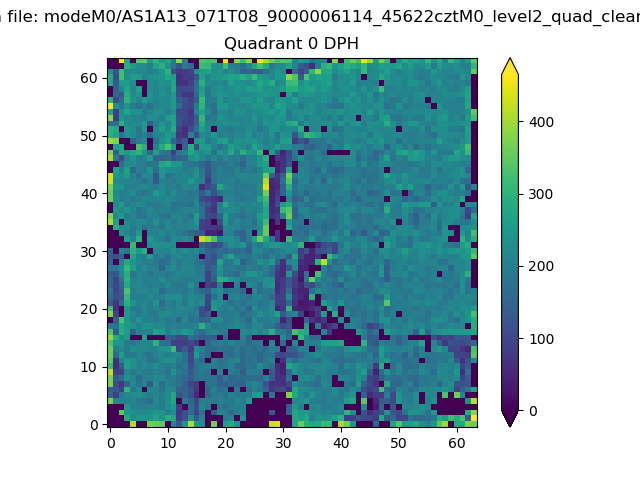 |
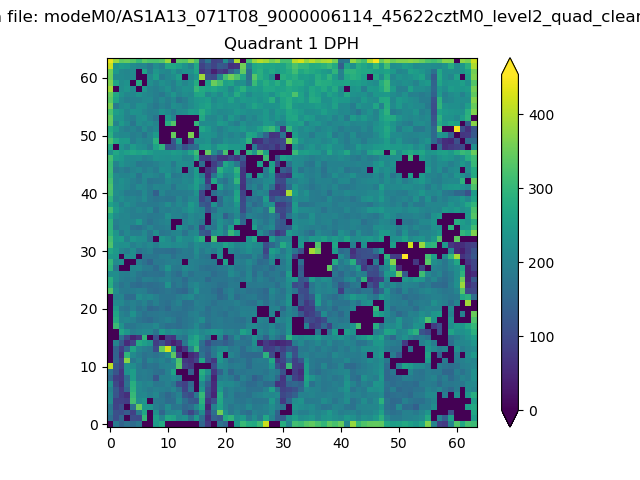 |
Quadrant B |
|---|---|---|---|
| Quadrant D | 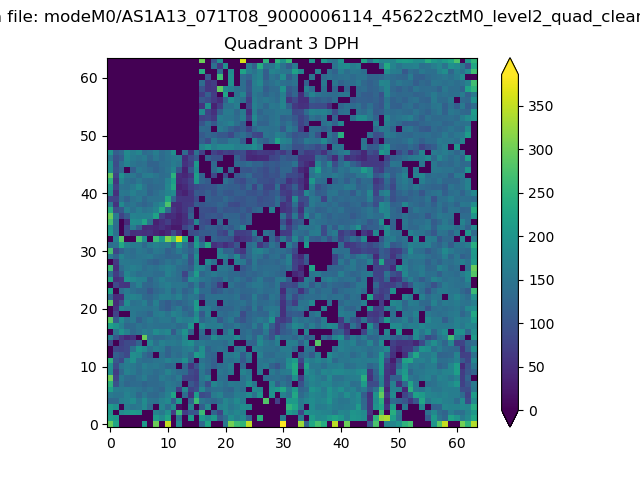 |
 |
Quadrant C |
| Plot type | Count rate plots | Images |
|---|---|---|
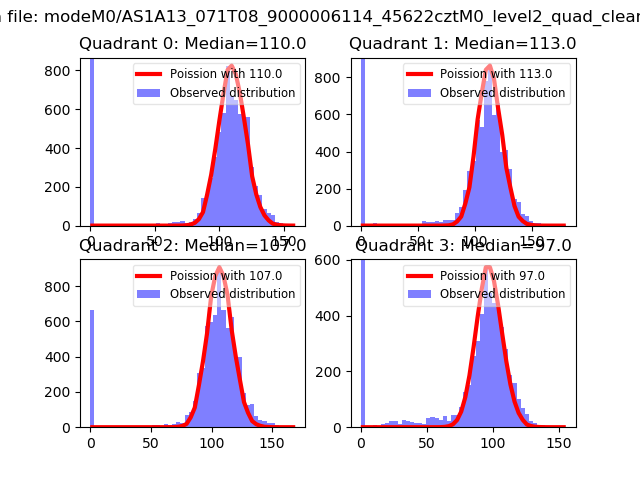
| Comparison with Poisson distribution Blue bars denote a histogram of data divided into 1 sec bins. Red curve is a Poisson curve with rate = median count rate of data. |
 |
 |
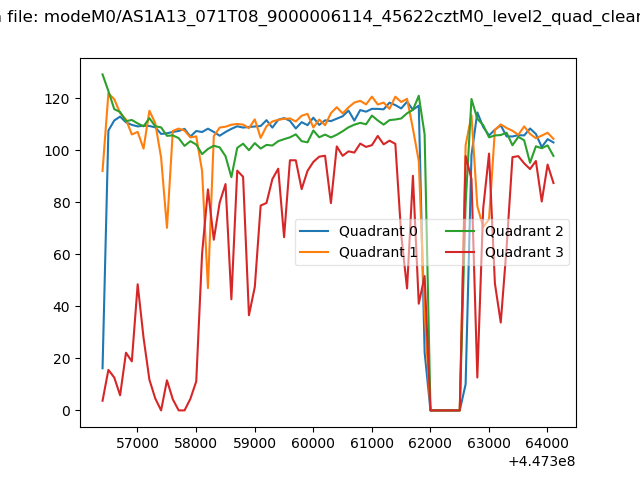
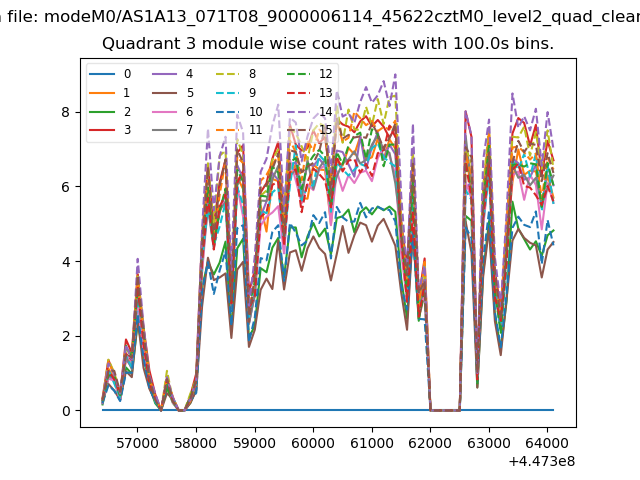
| Quadrant-wise count rates Data is divided into 100 sec bins |
 |
|
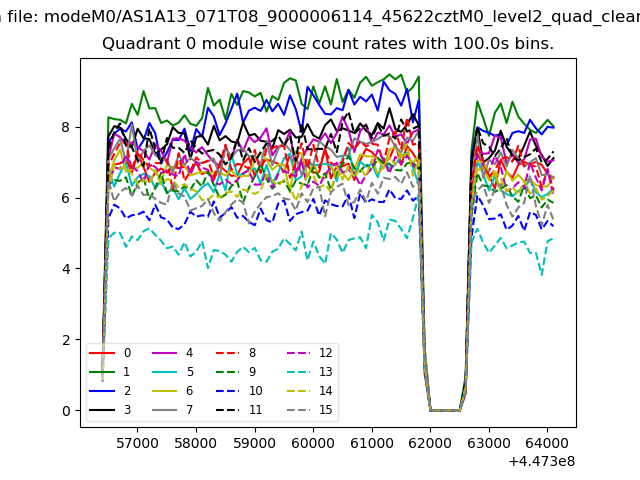
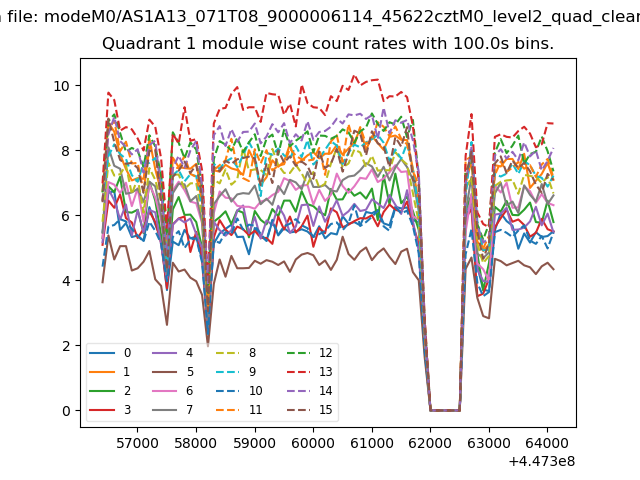
| Module-wise count rates for Quadrant A Data is divided into 100 sec bins |
 |
 |
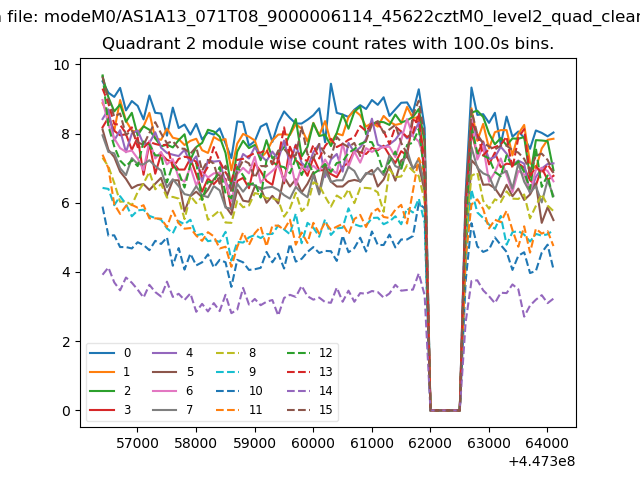
| Module-wise count rates for Quadrant B Data is divided into 100 sec bins |
 |
 |
| Module-wise count rates for Quadrant C Data is divided into 100 sec bins |
 |
 |
| Module-wise count rates for Quadrant D Data is divided into 100 sec bins |
 |
 |
| Parameter | Plot |
|---|---|
| CZT HV Monitor | 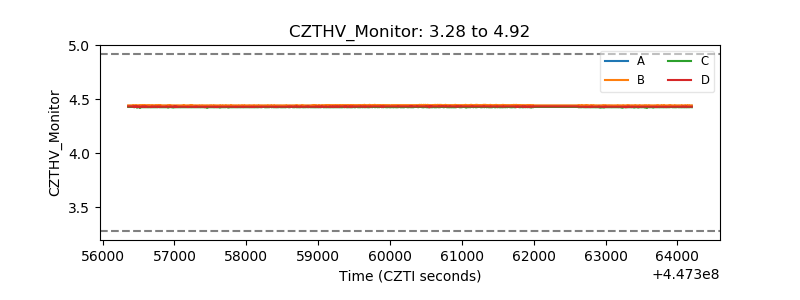 |
| D_VDD | 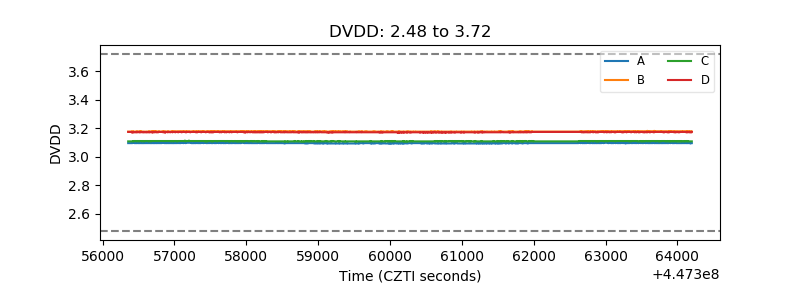 |
| Temperature 1 | 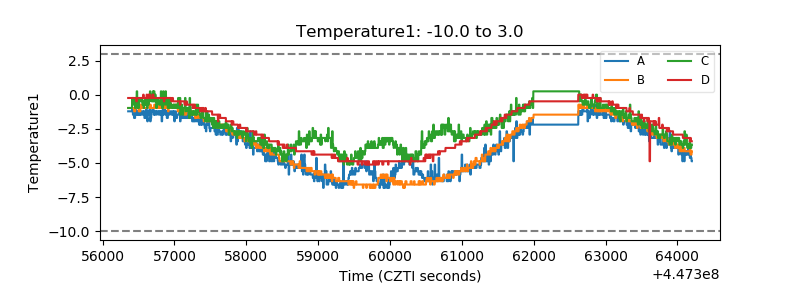 |
| Veto HV Monitor | 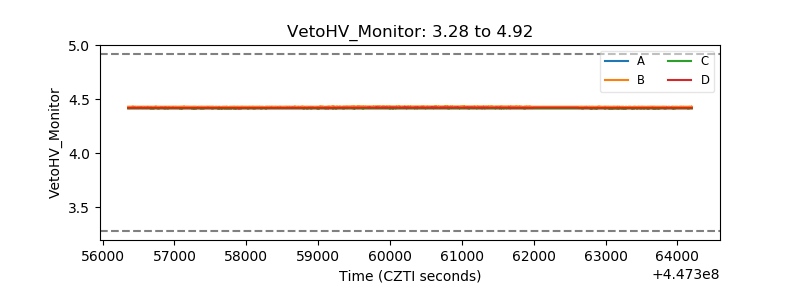 |
| Veto LLD | 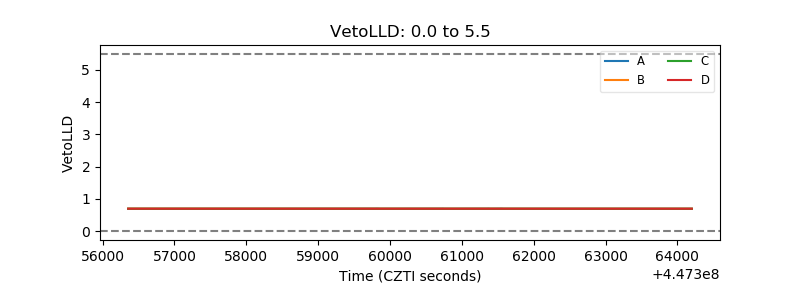 |
| Alpha Counter |  |
| _CPM_Rate | 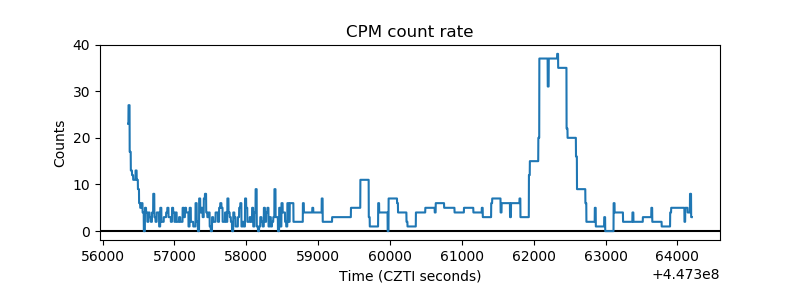 |
| CZT Counter | 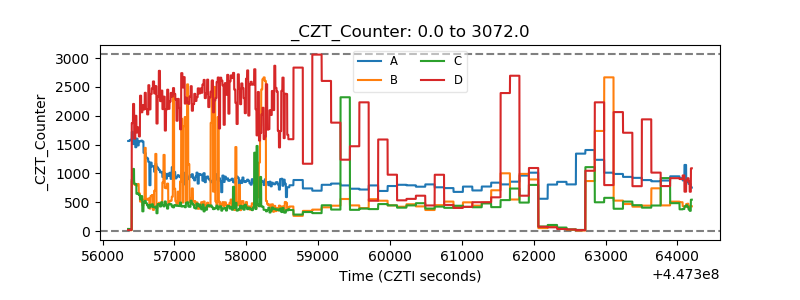 |
| +2.5 Volts monitor | 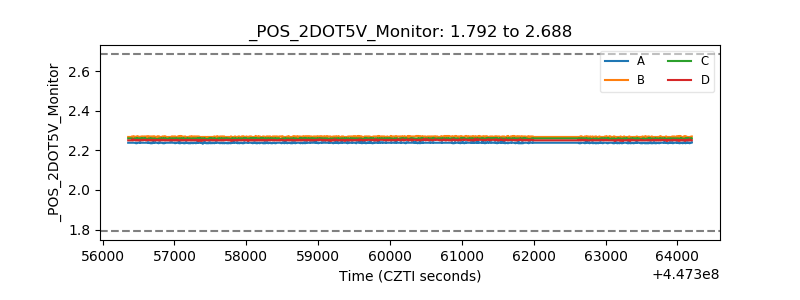 |
| +5 Volts monitor |  |
| _ROLL_ROT | 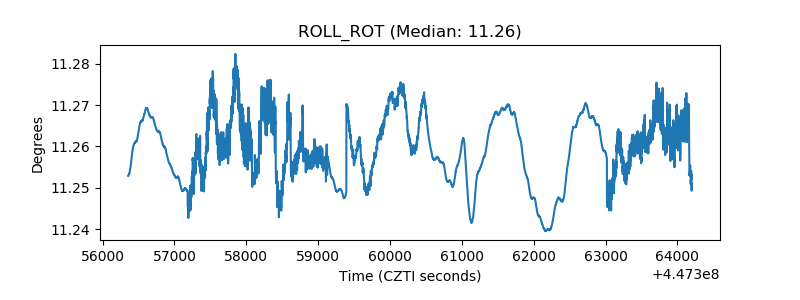 |
| _Roll_DEC | 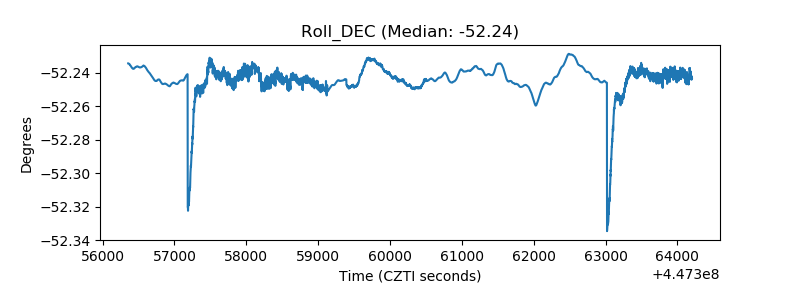 |
| _Roll_RA | 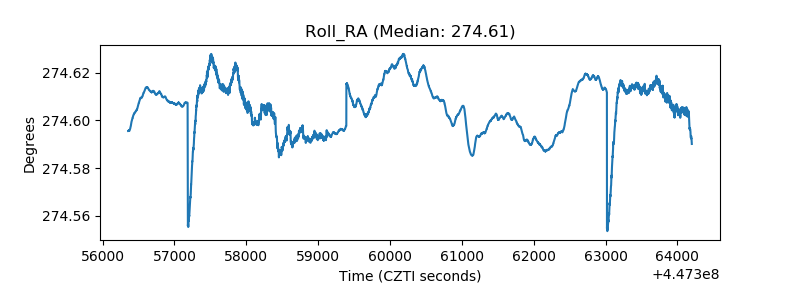 |
| Veto Counter | 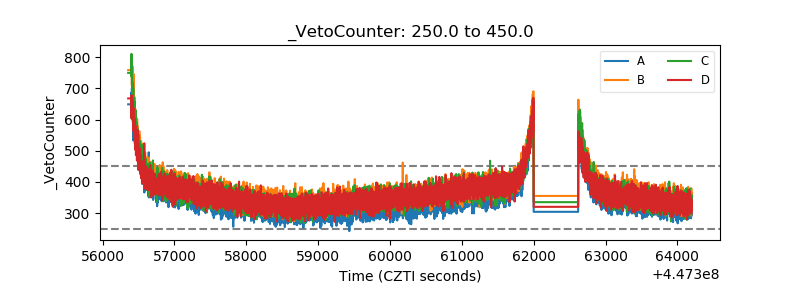 |