| Param | Original file | Final file |
|---|---|---|
| Filename | modeM0/AS1A13_071T08_9000006114_45624cztM0_level2.fits | modeM0/AS1A13_071T08_9000006114_45624cztM0_level2_quad_clean.evt |
| Size (bytes) | 745,208,640 | 123,935,040 |
| Size | 710.7 MB | 118.2 MB |
| Events in quadrant A | 7,027,185 | 866,435 |
| Events in quadrant B | 5,463,032 | 809,433 |
| Events in quadrant C | 3,866,386 | 845,521 |
| Events in quadrant D | 10,605,613 | 670,383 |
| Mode M0 | |||
|---|---|---|---|
| Quadrant | BADHDUFLAG | Total packets | Discarded packets |
| A | 0 | 26421 | 0 |
| B | 0 | 21835 | 0 |
| C | 0 | 17388 | 0 |
| D | 0 | 37154 | 2 |
| Mode SS | |||
|---|---|---|---|
| Quadrant | BADHDUFLAG | Total packets | Discarded packets |
| A | 0 | 162 | 0 |
| B | 0 | 162 | 0 |
| C | 0 | 162 | 0 |
| D | 0 | 162 | 0 |
| Quadrant | Total seconds | Saturated seconds | Saturation percentage |
|---|---|---|---|
| A | 8060 | 201 | 2.493797% |
| B | 8060 | 821 | 10.186104% |
| C | 8060 | 66 | 0.818859% |
| D | 8060 | 1339 | 16.612903% |
Noise dominated data is calculated using 1-second bins in cleaned event files. If a bin has >2000 counts, and if more than 50% of those come from <1% of pixels, then it is considered to be noise-dominated and hence unusable.
| Quadrant | # 1 sec bins | Bins with >0 counts | Bins with >2000 counts | High rate bins dominated by noise | Noise dominated (total time) | Noise dominated (detector-on time) | Marked lightcurve |
|---|---|---|---|---|---|---|---|
| A | 8060 | 8060 | 29 | 29 | 0.36% | 0.36% | 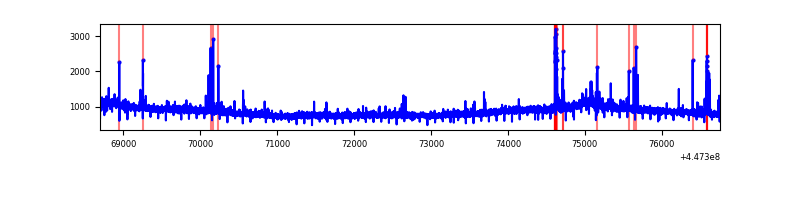 |
| B | 8060 | 8060 | 386 | 386 | 4.79% | 4.79% | 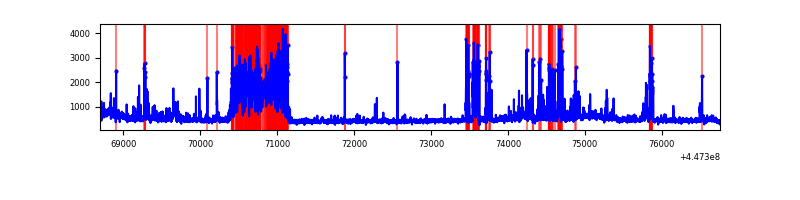 |
| C | 8060 | 8060 | 48 | 48 | 0.60% | 0.60% | 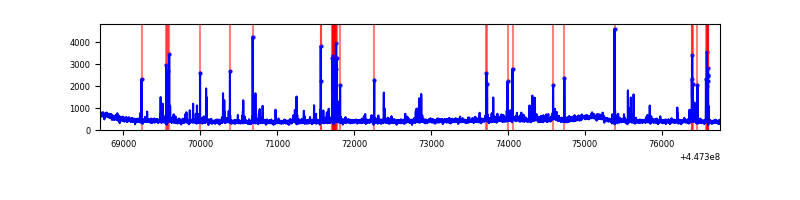 |
| D | 8060 | 8060 | 1185 | 1185 | 14.70% | 14.70% | 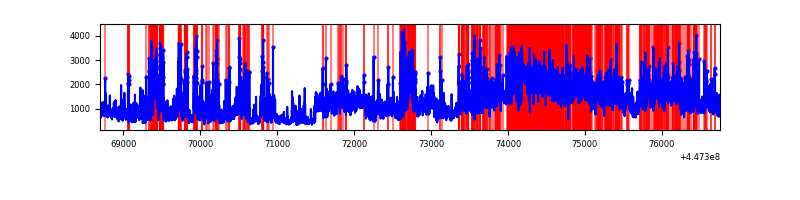 |
Top three noisy pixels from each quadrant. If the there are fewer than three noisy pixels in the level2.evt file, extra rows are filled as -1
| Pixel properties | Quadrant properties | ||||||
|---|---|---|---|---|---|---|---|
| Quadrant | DetID | PixID | Counts | Sigma | Mean | Median | Sigma |
| A | 10 | 83 | 3322323 | 17545.7 | 904 | 884 | 189.3 |
| A | 14 | 235 | 64543 | 336.28 | 904 | 884 | 189.3 |
| A | 13 | 248 | 52417 | 272.23 | 904 | 884 | 189.3 |
| B | 12 | 18 | 1150115 | 6783.25 | 869 | 844 | 169.4 |
| B | 5 | 172 | 468625 | 2760.95 | 869 | 844 | 169.4 |
| B | 3 | 112 | 98306 | 575.24 | 869 | 844 | 169.4 |
| C | 14 | 254 | 283328 | 1366.06 | 879 | 882 | 206.8 |
| C | 3 | 233 | 81855 | 391.63 | 879 | 882 | 206.8 |
| C | 2 | 14 | 30857 | 144.98 | 879 | 882 | 206.8 |
| D | 11 | 241 | 4425842 | 20964.67 | 837 | 808 | 211.1 |
| D | 8 | 129 | 1203796 | 5699.45 | 837 | 808 | 211.1 |
| D | 8 | 48 | 493461 | 2334.06 | 837 | 808 | 211.1 |
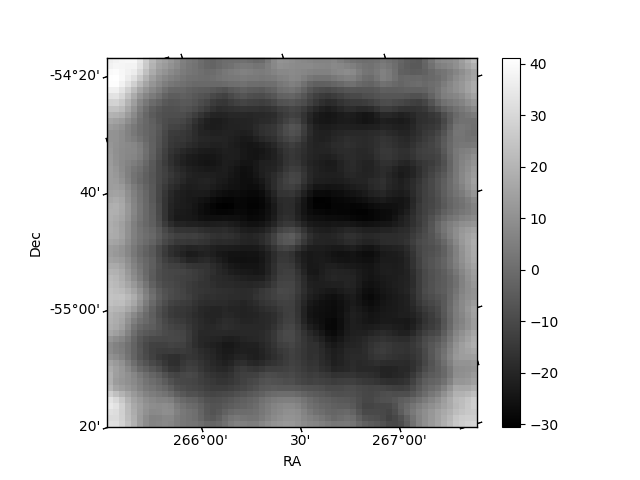
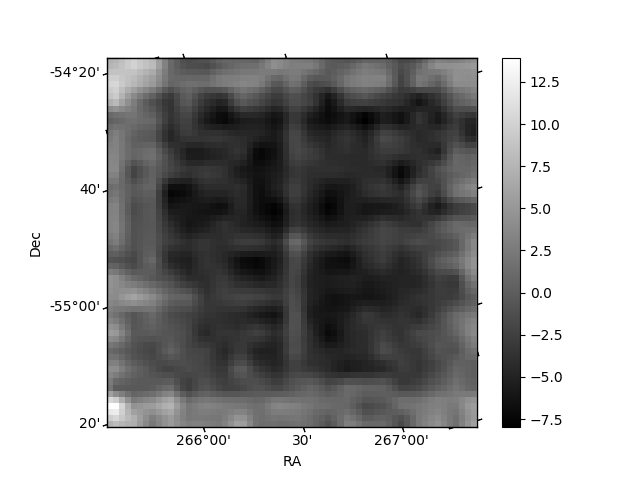
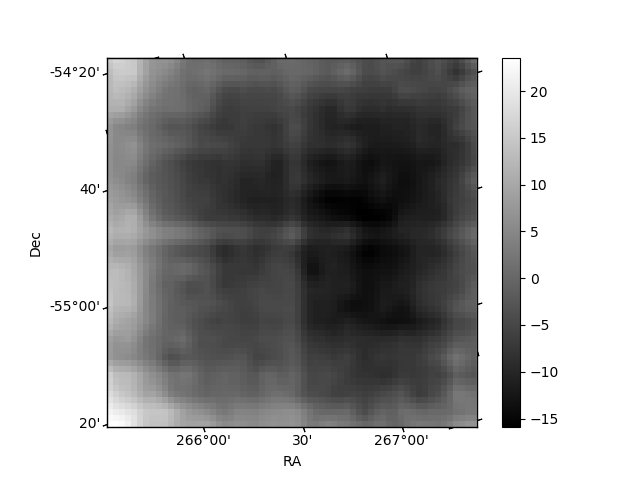
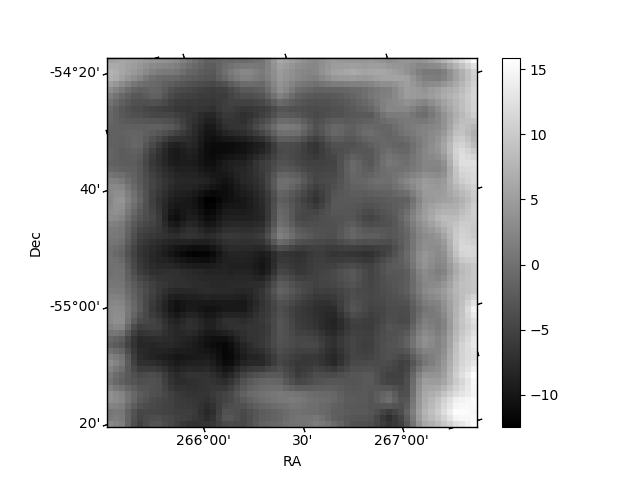
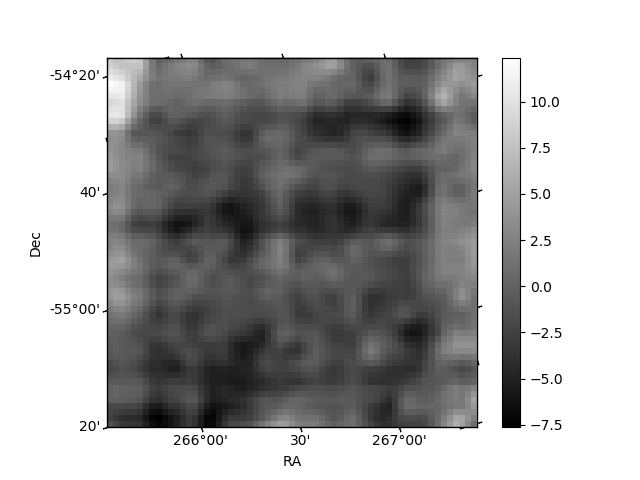
Histogram calculated using DETX and DETY for each event in the final _common_clean file
| Quadrant A | 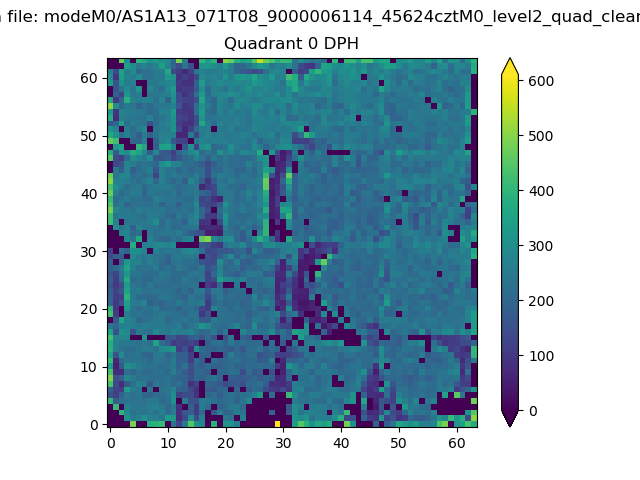 |
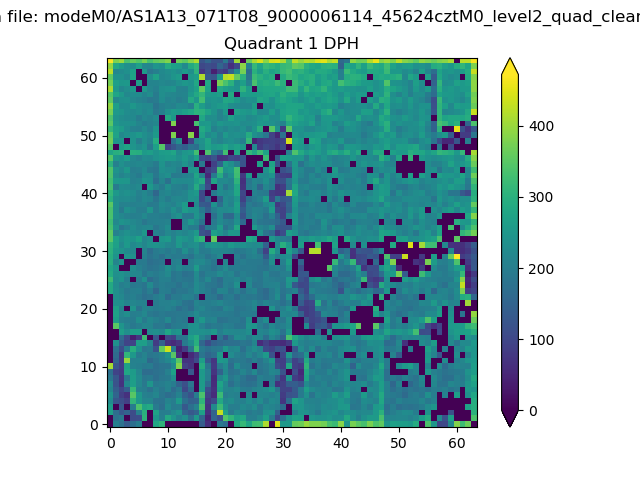 |
Quadrant B |
|---|---|---|---|
| Quadrant D | 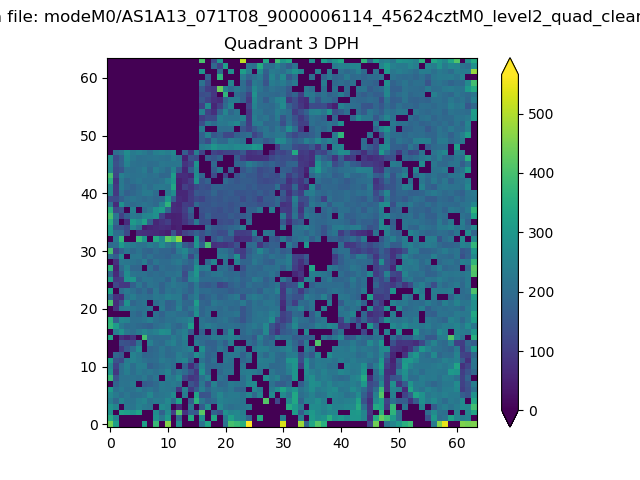 |
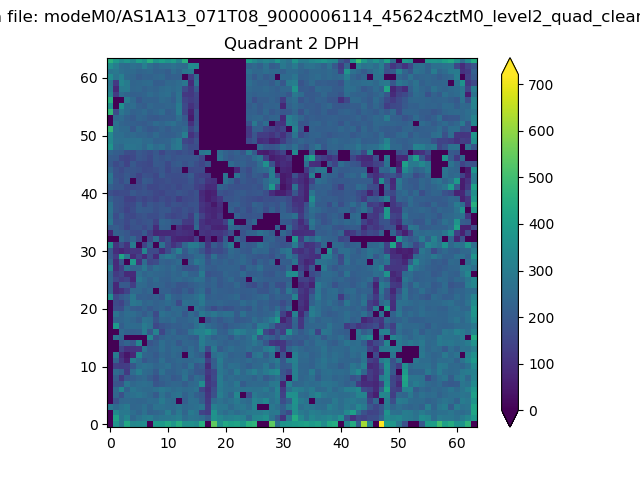 |
Quadrant C |
| Plot type | Count rate plots | Images |
|---|---|---|
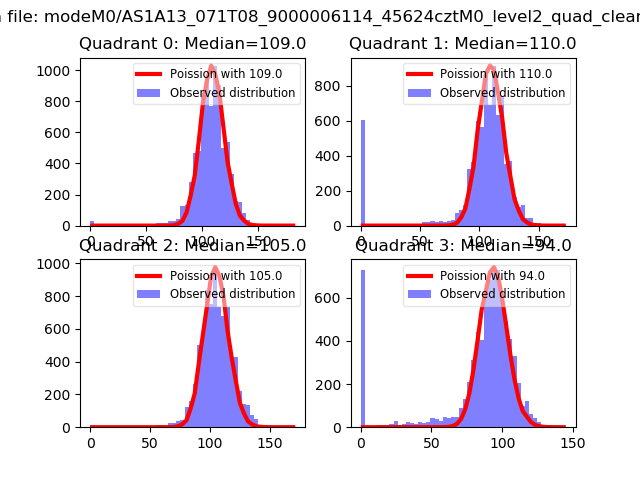
| Comparison with Poisson distribution Blue bars denote a histogram of data divided into 1 sec bins. Red curve is a Poisson curve with rate = median count rate of data. |
 |
 |
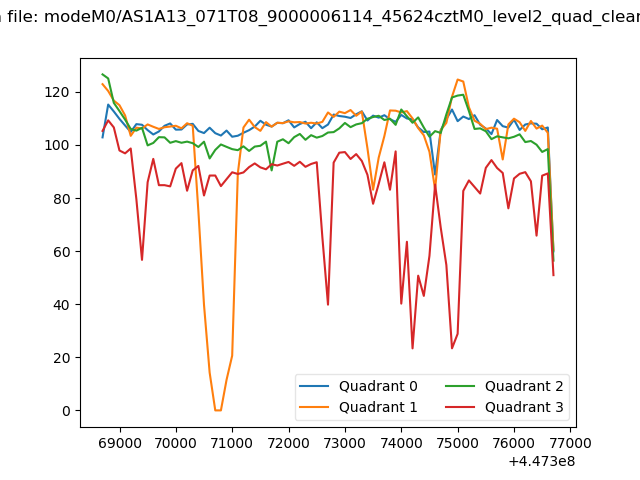
| Quadrant-wise count rates Data is divided into 100 sec bins |
 |
|
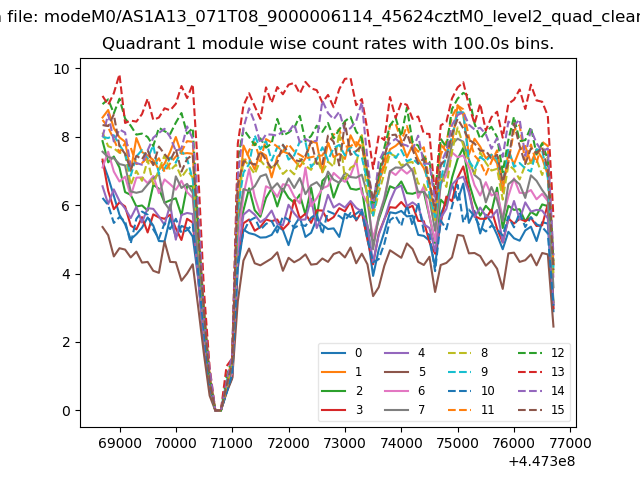
| Module-wise count rates for Quadrant A Data is divided into 100 sec bins |
 |
 |
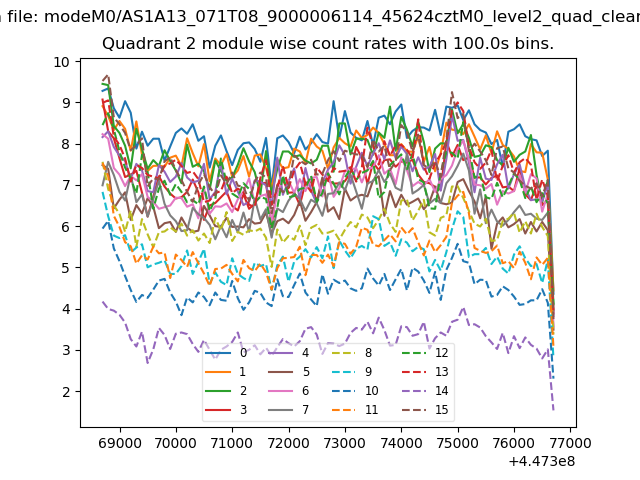
| Module-wise count rates for Quadrant B Data is divided into 100 sec bins |
 |
 |
| Module-wise count rates for Quadrant C Data is divided into 100 sec bins |
 |
 |
| Module-wise count rates for Quadrant D Data is divided into 100 sec bins |
 |
 |
| Parameter | Plot |
|---|---|
| CZT HV Monitor | 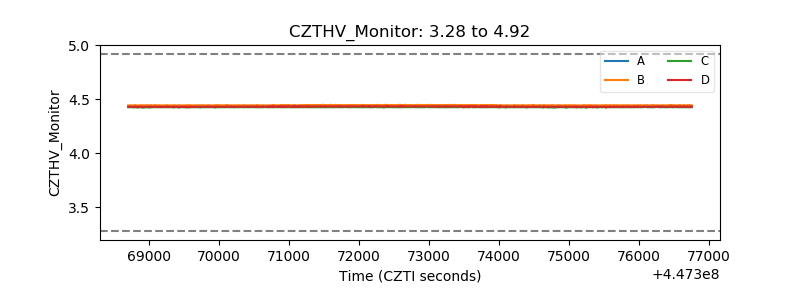 |
| D_VDD | 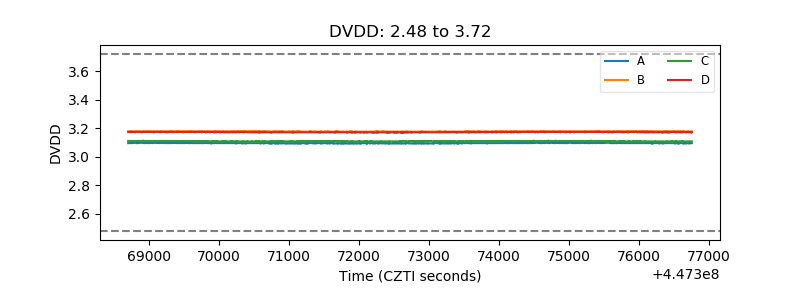 |
| Temperature 1 | 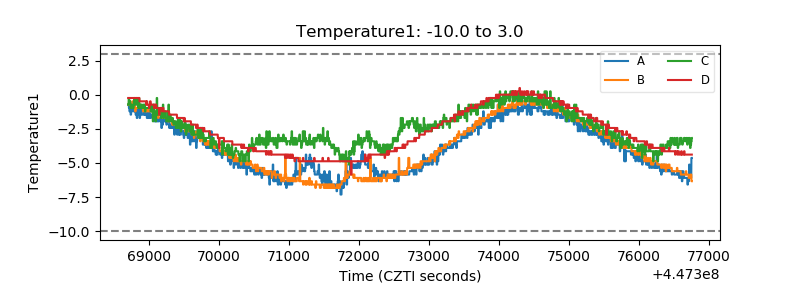 |
| Veto HV Monitor | 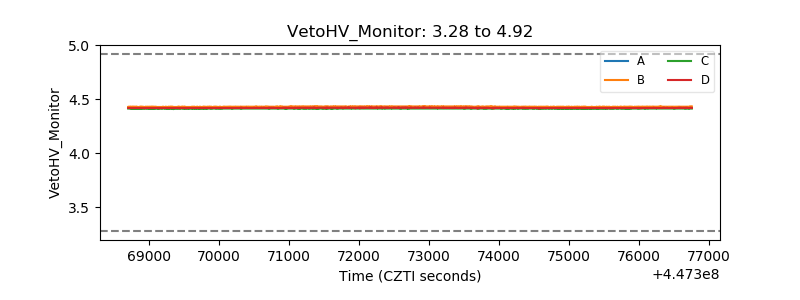 |
| Veto LLD | 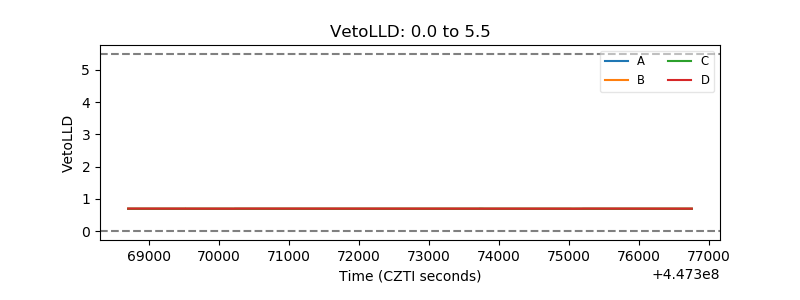 |
| Alpha Counter | 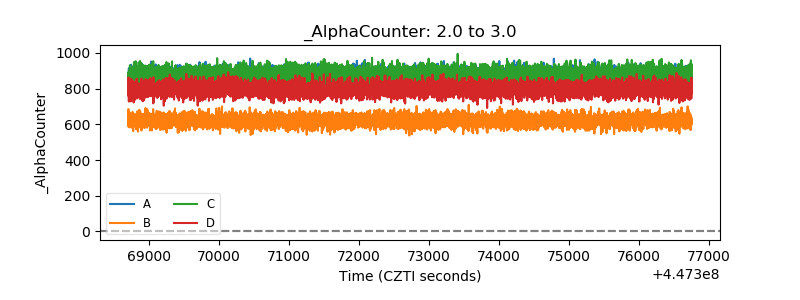 |
| _CPM_Rate | 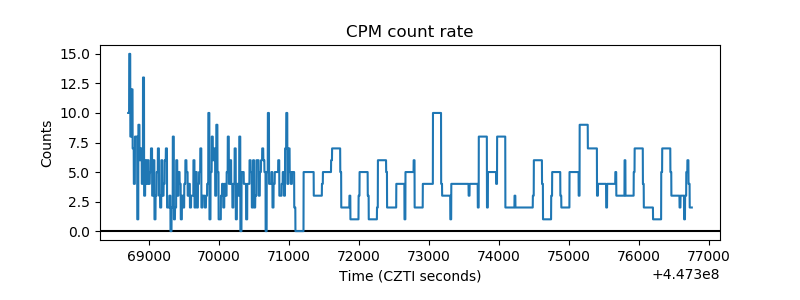 |
| CZT Counter | 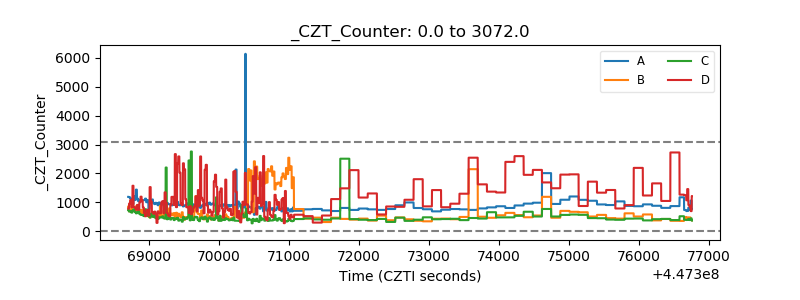 |
| +2.5 Volts monitor | 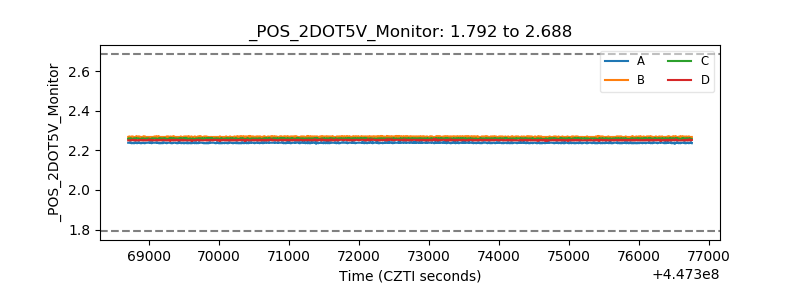 |
| +5 Volts monitor | 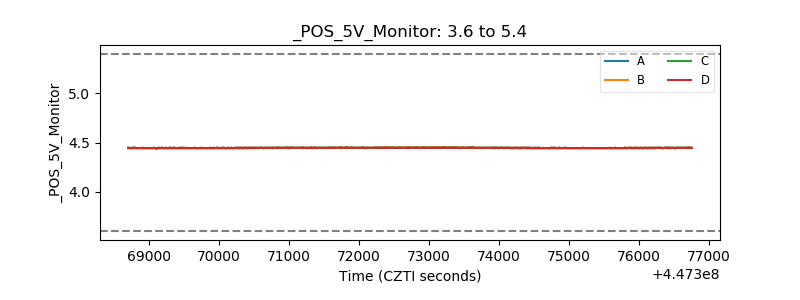 |
| _ROLL_ROT | 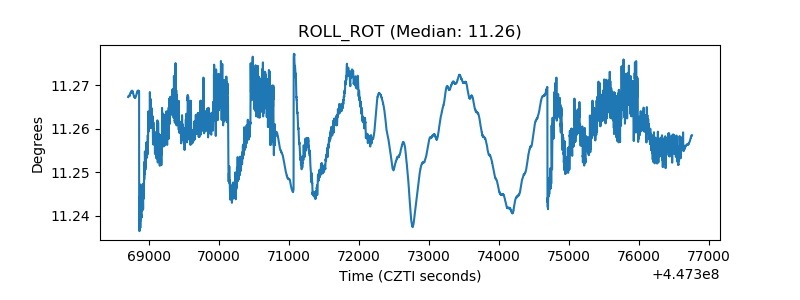 |
| _Roll_DEC | 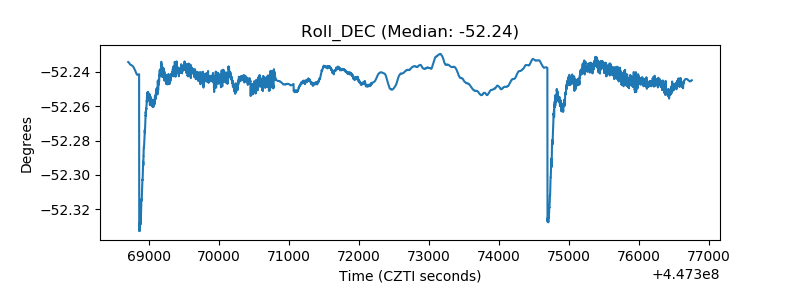 |
| _Roll_RA | 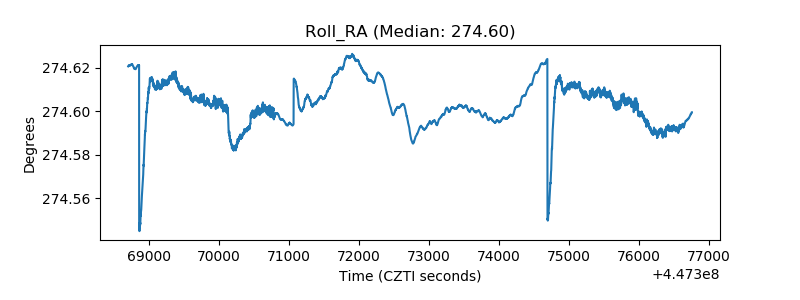 |
| Veto Counter | 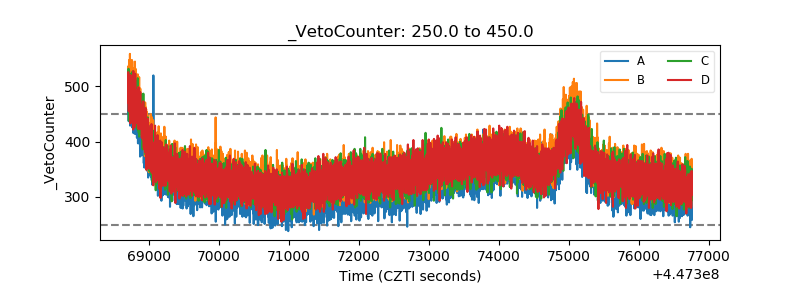 |