| Param | Original file | Final file |
|---|---|---|
| Filename | modeM0/AS1A13_071T08_9000006114_45625cztM0_level2.fits | modeM0/AS1A13_071T08_9000006114_45625cztM0_level2_quad_clean.evt |
| Size (bytes) | 770,880,960 | 126,512,640 |
| Size | 735.2 MB | 120.7 MB |
| Events in quadrant A | 7,204,612 | 873,004 |
| Events in quadrant B | 4,874,551 | 882,976 |
| Events in quadrant C | 4,146,746 | 841,467 |
| Events in quadrant D | 11,678,846 | 665,102 |
| Mode M0 | |||
|---|---|---|---|
| Quadrant | BADHDUFLAG | Total packets | Discarded packets |
| A | 0 | 27065 | 0 |
| B | 0 | 20201 | 0 |
| C | 0 | 18365 | 0 |
| D | 0 | 40426 | 0 |
| Mode SS | |||
|---|---|---|---|
| Quadrant | BADHDUFLAG | Total packets | Discarded packets |
| A | 0 | 164 | 0 |
| B | 0 | 164 | 0 |
| C | 0 | 164 | 0 |
| D | 0 | 164 | 0 |
| Quadrant | Total seconds | Saturated seconds | Saturation percentage |
|---|---|---|---|
| A | 8164 | 236 | 2.890740% |
| B | 8165 | 337 | 4.127373% |
| C | 8165 | 185 | 2.265769% |
| D | 8165 | 1563 | 19.142682% |
Noise dominated data is calculated using 1-second bins in cleaned event files. If a bin has >2000 counts, and if more than 50% of those come from <1% of pixels, then it is considered to be noise-dominated and hence unusable.
| Quadrant | # 1 sec bins | Bins with >0 counts | Bins with >2000 counts | High rate bins dominated by noise | Noise dominated (total time) | Noise dominated (detector-on time) | Marked lightcurve |
|---|---|---|---|---|---|---|---|
| A | 8164 | 8164 | 36 | 36 | 0.44% | 0.44% | 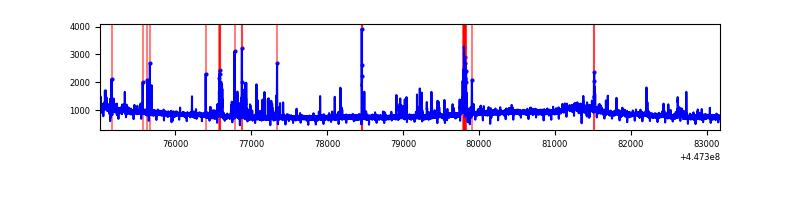 |
| B | 8165 | 8165 | 193 | 193 | 2.36% | 2.36% | 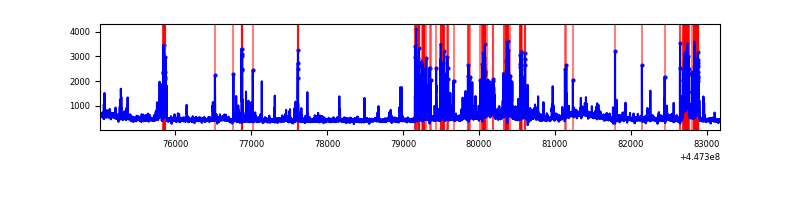 |
| C | 8165 | 8165 | 126 | 126 | 1.54% | 1.54% | 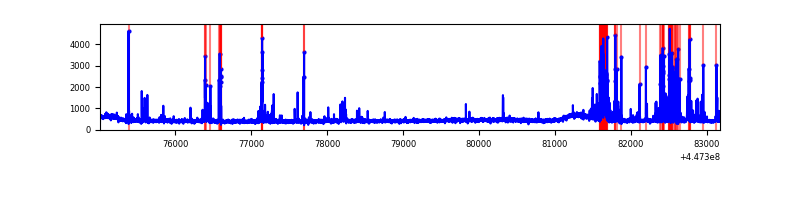 |
| D | 8165 | 8165 | 1314 | 1314 | 16.09% | 16.09% | 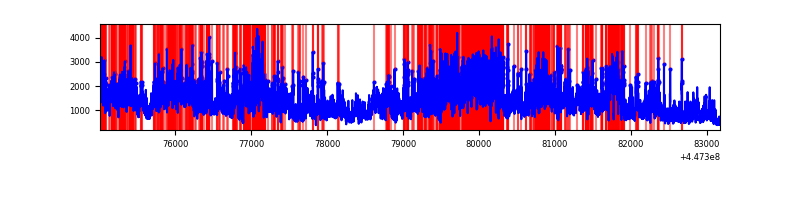 |
Top three noisy pixels from each quadrant. If the there are fewer than three noisy pixels in the level2.evt file, extra rows are filled as -1
| Pixel properties | Quadrant properties | ||||||
|---|---|---|---|---|---|---|---|
| Quadrant | DetID | PixID | Counts | Sigma | Mean | Median | Sigma |
| A | 10 | 83 | 3302752 | 17369.65 | 911 | 891 | 190.1 |
| A | 14 | 235 | 279834 | 1467.4 | 911 | 891 | 190.1 |
| A | 10 | 248 | 43222 | 222.68 | 911 | 891 | 190.1 |
| B | 5 | 172 | 657363 | 3702.1 | 905 | 877 | 177.3 |
| B | 12 | 18 | 136622 | 765.5 | 905 | 877 | 177.3 |
| B | 4 | 170 | 124757 | 698.59 | 905 | 877 | 177.3 |
| C | 14 | 254 | 619550 | 2941.55 | 888 | 891 | 210.3 |
| C | 2 | 14 | 23005 | 105.15 | 888 | 891 | 210.3 |
| C | 3 | 233 | 21701 | 98.95 | 888 | 891 | 210.3 |
| D | 11 | 241 | 6183204 | 28885.87 | 841 | 811 | 214.0 |
| D | 8 | 129 | 927808 | 4331.19 | 841 | 811 | 214.0 |
| D | 13 | 249 | 353984 | 1650.12 | 841 | 811 | 214.0 |
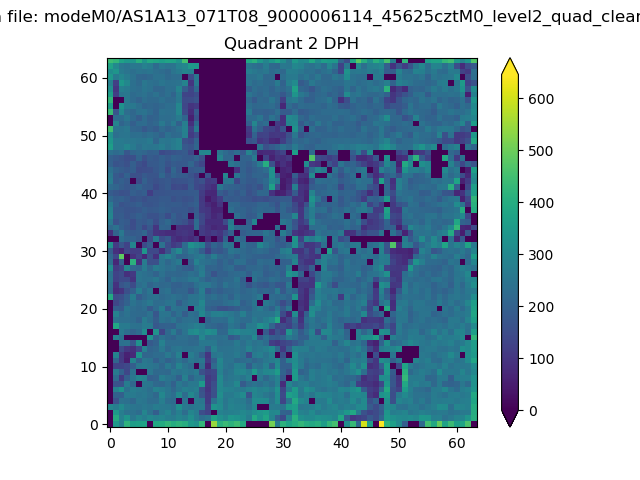
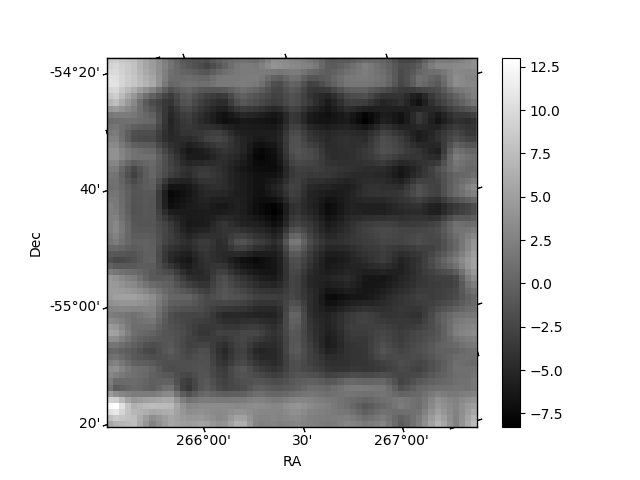
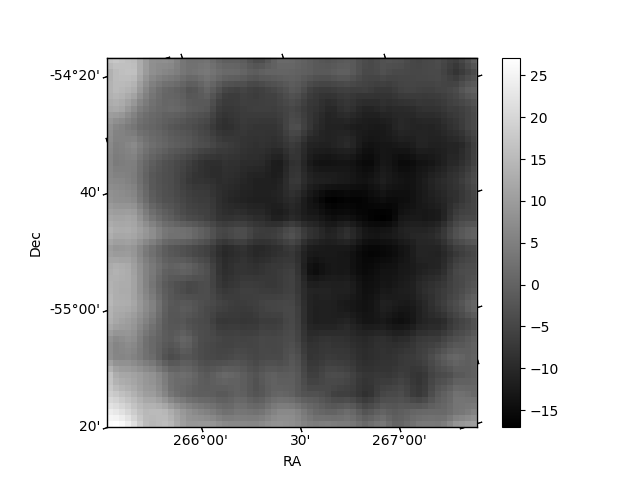
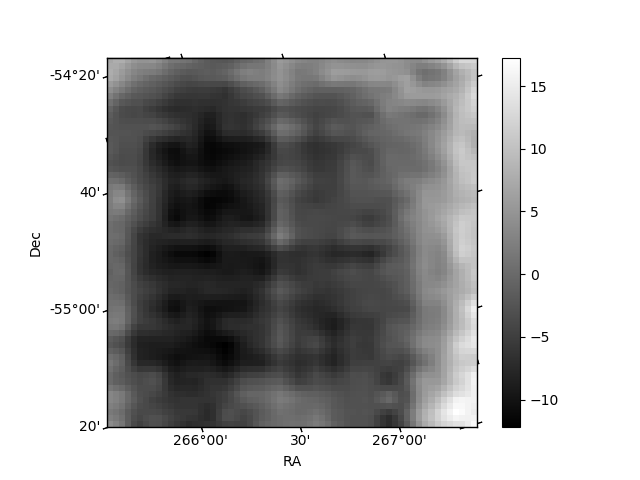
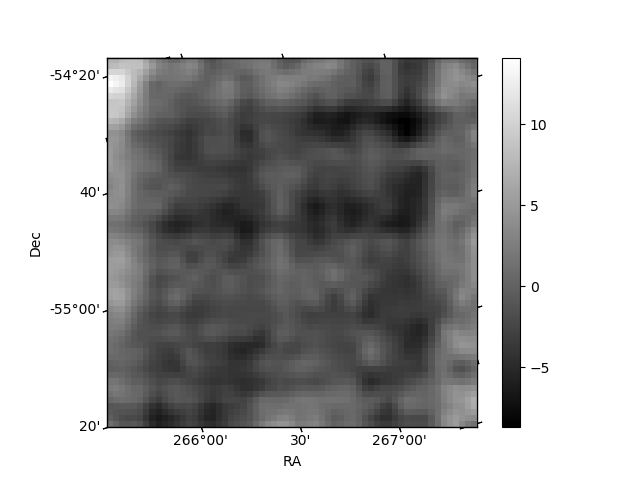
Histogram calculated using DETX and DETY for each event in the final _common_clean file
| Quadrant A | 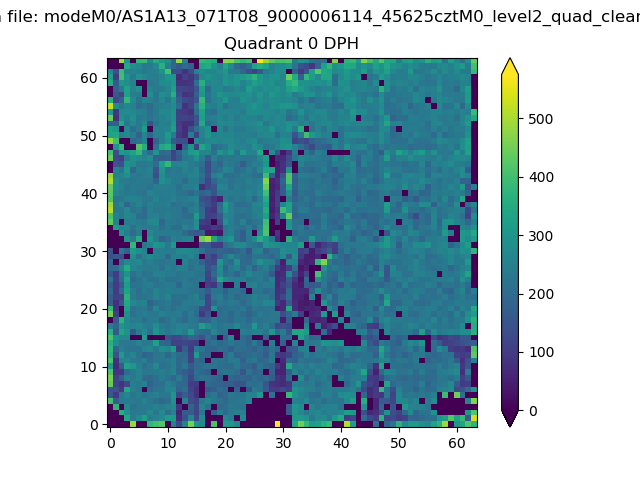 |
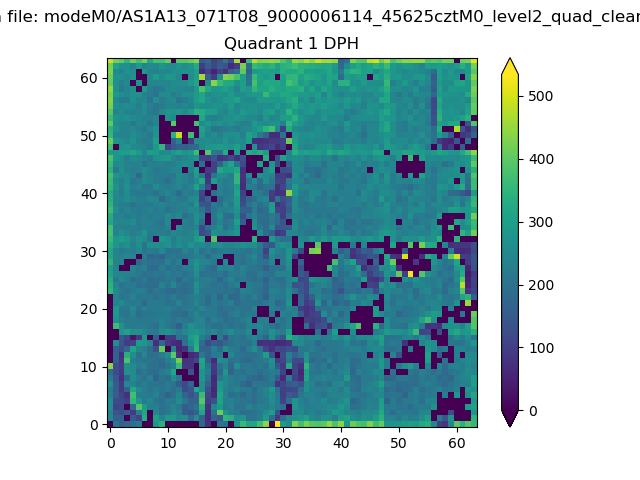 |
Quadrant B |
|---|---|---|---|
| Quadrant D | 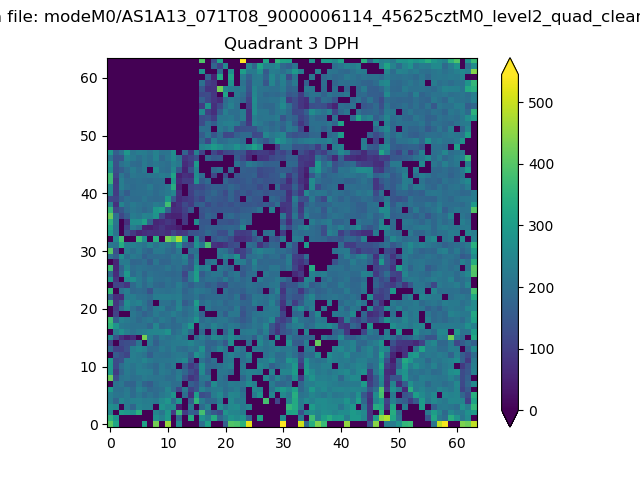 |
 |
Quadrant C |
| Plot type | Count rate plots | Images |
|---|---|---|
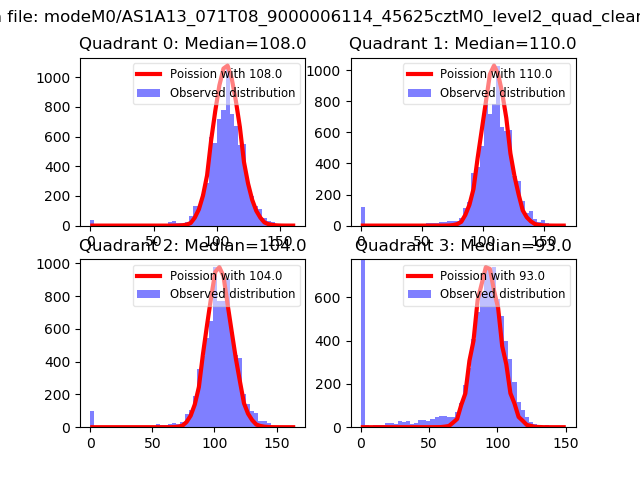
| Comparison with Poisson distribution Blue bars denote a histogram of data divided into 1 sec bins. Red curve is a Poisson curve with rate = median count rate of data. |
 |
 |
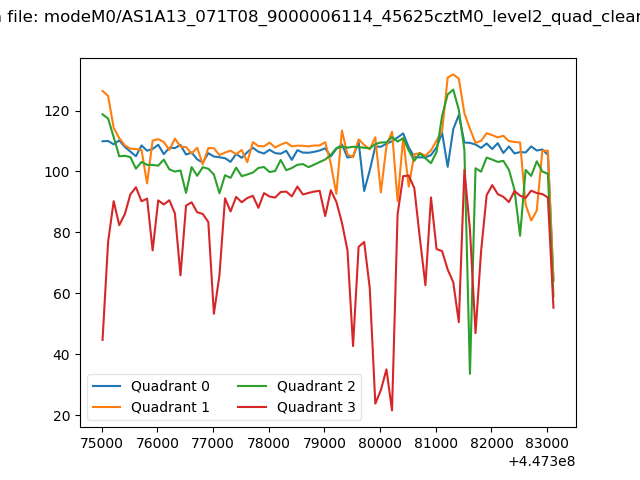
| Quadrant-wise count rates Data is divided into 100 sec bins |
 |
|
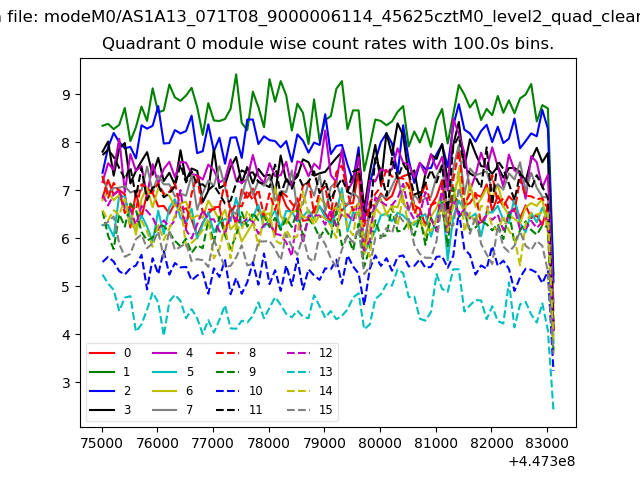
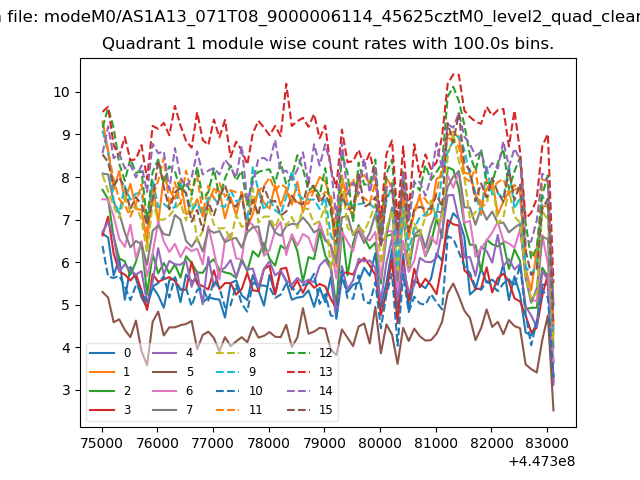
| Module-wise count rates for Quadrant A Data is divided into 100 sec bins |
 |
 |
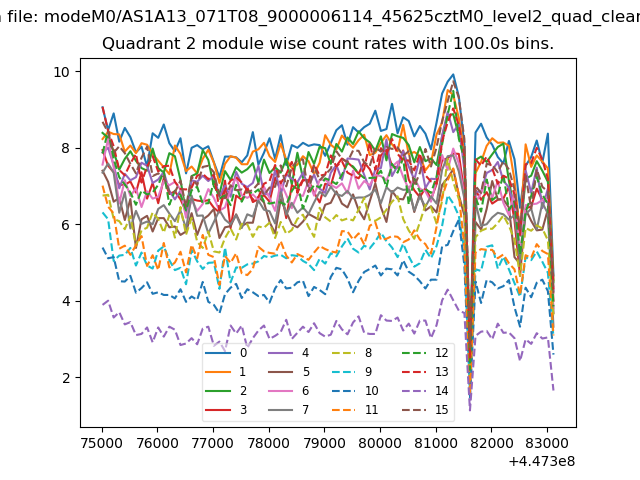
| Module-wise count rates for Quadrant B Data is divided into 100 sec bins |
 |
 |
| Module-wise count rates for Quadrant C Data is divided into 100 sec bins |
 |
 |
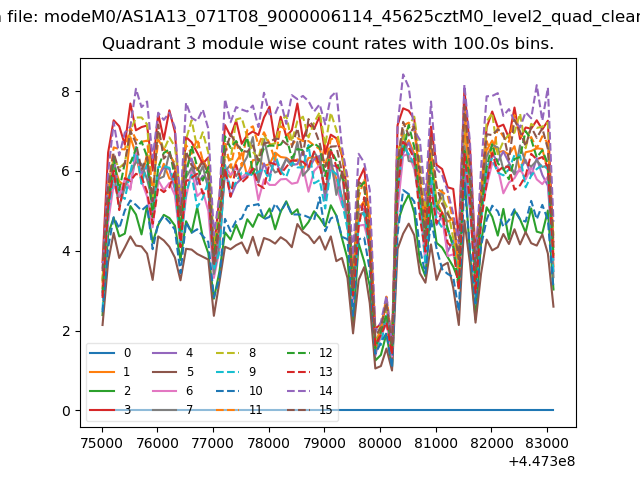
| Module-wise count rates for Quadrant D Data is divided into 100 sec bins |
 |
 |
| Parameter | Plot |
|---|---|
| CZT HV Monitor | 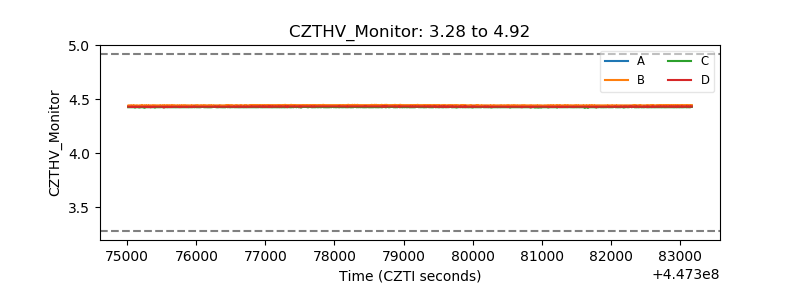 |
| D_VDD | 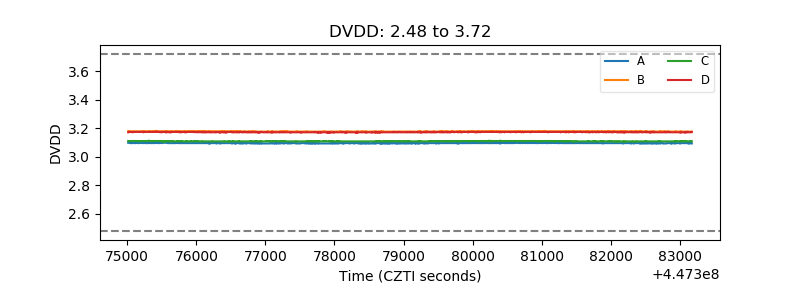 |
| Temperature 1 | 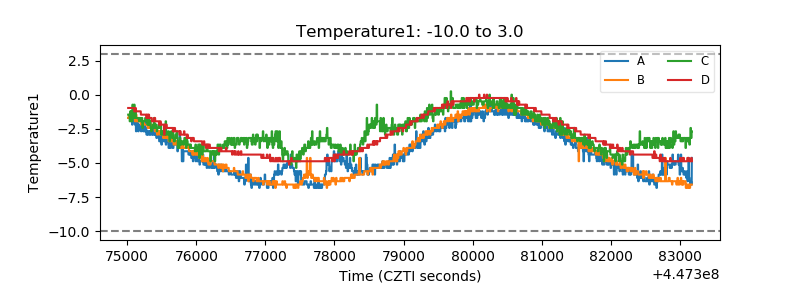 |
| Veto HV Monitor | 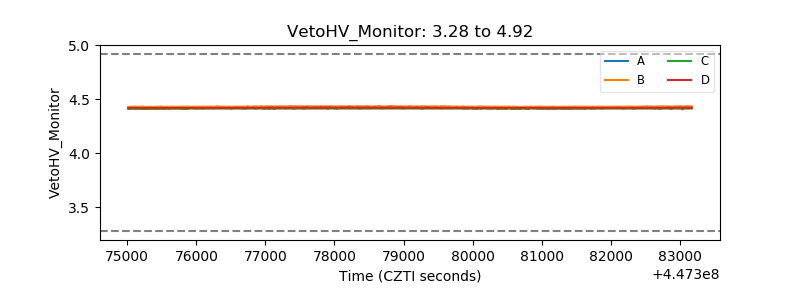 |
| Veto LLD | 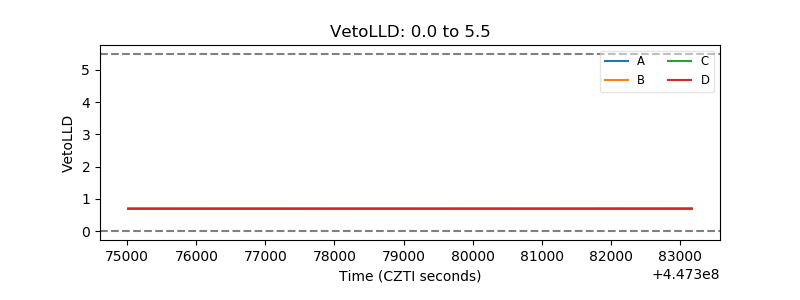 |
| Alpha Counter | 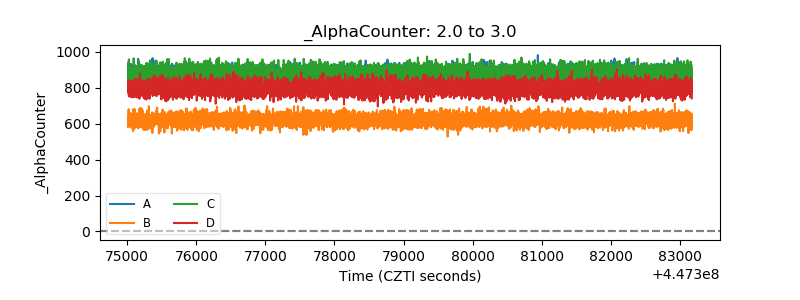 |
| _CPM_Rate | 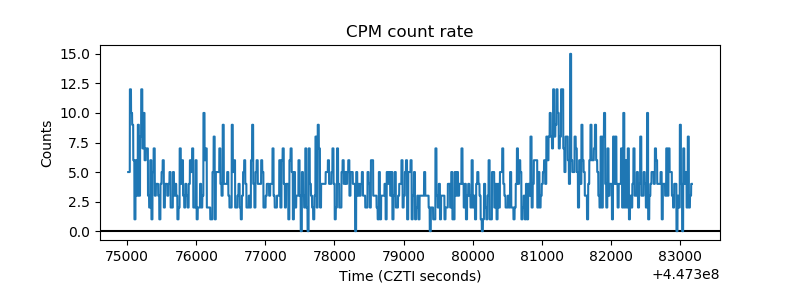 |
| CZT Counter | 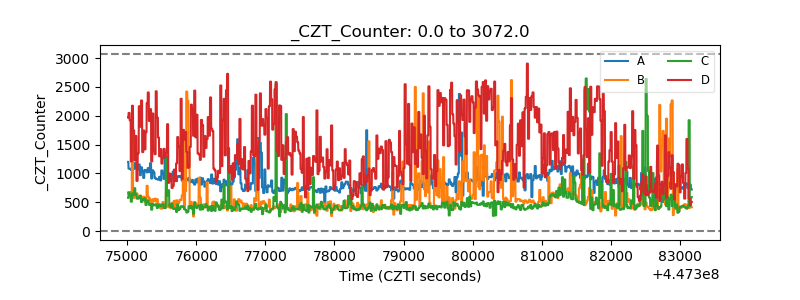 |
| +2.5 Volts monitor |  |
| +5 Volts monitor | 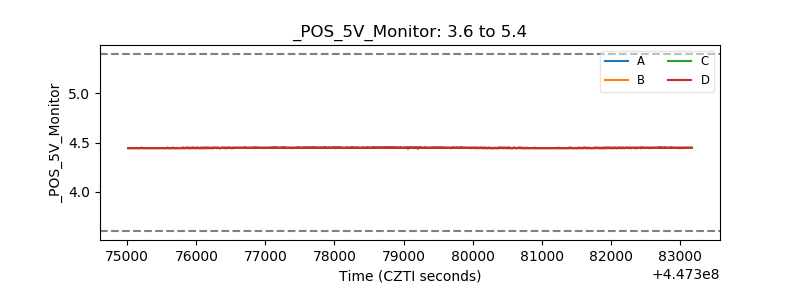 |
| _ROLL_ROT | 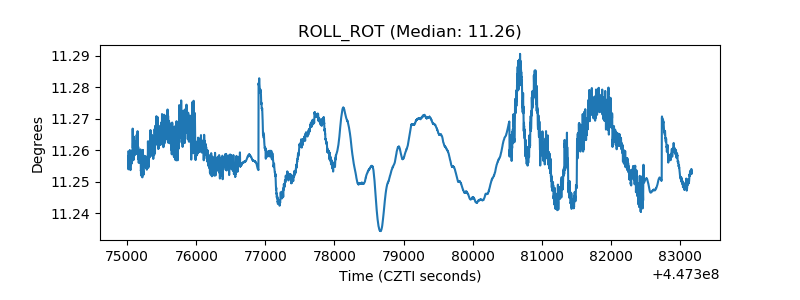 |
| _Roll_DEC | 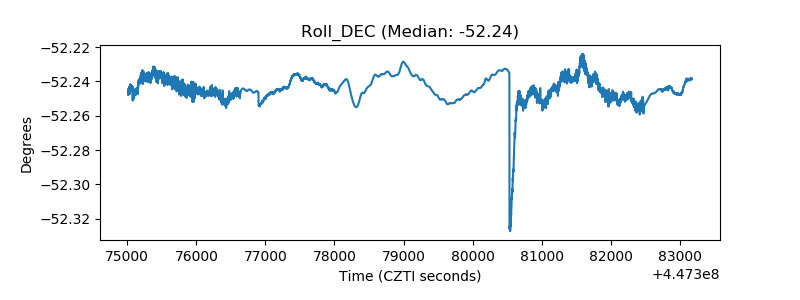 |
| _Roll_RA | 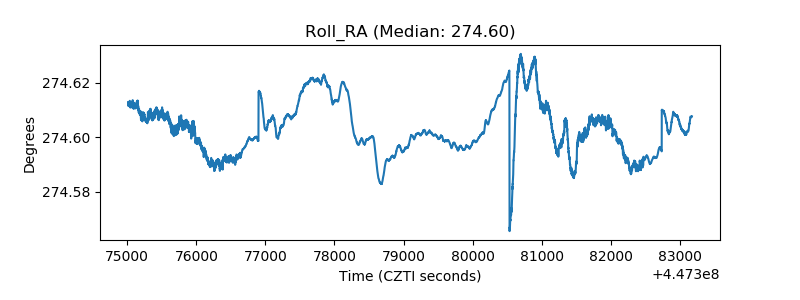 |
| Veto Counter | 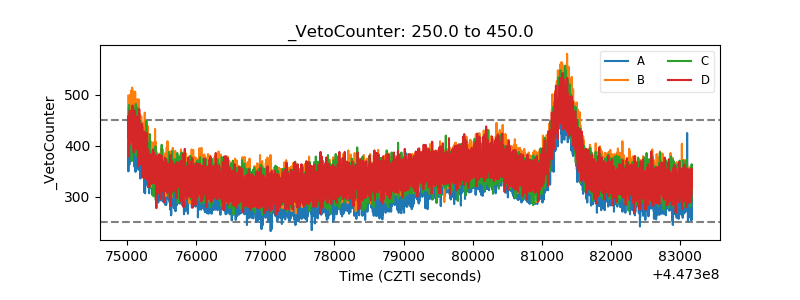 |