| Param | Original file | Final file |
|---|---|---|
| Filename | modeM0/AS1A13_071T08_9000006114_45631cztM0_level2.fits | modeM0/AS1A13_071T08_9000006114_45631cztM0_level2_quad_clean.evt |
| Size (bytes) | 1,759,276,800 | 352,388,160 |
| Size | 1.6 GB | 336.1 MB |
| Events in quadrant A | 18,750,744 | 2,374,088 |
| Events in quadrant B | 13,403,126 | 2,361,944 |
| Events in quadrant C | 11,010,832 | 2,319,706 |
| Events in quadrant D | 20,222,667 | 2,064,560 |
| Mode M9 | |||
|---|---|---|---|
| Quadrant | BADHDUFLAG | Total packets | Discarded packets |
| A | 0 | 19 | 0 |
| B | 0 | 19 | 0 |
| C | 0 | 19 | 0 |
| D | 0 | 19 | 0 |
| Mode M0 | |||
|---|---|---|---|
| Quadrant | BADHDUFLAG | Total packets | Discarded packets |
| A | 0 | 71068 | 4 |
| B | 0 | 55582 | 4 |
| C | 0 | 49325 | 4 |
| D | 0 | 75815 | 4 |
| Mode SS | |||
|---|---|---|---|
| Quadrant | BADHDUFLAG | Total packets | Discarded packets |
| A | 0 | 458 | 0 |
| B | 0 | 458 | 0 |
| C | 0 | 458 | 0 |
| D | 0 | 458 | 0 |
| Quadrant | Total seconds | Saturated seconds | Saturation percentage |
|---|---|---|---|
| A | 22495 | 369 | 1.640365% |
| B | 22496 | 1208 | 5.369844% |
| C | 22496 | 428 | 1.902560% |
| D | 22496 | 1279 | 5.685455% |
Noise dominated data is calculated using 1-second bins in cleaned event files. If a bin has >2000 counts, and if more than 50% of those come from <1% of pixels, then it is considered to be noise-dominated and hence unusable.
| Quadrant | # 1 sec bins | Bins with >0 counts | Bins with >2000 counts | High rate bins dominated by noise | Noise dominated (total time) | Noise dominated (detector-on time) | Marked lightcurve |
|---|---|---|---|---|---|---|---|
| A | 24235 | 22499 | 22 | 22 | 0.09% | 0.10% | 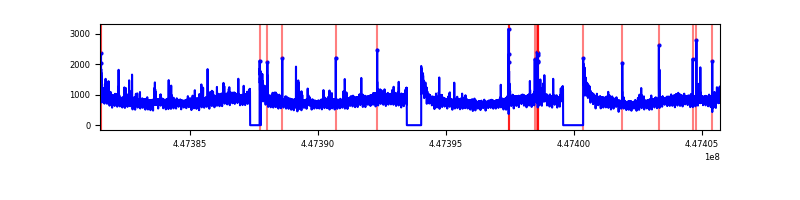 |
| B | 24236 | 22500 | 750 | 750 | 3.09% | 3.33% | 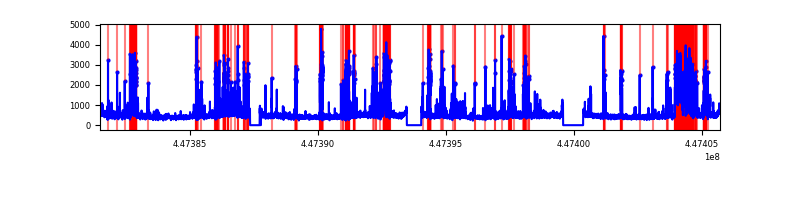 |
| C | 24236 | 22500 | 255 | 255 | 1.05% | 1.13% | 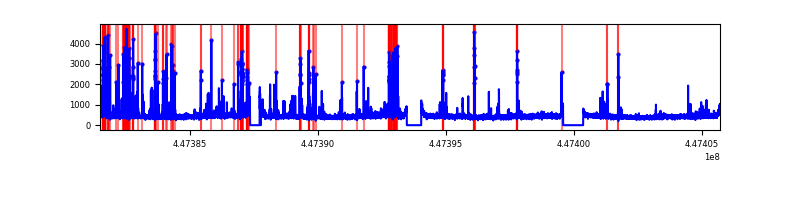 |
| D | 24236 | 22500 | 965 | 965 | 3.98% | 4.29% | 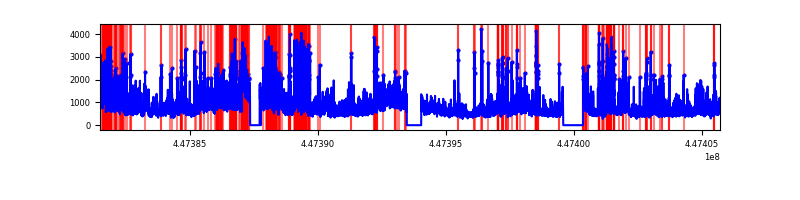 |
Top three noisy pixels from each quadrant. If the there are fewer than three noisy pixels in the level2.evt file, extra rows are filled as -1
| Pixel properties | Quadrant properties | ||||||
|---|---|---|---|---|---|---|---|
| Quadrant | DetID | PixID | Counts | Sigma | Mean | Median | Sigma |
| A | 10 | 83 | 8911739 | 17575.74 | 2469 | 2413 | 506.9 |
| A | 14 | 235 | 95403 | 183.44 | 2469 | 2413 | 506.9 |
| A | 10 | 255 | 63785 | 121.07 | 2469 | 2413 | 506.9 |
| B | 5 | 172 | 1784923 | 3749.58 | 2415 | 2334 | 475.4 |
| B | 3 | 112 | 808447 | 1695.62 | 2415 | 2334 | 475.4 |
| B | 12 | 18 | 633356 | 1327.32 | 2415 | 2334 | 475.4 |
| C | 14 | 254 | 1267413 | 2218.87 | 2425 | 2438 | 570.1 |
| C | 12 | 2 | 166079 | 287.04 | 2425 | 2438 | 570.1 |
| C | 2 | 14 | 101444 | 173.66 | 2425 | 2438 | 570.1 |
| D | 11 | 241 | 7054552 | 11769.11 | 2394 | 2320 | 599.2 |
| D | 2 | 249 | 1290008 | 2148.96 | 2394 | 2320 | 599.2 |
| D | 13 | 249 | 942591 | 1569.17 | 2394 | 2320 | 599.2 |
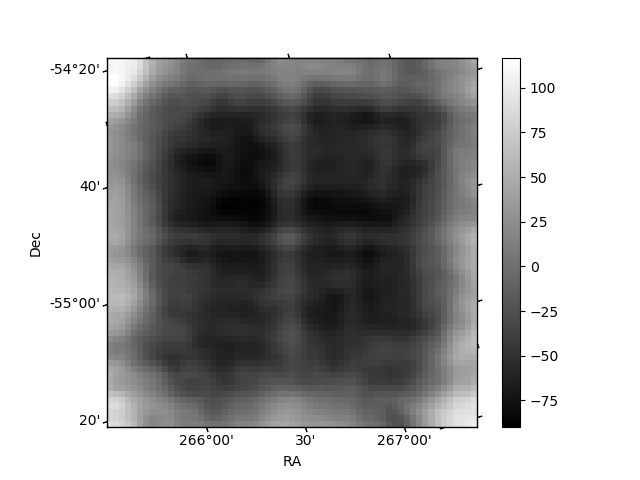
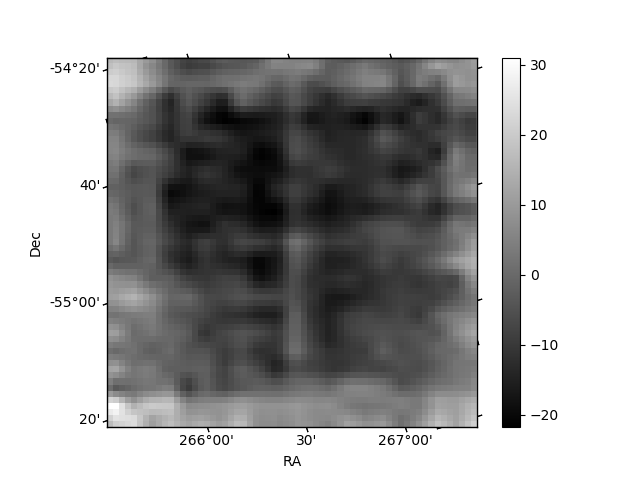
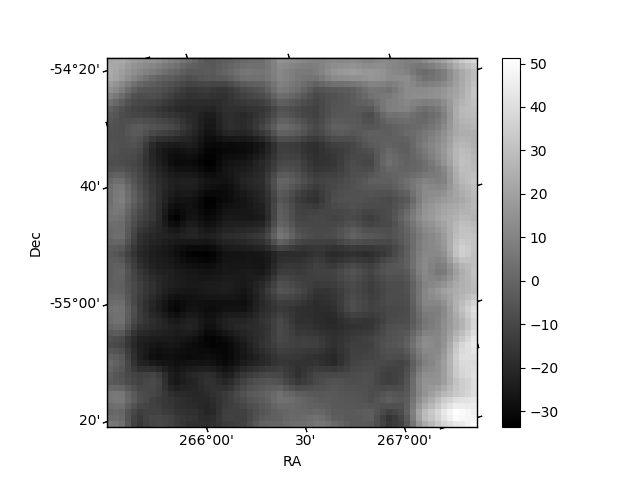
Histogram calculated using DETX and DETY for each event in the final _common_clean file
| Quadrant A | 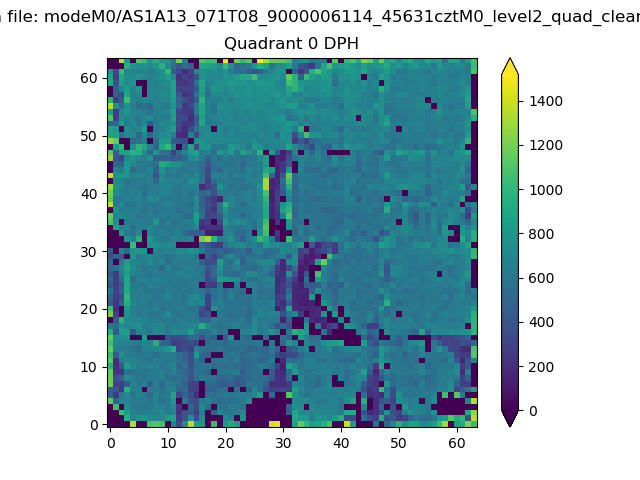 |
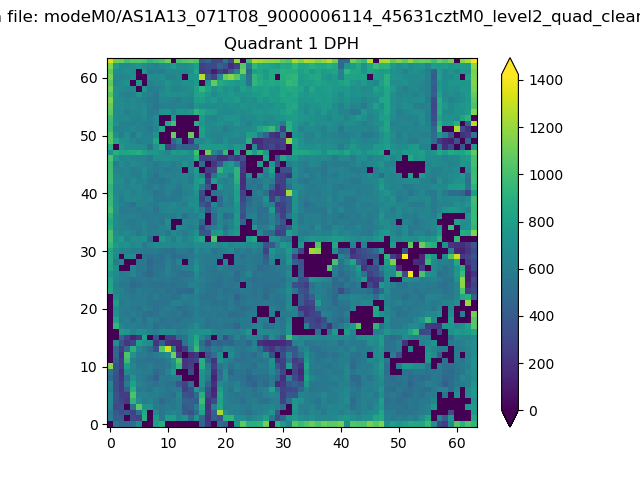 |
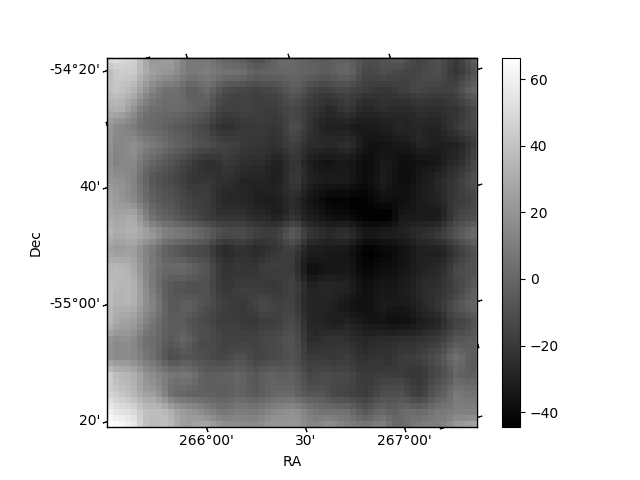
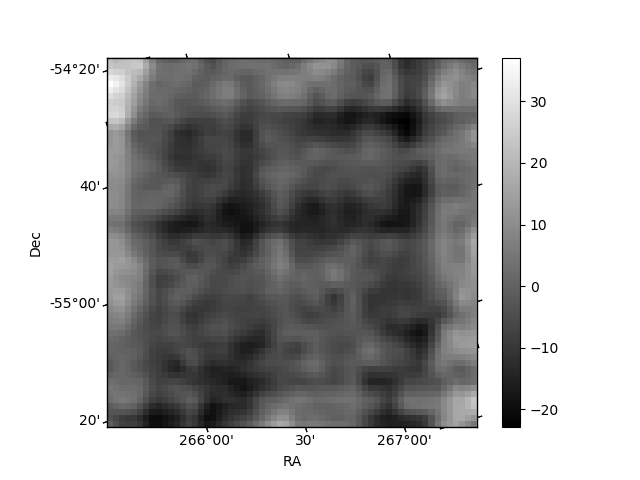
Quadrant B |
|---|---|---|---|
| Quadrant D | 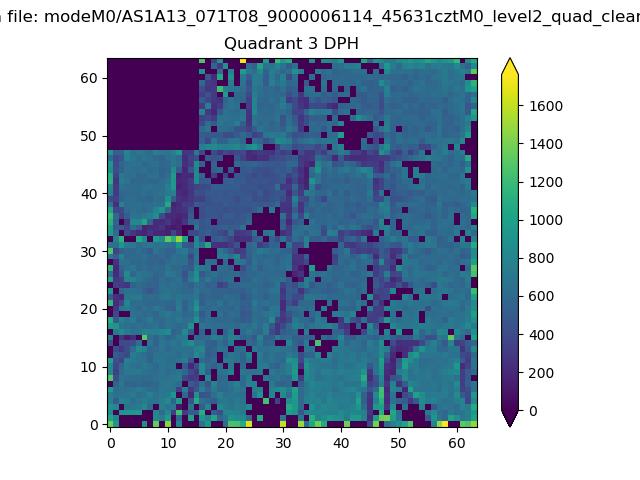 |
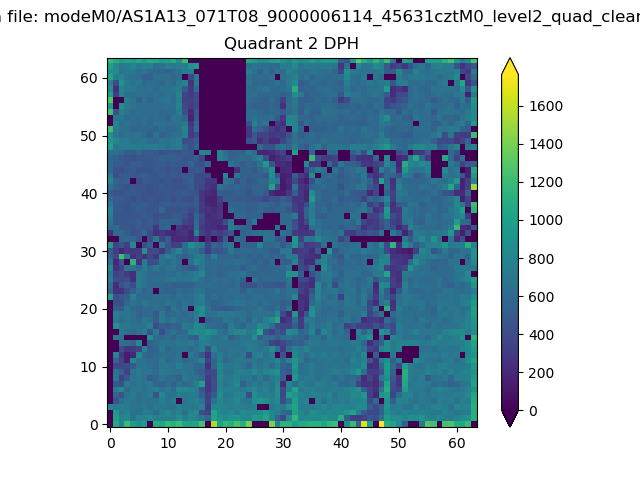 |
Quadrant C |
| Plot type | Count rate plots | Images |
|---|---|---|
| Comparison with Poisson distribution Blue bars denote a histogram of data divided into 1 sec bins. Red curve is a Poisson curve with rate = median count rate of data. |
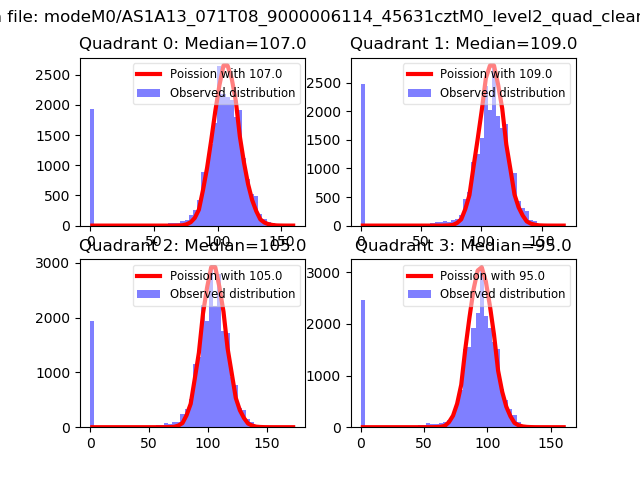 |
 |
| Quadrant-wise count rates Data is divided into 100 sec bins |
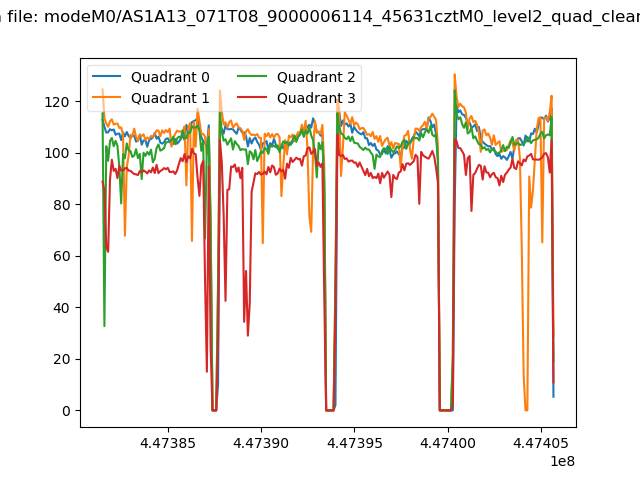 |
|
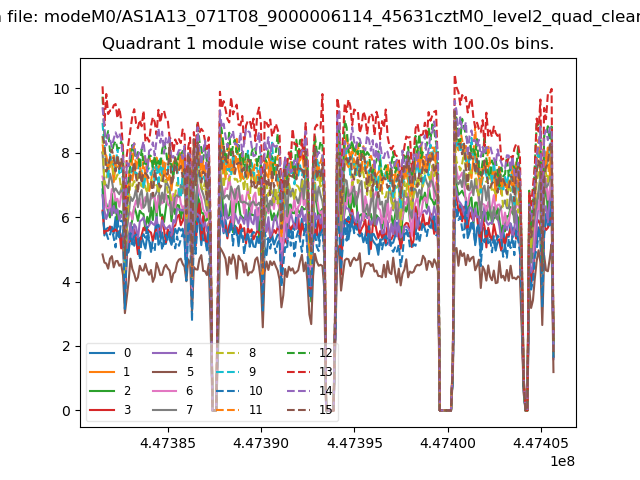
| Module-wise count rates for Quadrant A Data is divided into 100 sec bins |
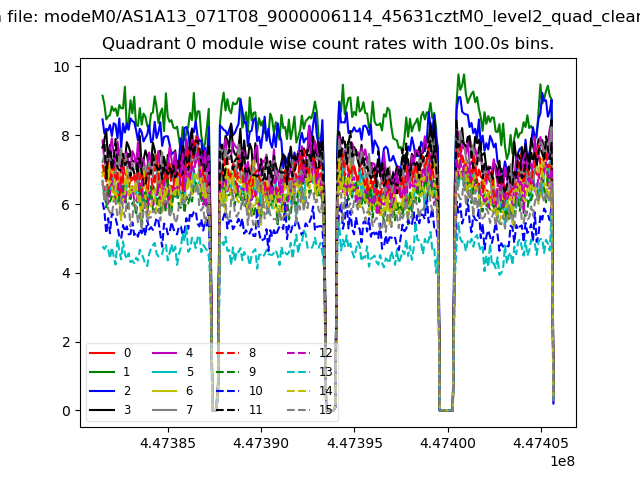 |
 |
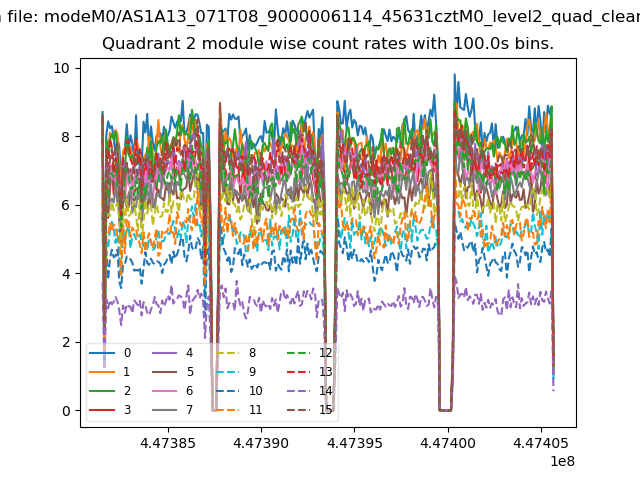
| Module-wise count rates for Quadrant B Data is divided into 100 sec bins |
 |
 |
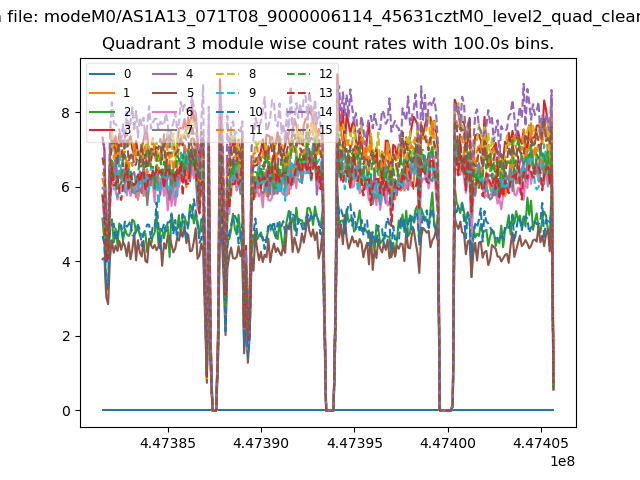
| Module-wise count rates for Quadrant C Data is divided into 100 sec bins |
 |
 |
| Module-wise count rates for Quadrant D Data is divided into 100 sec bins |
 |
 |
| Parameter | Plot |
|---|---|
| CZT HV Monitor | 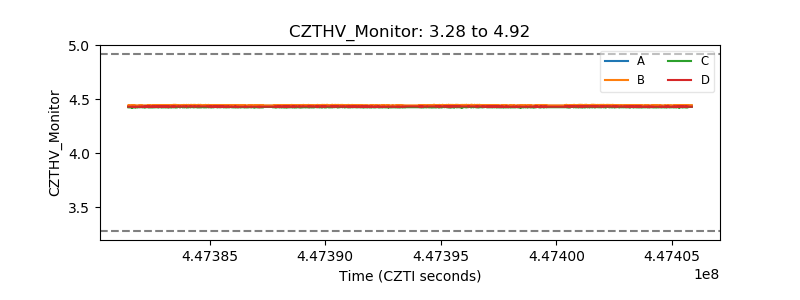 |
| D_VDD | 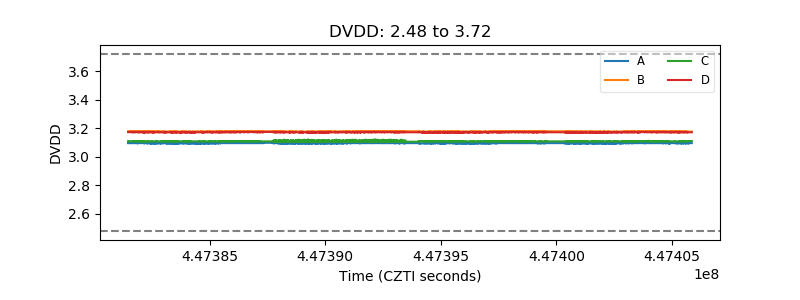 |
| Temperature 1 | 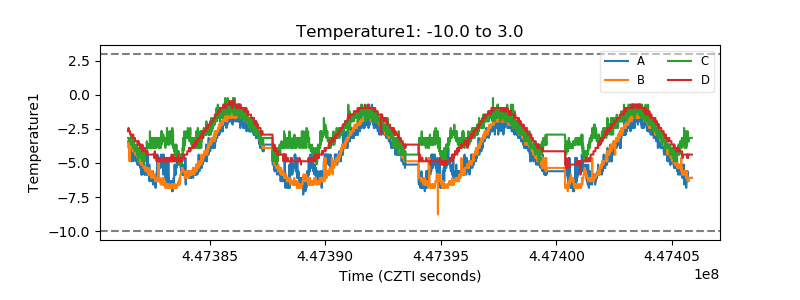 |
| Veto HV Monitor | 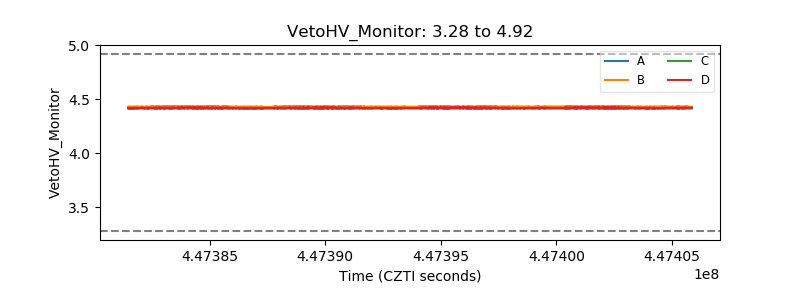 |
| Veto LLD | 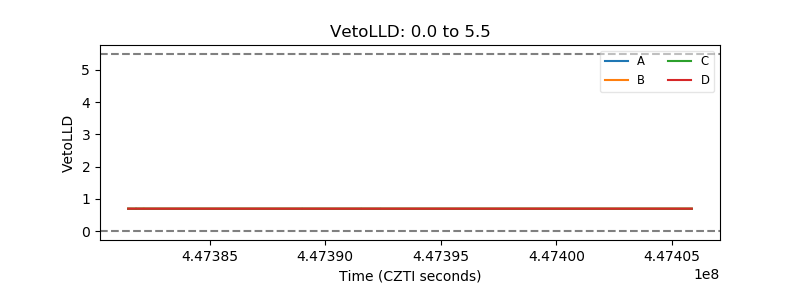 |
| Alpha Counter | 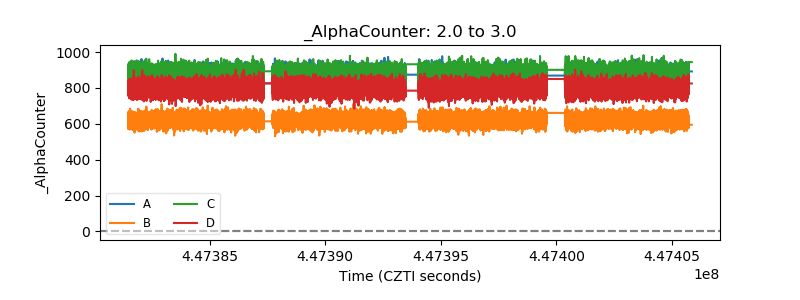 |
| _CPM_Rate | 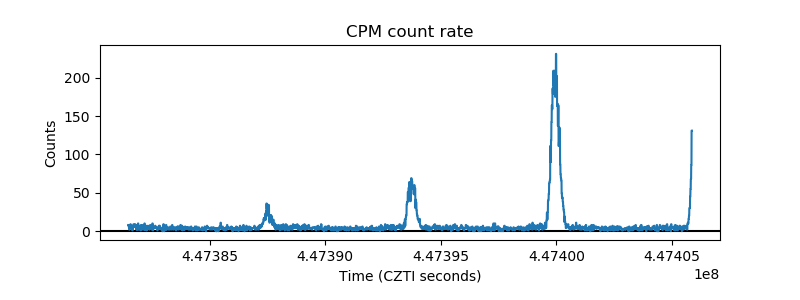 |
| CZT Counter | 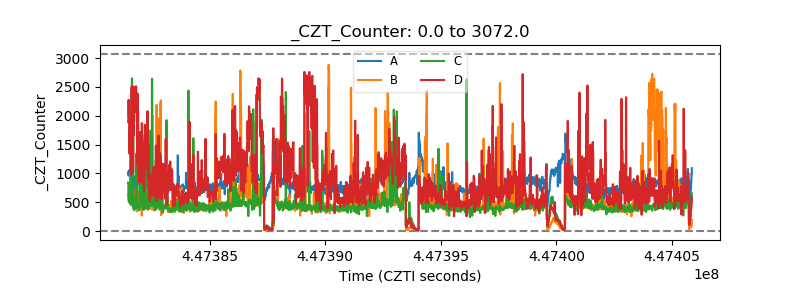 |
| +2.5 Volts monitor | 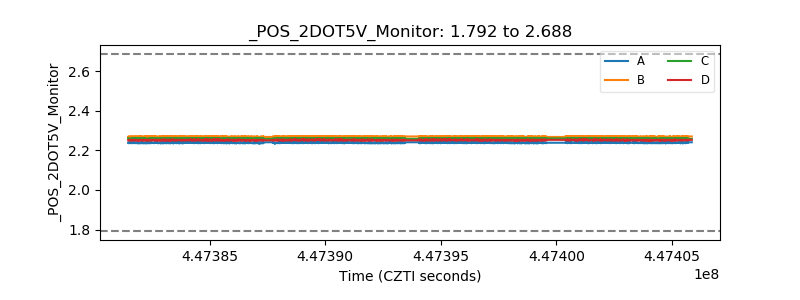 |
| +5 Volts monitor | 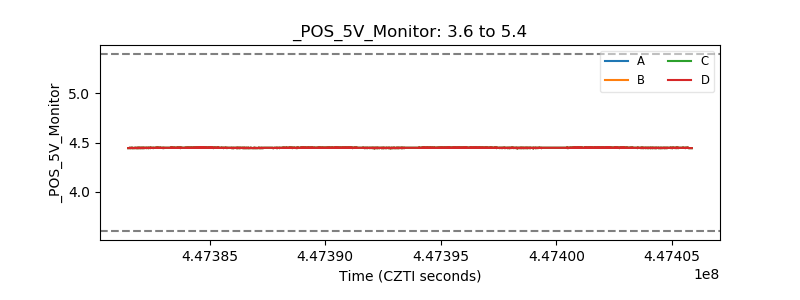 |
| _ROLL_ROT | 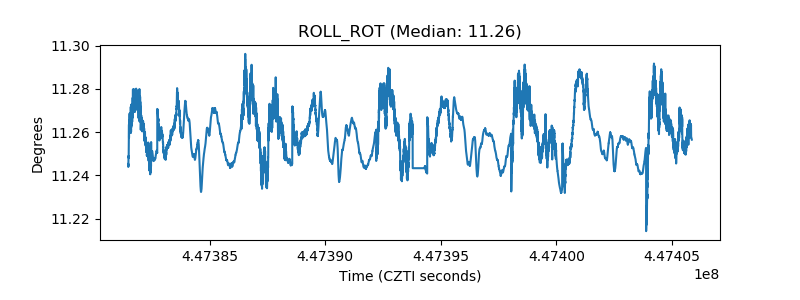 |
| _Roll_DEC | 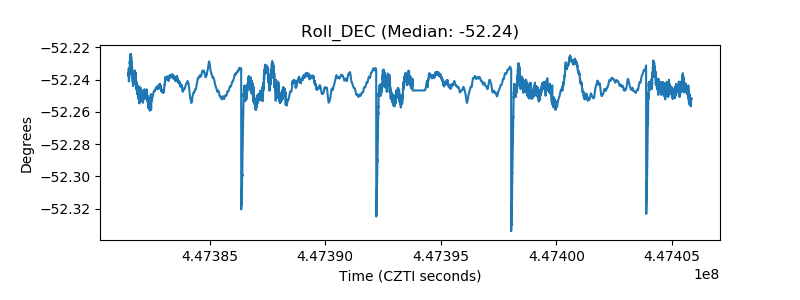 |
| _Roll_RA | 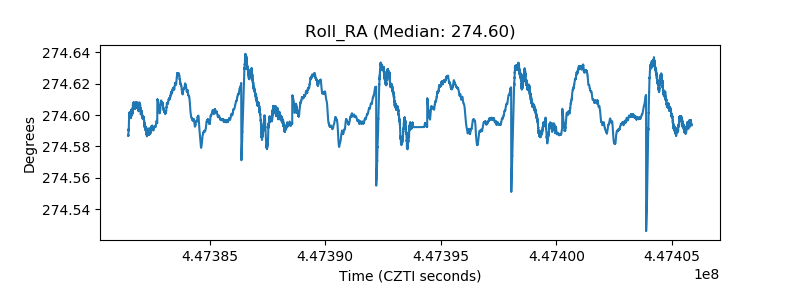 |
| Veto Counter | 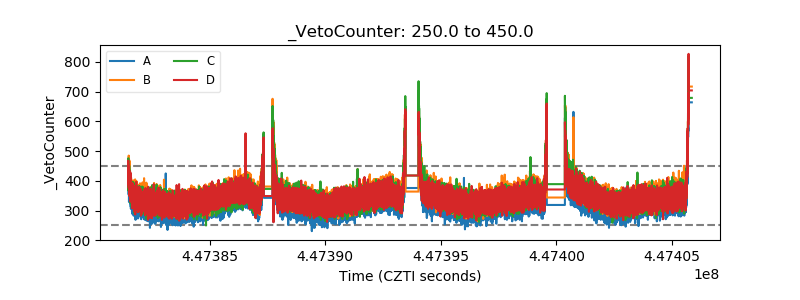 |