| Param | Original file | Final file |
|---|---|---|
| Filename | modeM0/AS1A13_071T08_9000006114_45632cztM0_level2.fits | modeM0/AS1A13_071T08_9000006114_45632cztM0_level2_quad_clean.evt |
| Size (bytes) | 1,063,932,480 | 207,057,600 |
| Size | 1014.6 MB | 197.5 MB |
| Events in quadrant A | 11,388,784 | 1,430,858 |
| Events in quadrant B | 10,066,339 | 1,308,738 |
| Events in quadrant C | 5,865,068 | 1,435,255 |
| Events in quadrant D | 11,077,505 | 1,213,200 |
| Mode M9 | |||
|---|---|---|---|
| Quadrant | BADHDUFLAG | Total packets | Discarded packets |
| A | 0 | 32 | 0 |
| B | 0 | 32 | 0 |
| C | 0 | 32 | 0 |
| D | 0 | 32 | 0 |
| Mode M0 | |||
|---|---|---|---|
| Quadrant | BADHDUFLAG | Total packets | Discarded packets |
| A | 0 | 41545 | 3 |
| B | 0 | 38266 | 3 |
| C | 0 | 26476 | 3 |
| D | 0 | 41689 | 3 |
| Mode SS | |||
|---|---|---|---|
| Quadrant | BADHDUFLAG | Total packets | Discarded packets |
| A | 0 | 260 | 0 |
| B | 0 | 260 | 0 |
| C | 0 | 260 | 0 |
| D | 0 | 260 | 0 |
| Quadrant | Total seconds | Saturated seconds | Saturation percentage |
|---|---|---|---|
| A | 12755 | 412 | 3.230106% |
| B | 12754 | 1690 | 13.250745% |
| C | 12754 | 131 | 1.027129% |
| D | 12755 | 1112 | 8.718150% |
Noise dominated data is calculated using 1-second bins in cleaned event files. If a bin has >2000 counts, and if more than 50% of those come from <1% of pixels, then it is considered to be noise-dominated and hence unusable.
| Quadrant | # 1 sec bins | Bins with >0 counts | Bins with >2000 counts | High rate bins dominated by noise | Noise dominated (total time) | Noise dominated (detector-on time) | Marked lightcurve |
|---|---|---|---|---|---|---|---|
| A | 15910 | 12756 | 30 | 30 | 0.19% | 0.24% | 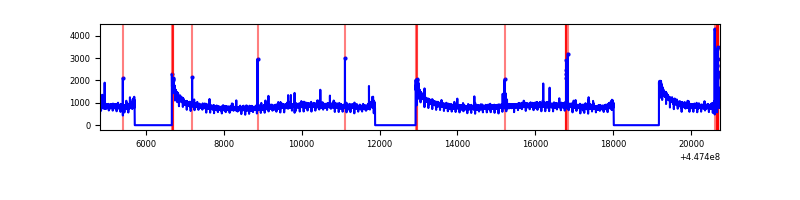 |
| B | 15909 | 12756 | 1146 | 1146 | 7.20% | 8.98% | 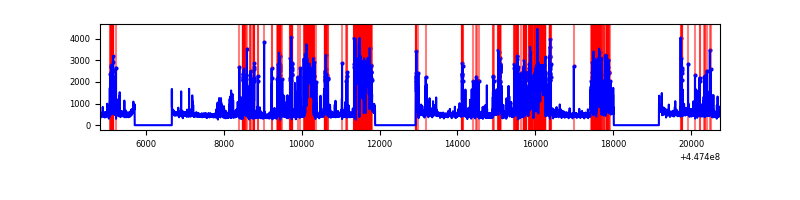 |
| C | 15909 | 12756 | 6 | 6 | 0.04% | 0.05% | 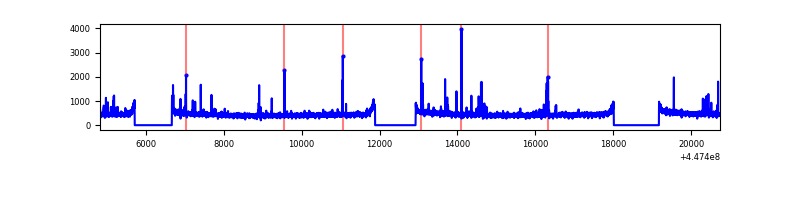 |
| D | 15910 | 12757 | 800 | 800 | 5.03% | 6.27% | 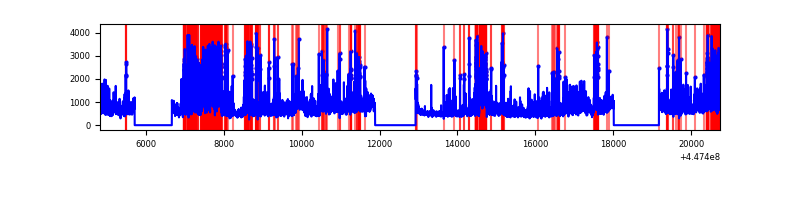 |
Top three noisy pixels from each quadrant. If the there are fewer than three noisy pixels in the level2.evt file, extra rows are filled as -1
| Pixel properties | Quadrant properties | ||||||
|---|---|---|---|---|---|---|---|
| Quadrant | DetID | PixID | Counts | Sigma | Mean | Median | Sigma |
| A | 10 | 83 | 5534282 | 18144.84 | 1479 | 1445 | 304.9 |
| A | 13 | 248 | 52031 | 165.9 | 1479 | 1445 | 304.9 |
| A | 10 | 255 | 38602 | 121.86 | 1479 | 1445 | 304.9 |
| B | 3 | 112 | 2037971 | 7642.41 | 1381 | 1338 | 266.5 |
| B | 12 | 18 | 1271657 | 4766.84 | 1381 | 1338 | 266.5 |
| B | 5 | 172 | 884985 | 3315.86 | 1381 | 1338 | 266.5 |
| C | 14 | 254 | 125765 | 364.94 | 1456 | 1465 | 340.6 |
| C | 2 | 14 | 46800 | 133.1 | 1456 | 1465 | 340.6 |
| C | 0 | 64 | 11746 | 30.18 | 1456 | 1465 | 340.6 |
| D | 13 | 249 | 1713359 | 4804.37 | 1424 | 1380 | 356.3 |
| D | 11 | 241 | 1613977 | 4525.47 | 1424 | 1380 | 356.3 |
| D | 1 | 52 | 709515 | 1987.26 | 1424 | 1380 | 356.3 |
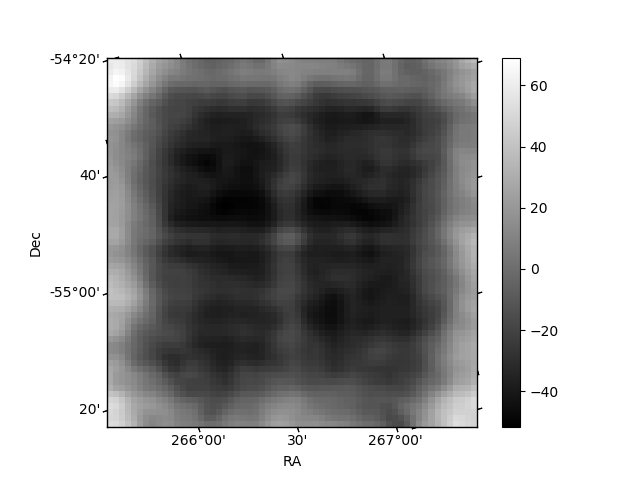
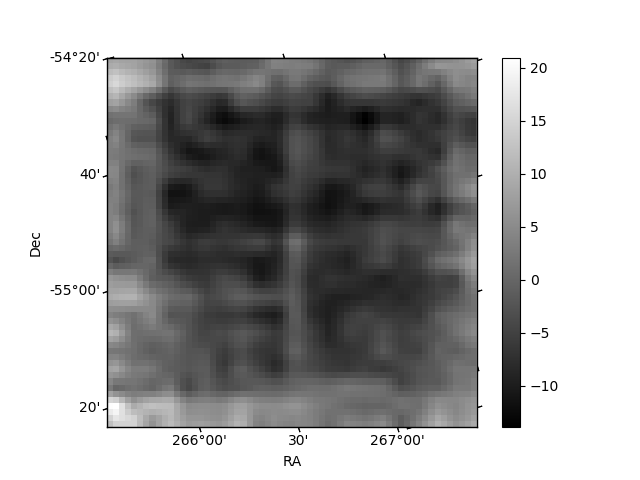
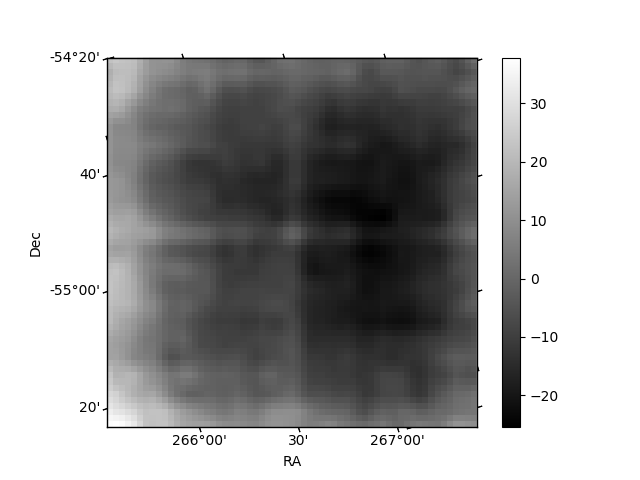
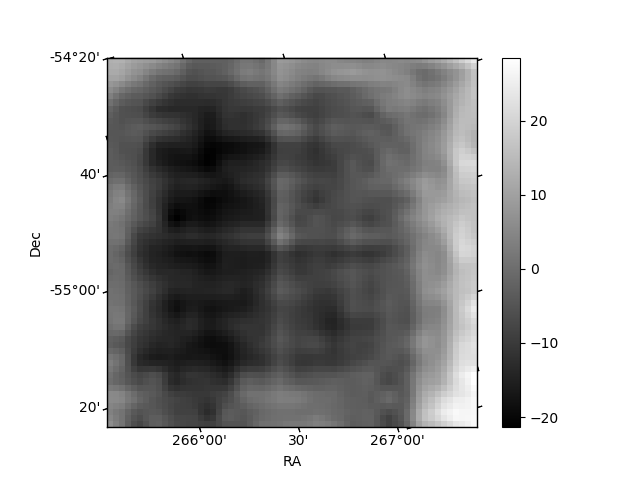
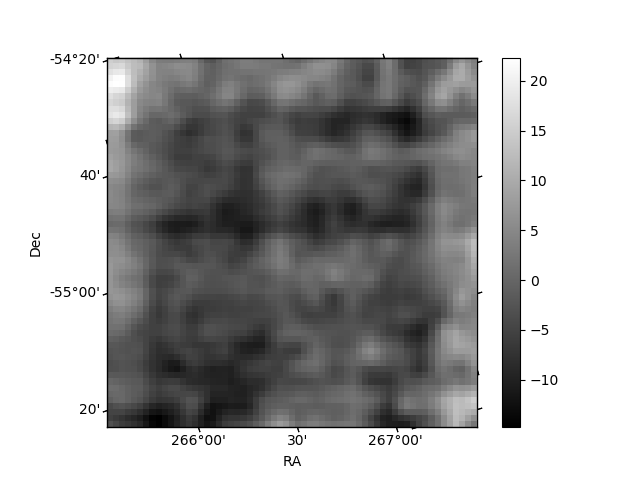
Histogram calculated using DETX and DETY for each event in the final _common_clean file
| Quadrant A | 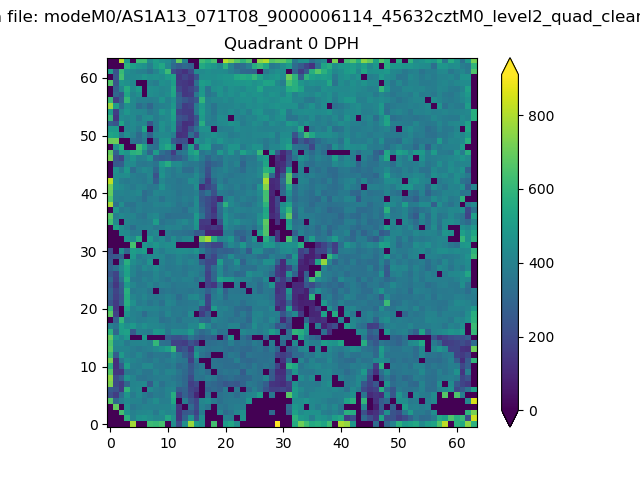 |
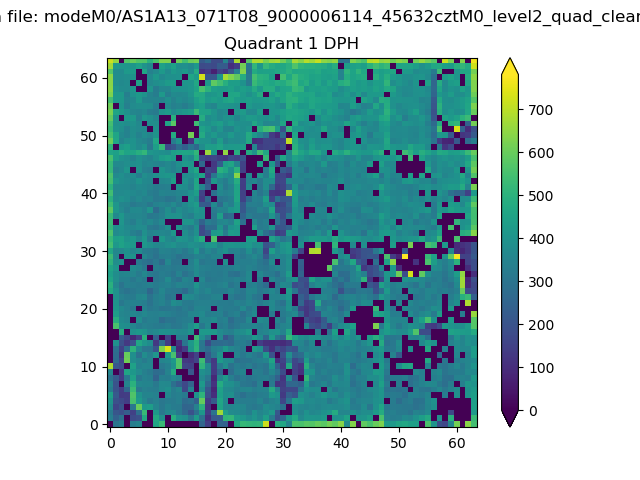 |
Quadrant B |
|---|---|---|---|
| Quadrant D | 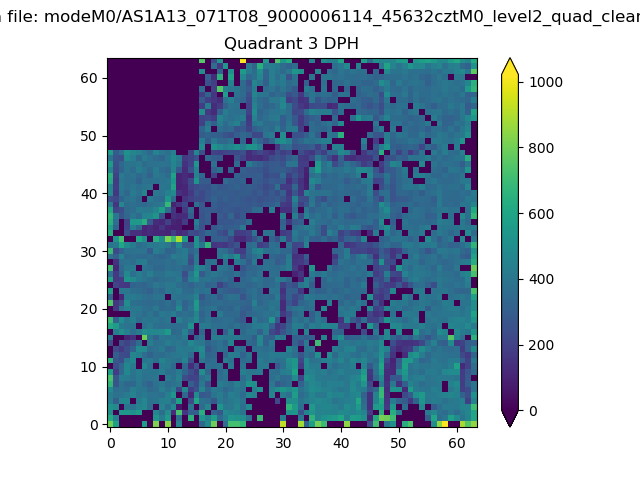 |
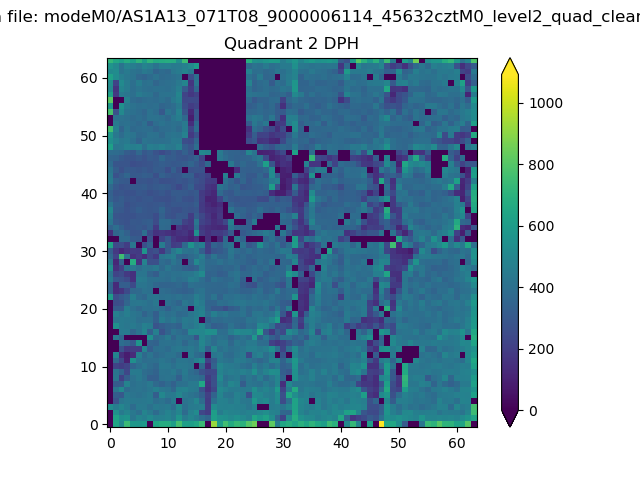 |
Quadrant C |
| Plot type | Count rate plots | Images |
|---|---|---|
| Comparison with Poisson distribution Blue bars denote a histogram of data divided into 1 sec bins. Red curve is a Poisson curve with rate = median count rate of data. |
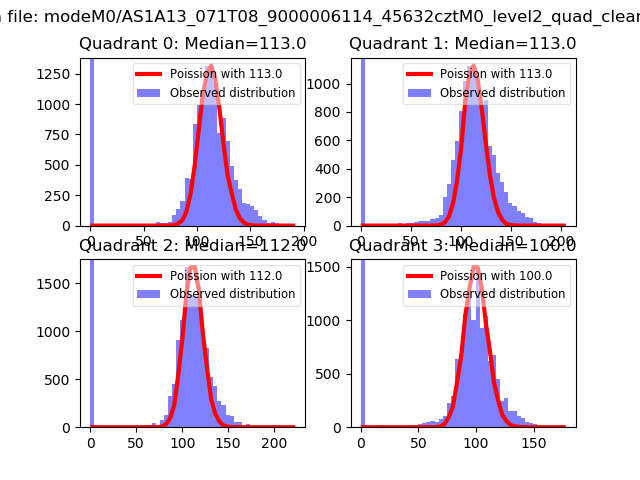 |
 |
| Quadrant-wise count rates Data is divided into 100 sec bins |
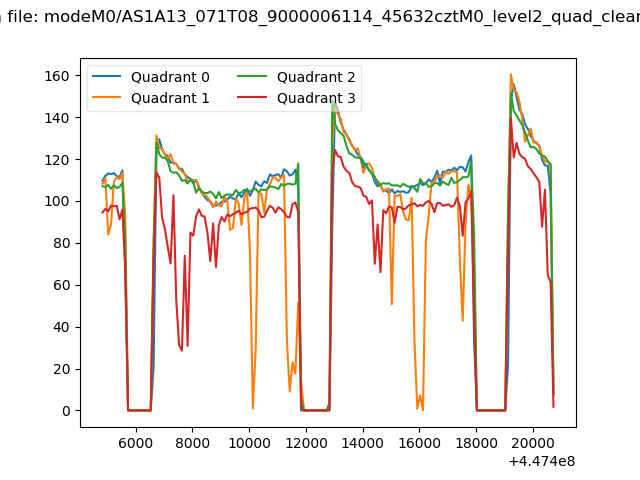 |
|
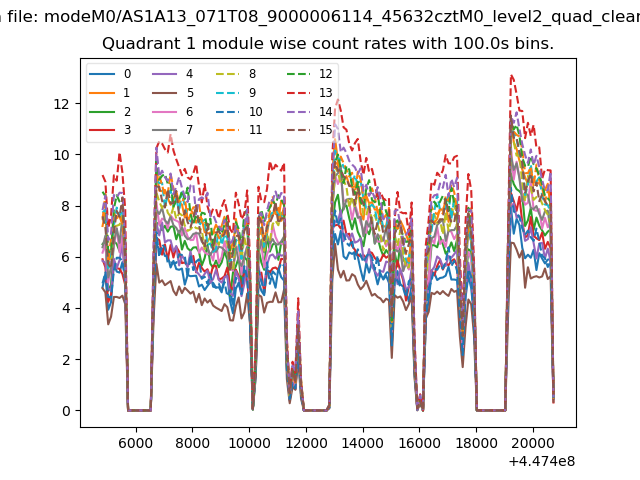
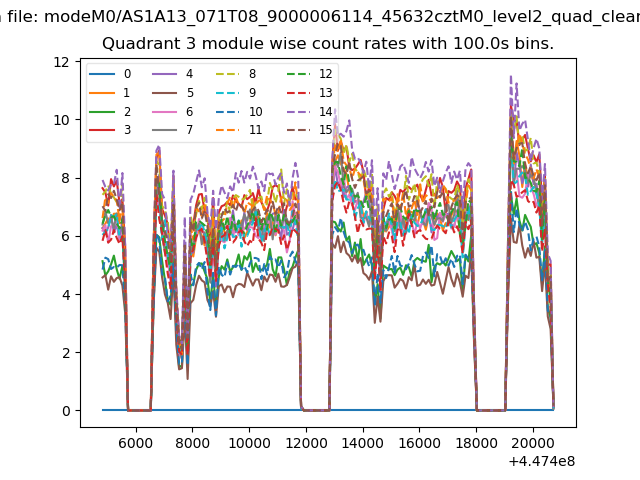
| Module-wise count rates for Quadrant A Data is divided into 100 sec bins |
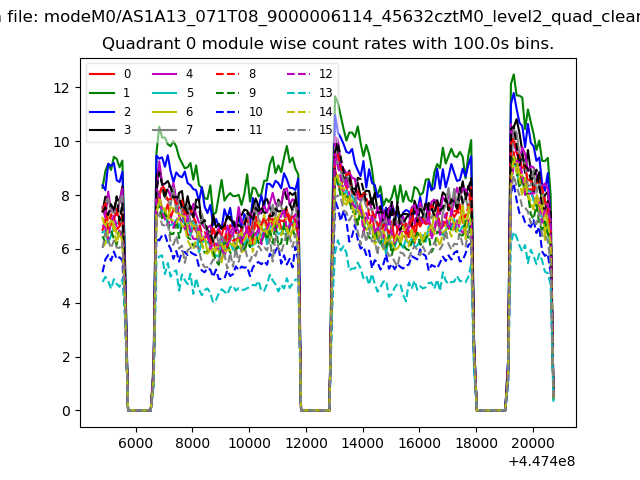 |
 |
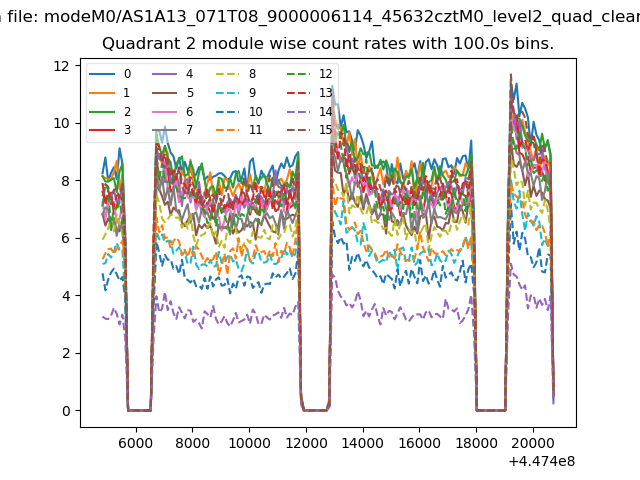
| Module-wise count rates for Quadrant B Data is divided into 100 sec bins |
 |
 |
| Module-wise count rates for Quadrant C Data is divided into 100 sec bins |
 |
 |
| Module-wise count rates for Quadrant D Data is divided into 100 sec bins |
 |
 |
| Parameter | Plot |
|---|---|
| CZT HV Monitor | 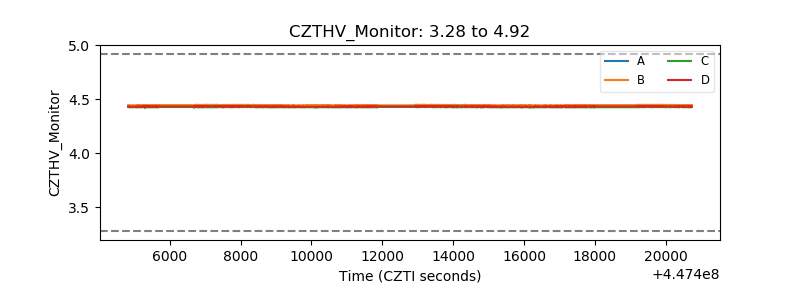 |
| D_VDD | 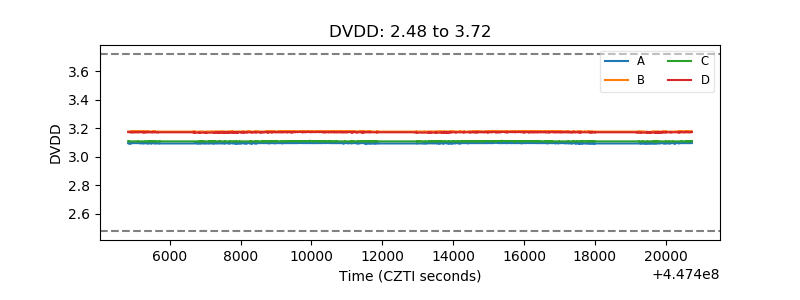 |
| Temperature 1 | 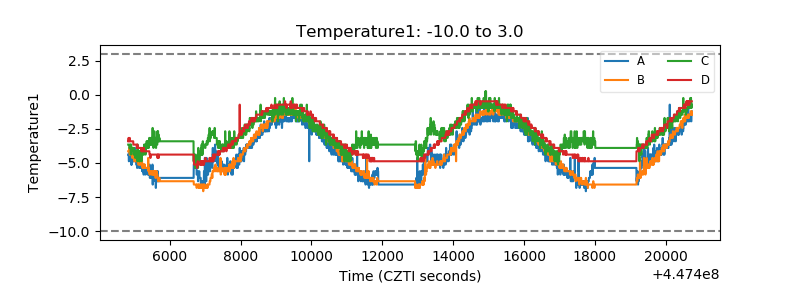 |
| Veto HV Monitor | 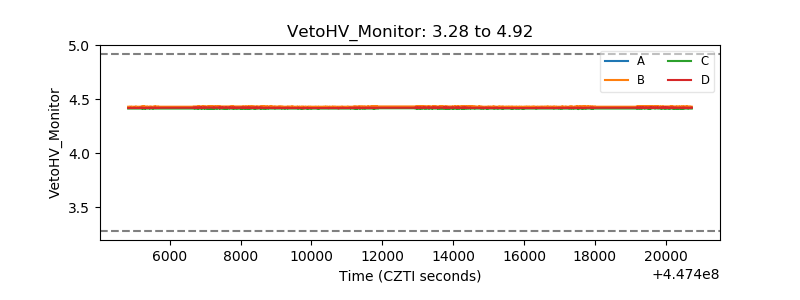 |
| Veto LLD | 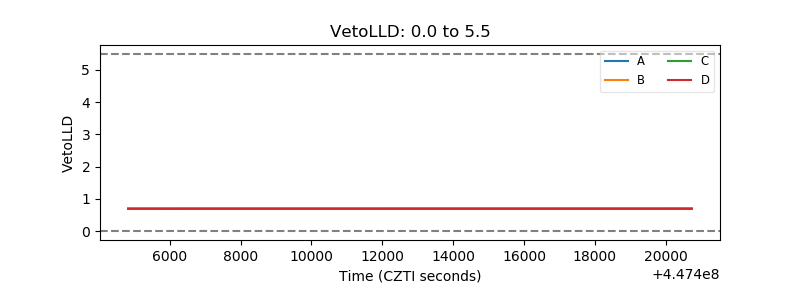 |
| Alpha Counter | 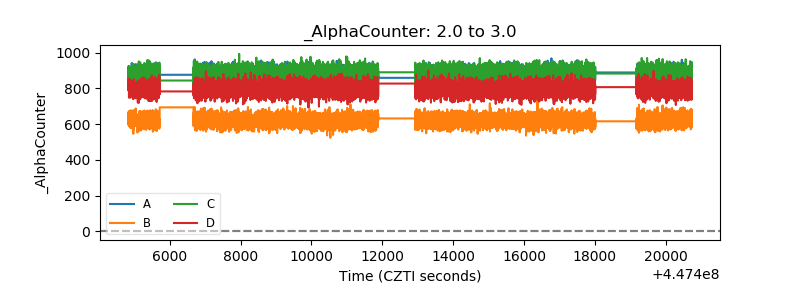 |
| _CPM_Rate | 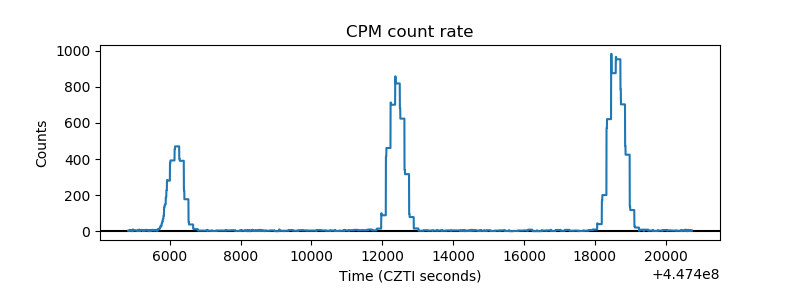 |
| CZT Counter | 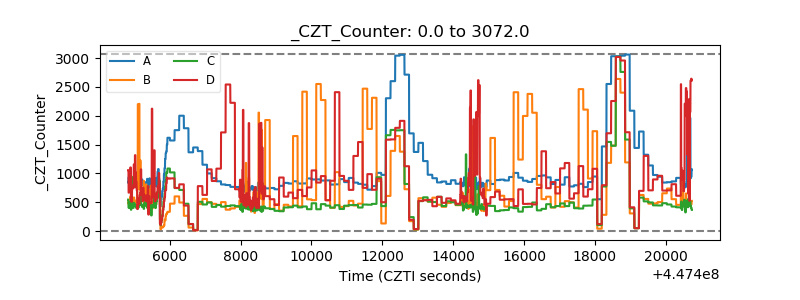 |
| +2.5 Volts monitor | 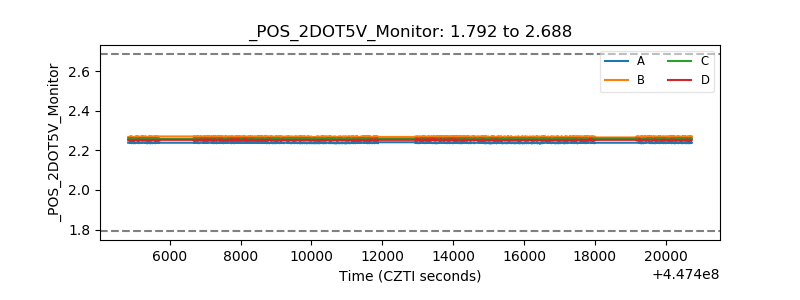 |
| +5 Volts monitor | 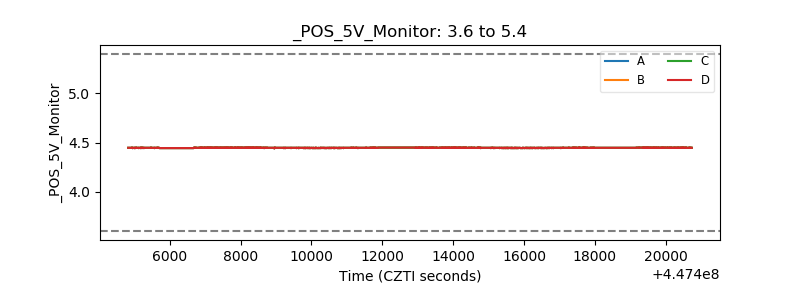 |
| _ROLL_ROT | 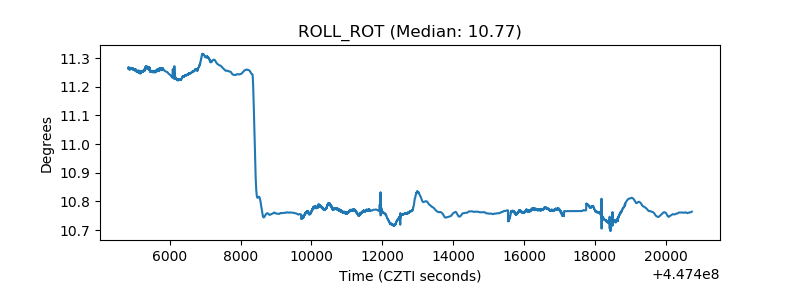 |
| _Roll_DEC | 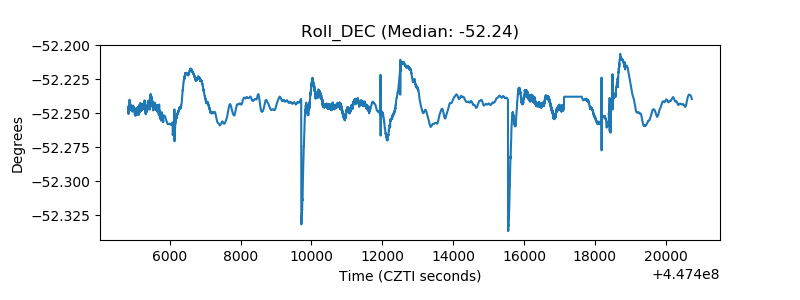 |
| _Roll_RA | 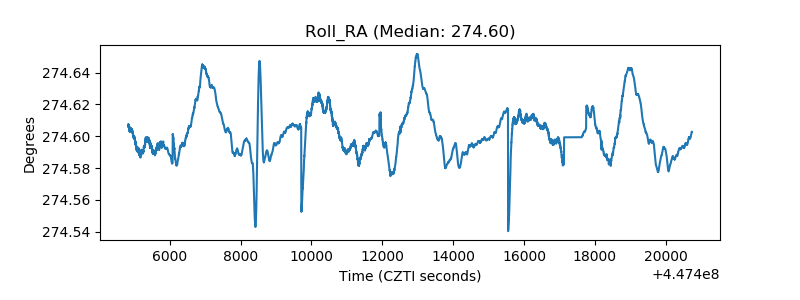 |
| Veto Counter | 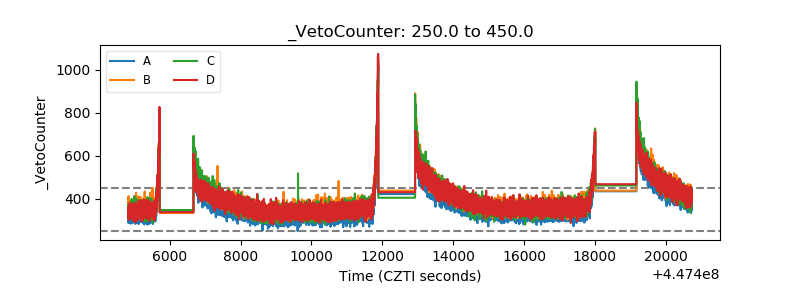 |