| Param | Original file | Final file |
|---|---|---|
| Filename | modeM0/AS1A13_071T08_9000006114_45634cztM0_level2.fits | modeM0/AS1A13_071T08_9000006114_45634cztM0_level2_quad_clean.evt |
| Size (bytes) | 514,872,000 | 104,630,400 |
| Size | 491.0 MB | 99.8 MB |
| Events in quadrant A | 5,466,313 | 721,595 |
| Events in quadrant B | 3,762,840 | 726,119 |
| Events in quadrant C | 2,812,104 | 711,710 |
| Events in quadrant D | 6,546,431 | 584,155 |
| Mode M9 | |||
|---|---|---|---|
| Quadrant | BADHDUFLAG | Total packets | Discarded packets |
| A | 0 | 12 | 0 |
| B | 0 | 12 | 0 |
| C | 0 | 12 | 0 |
| D | 0 | 12 | 0 |
| Mode M0 | |||
|---|---|---|---|
| Quadrant | BADHDUFLAG | Total packets | Discarded packets |
| A | 0 | 19786 | 2 |
| B | 0 | 15046 | 1 |
| C | 0 | 12601 | 1 |
| D | 0 | 23662 | 1 |
| Mode SS | |||
|---|---|---|---|
| Quadrant | BADHDUFLAG | Total packets | Discarded packets |
| A | 0 | 124 | 0 |
| B | 0 | 124 | 0 |
| C | 0 | 124 | 0 |
| D | 0 | 124 | 0 |
| Quadrant | Total seconds | Saturated seconds | Saturation percentage |
|---|---|---|---|
| A | 6077 | 166 | 2.731611% |
| B | 6078 | 298 | 4.902929% |
| C | 6078 | 31 | 0.510036% |
| D | 6078 | 898 | 14.774597% |
Noise dominated data is calculated using 1-second bins in cleaned event files. If a bin has >2000 counts, and if more than 50% of those come from <1% of pixels, then it is considered to be noise-dominated and hence unusable.
| Quadrant | # 1 sec bins | Bins with >0 counts | Bins with >2000 counts | High rate bins dominated by noise | Noise dominated (total time) | Noise dominated (detector-on time) | Marked lightcurve |
|---|---|---|---|---|---|---|---|
| A | 7282 | 6078 | 10 | 10 | 0.14% | 0.16% | 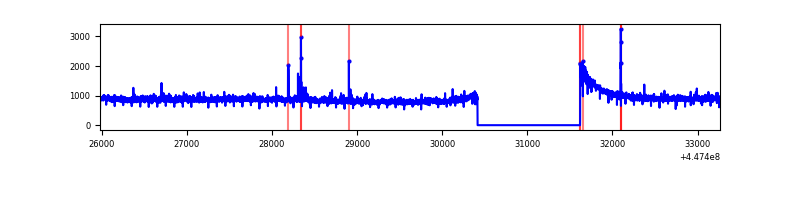 |
| B | 7283 | 6079 | 175 | 175 | 2.40% | 2.88% | 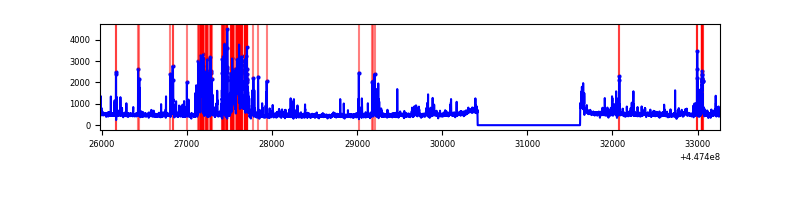 |
| C | 7283 | 6079 | 7 | 7 | 0.10% | 0.12% | 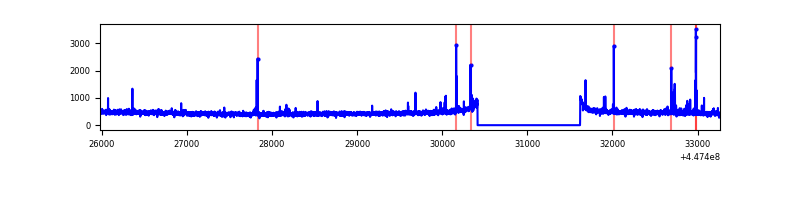 |
| D | 7283 | 6079 | 676 | 676 | 9.28% | 11.12% | 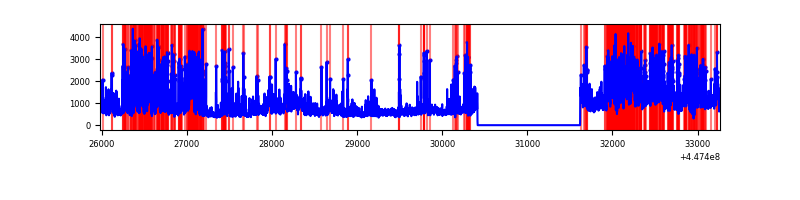 |
Top three noisy pixels from each quadrant. If the there are fewer than three noisy pixels in the level2.evt file, extra rows are filled as -1
| Pixel properties | Quadrant properties | ||||||
|---|---|---|---|---|---|---|---|
| Quadrant | DetID | PixID | Counts | Sigma | Mean | Median | Sigma |
| A | 10 | 83 | 2592113 | 17651.41 | 718 | 703 | 146.8 |
| A | 10 | 248 | 39322 | 263.05 | 718 | 703 | 146.8 |
| A | 0 | 243 | 31884 | 212.39 | 718 | 703 | 146.8 |
| B | 5 | 172 | 737666 | 5408.2 | 706 | 687 | 136.3 |
| B | 3 | 112 | 86798 | 631.91 | 706 | 687 | 136.3 |
| B | 0 | 186 | 47021 | 340.01 | 706 | 687 | 136.3 |
| C | 2 | 14 | 34605 | 207.15 | 698 | 700 | 163.7 |
| C | 14 | 254 | 31625 | 188.94 | 698 | 700 | 163.7 |
| C | 12 | 2 | 16050 | 93.78 | 698 | 700 | 163.7 |
| D | 11 | 241 | 1269156 | 7436.66 | 668 | 647 | 170.6 |
| D | 13 | 249 | 1225476 | 7180.58 | 668 | 647 | 170.6 |
| D | 1 | 52 | 958539 | 5615.66 | 668 | 647 | 170.6 |
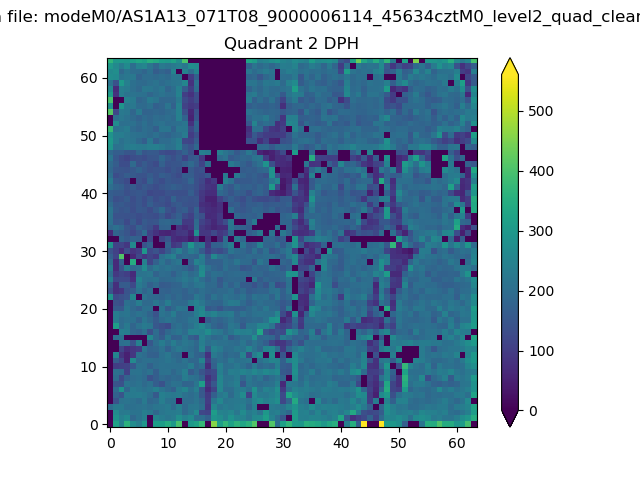
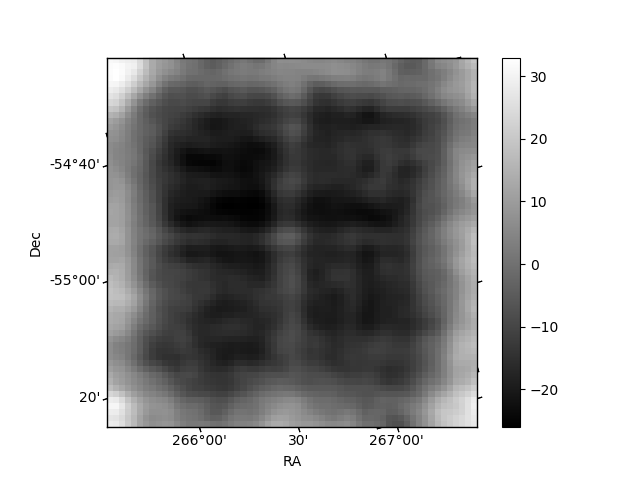
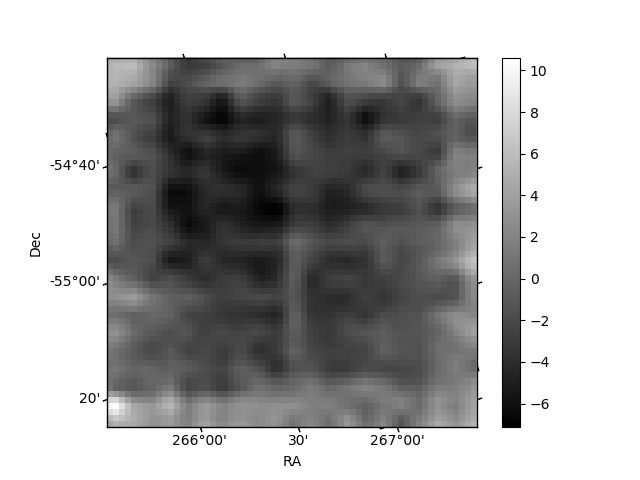
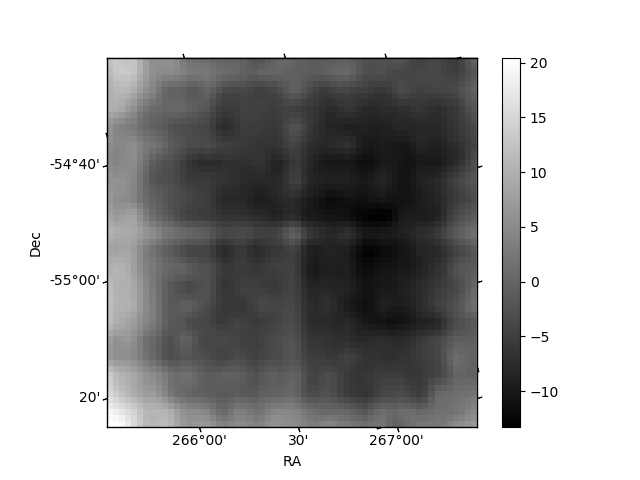
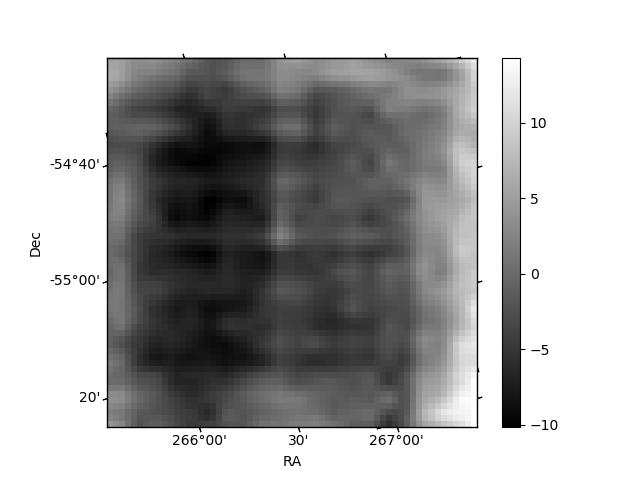
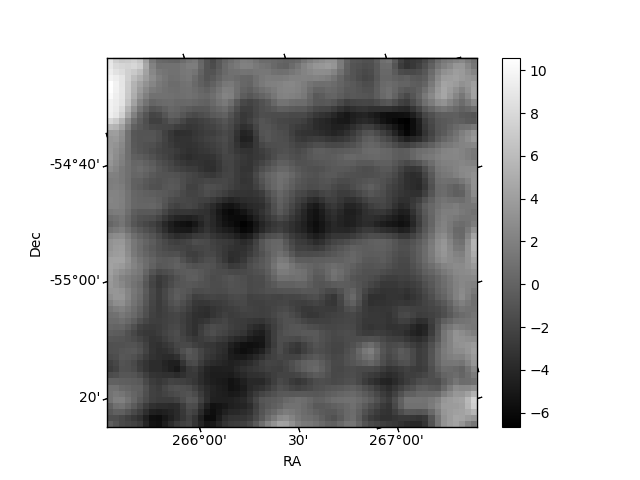
Histogram calculated using DETX and DETY for each event in the final _common_clean file
| Quadrant A | 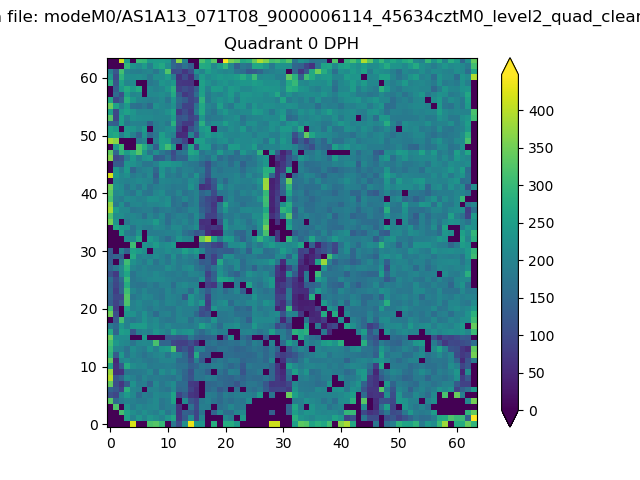 |
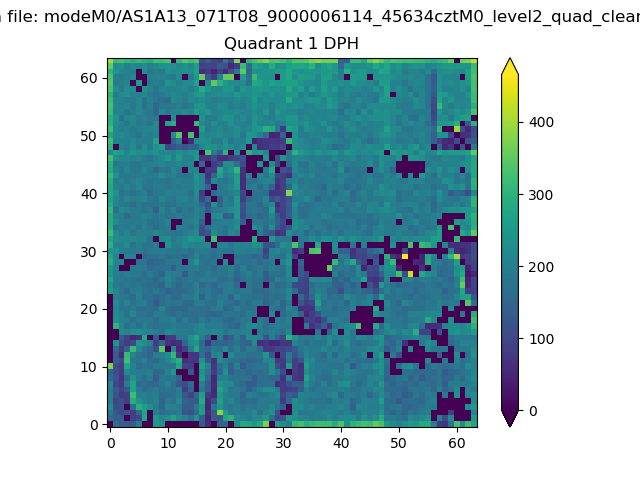 |
Quadrant B |
|---|---|---|---|
| Quadrant D | 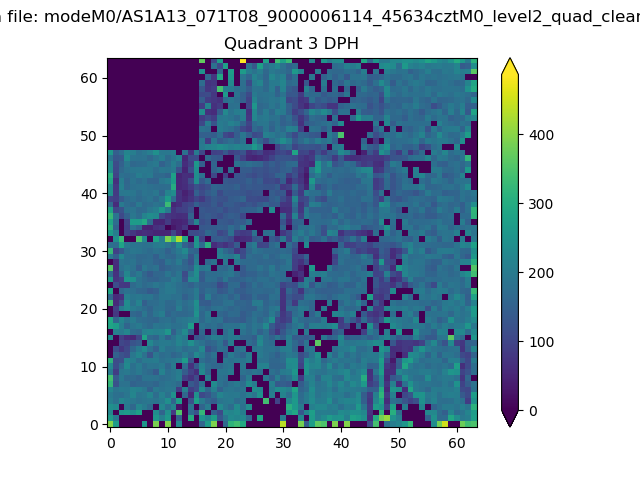 |
 |
Quadrant C |
| Plot type | Count rate plots | Images |
|---|---|---|
| Comparison with Poisson distribution Blue bars denote a histogram of data divided into 1 sec bins. Red curve is a Poisson curve with rate = median count rate of data. |
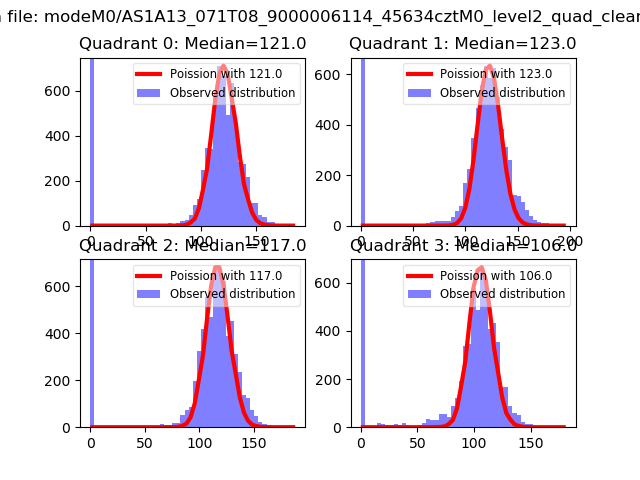 |
 |
| Quadrant-wise count rates Data is divided into 100 sec bins |
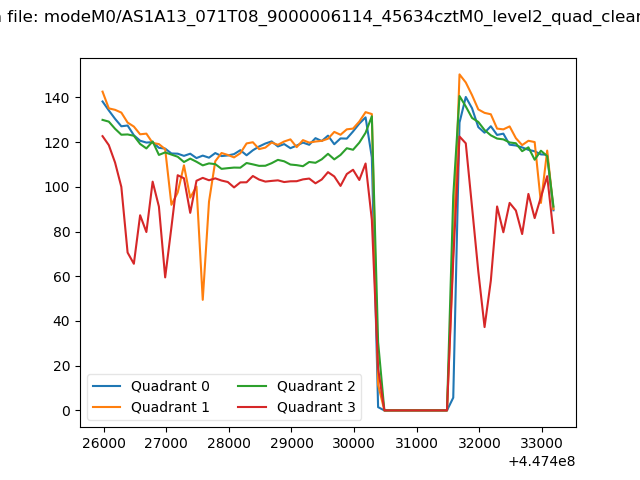 |
|
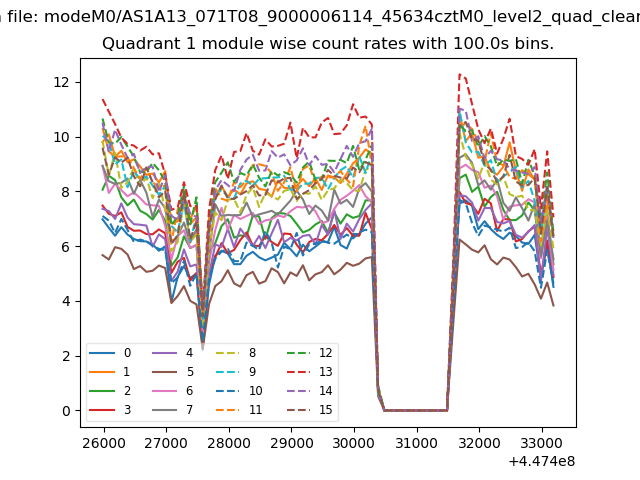
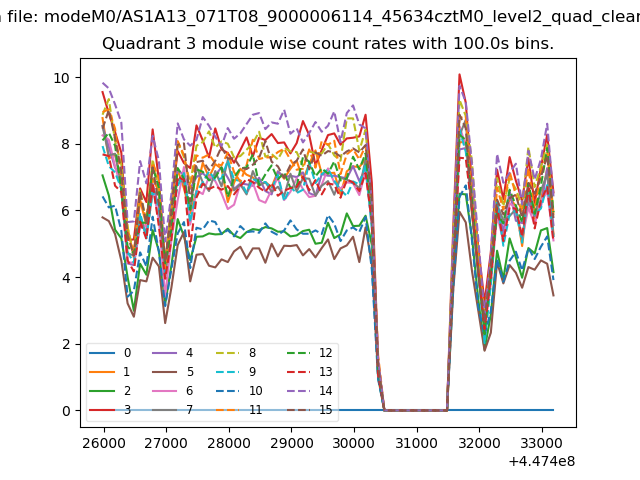
| Module-wise count rates for Quadrant A Data is divided into 100 sec bins |
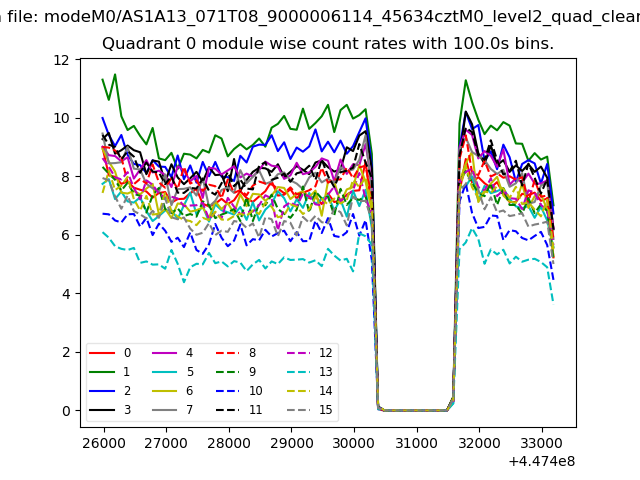 |
 |
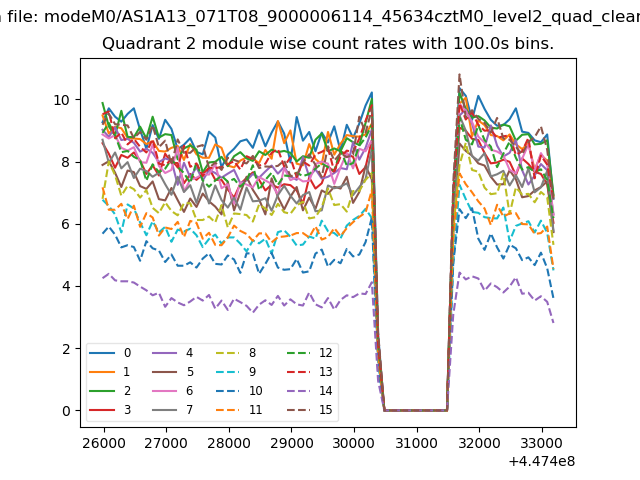
| Module-wise count rates for Quadrant B Data is divided into 100 sec bins |
 |
 |
| Module-wise count rates for Quadrant C Data is divided into 100 sec bins |
 |
 |
| Module-wise count rates for Quadrant D Data is divided into 100 sec bins |
 |
 |
| Parameter | Plot |
|---|---|
| CZT HV Monitor | 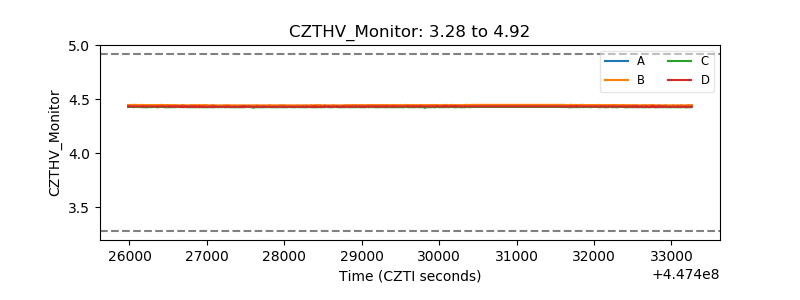 |
| D_VDD | 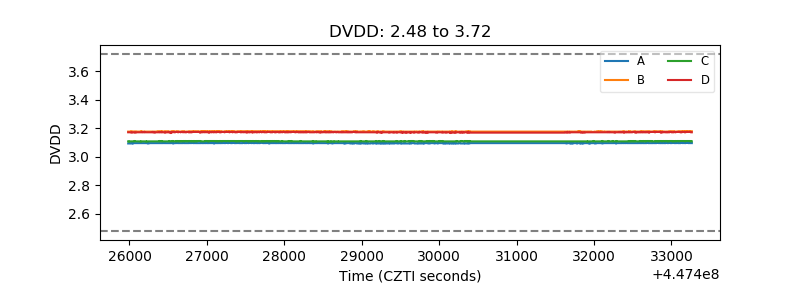 |
| Temperature 1 | 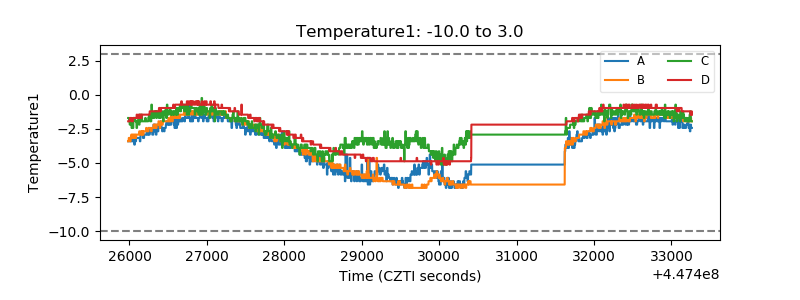 |
| Veto HV Monitor | 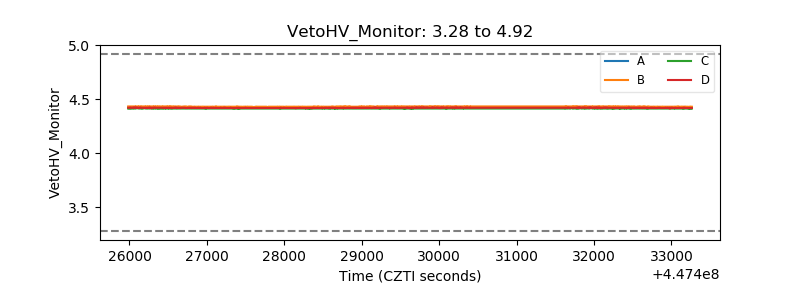 |
| Veto LLD | 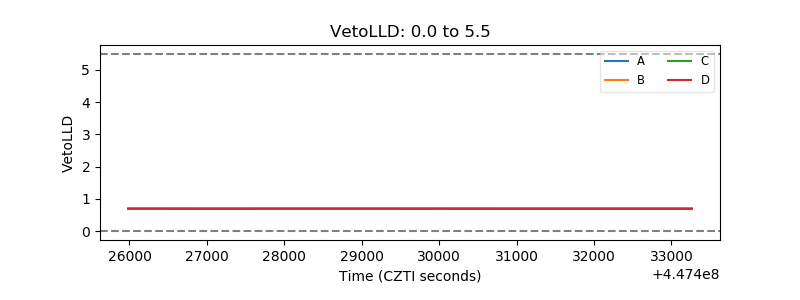 |
| Alpha Counter | 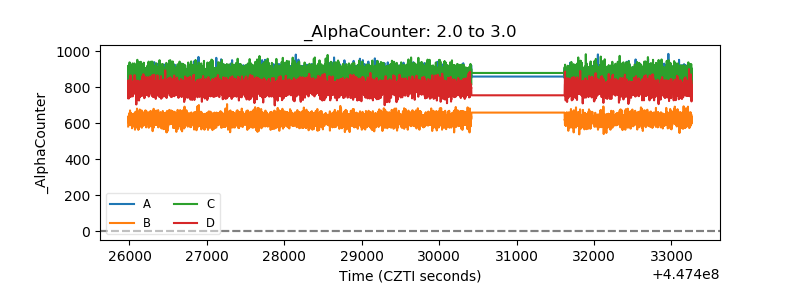 |
| _CPM_Rate | 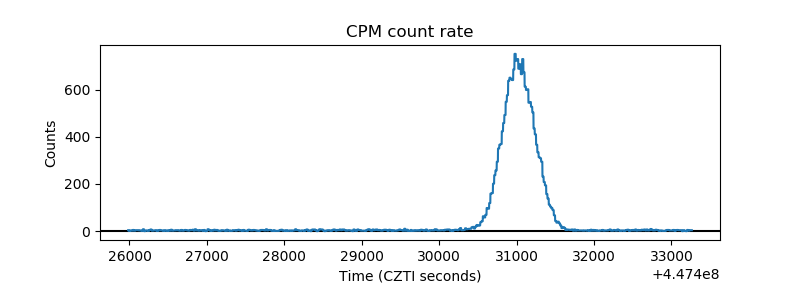 |
| CZT Counter | 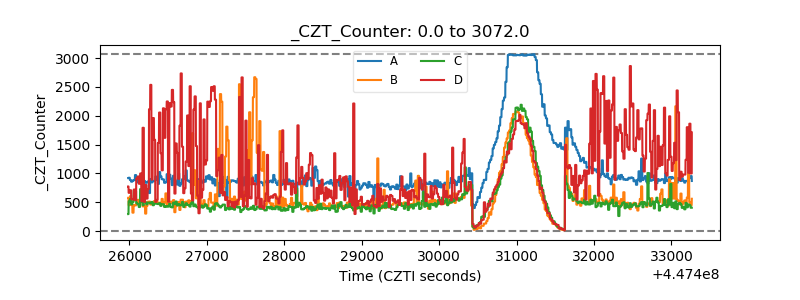 |
| +2.5 Volts monitor | 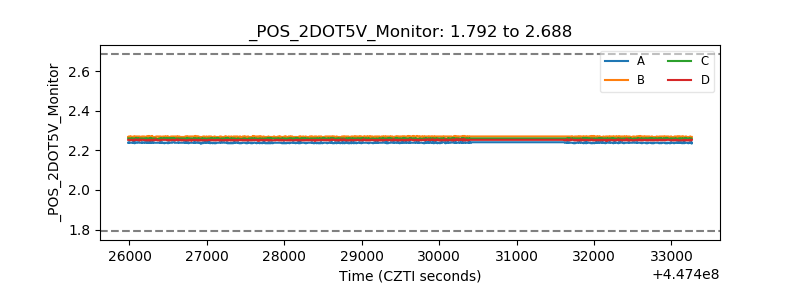 |
| +5 Volts monitor | 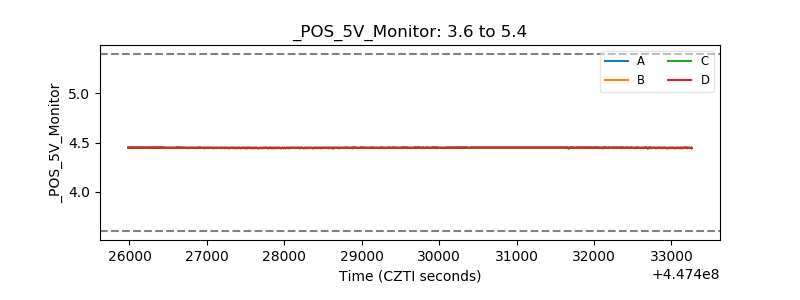 |
| _ROLL_ROT | 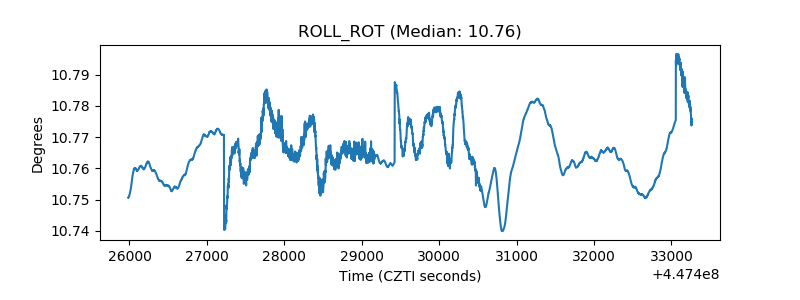 |
| _Roll_DEC | 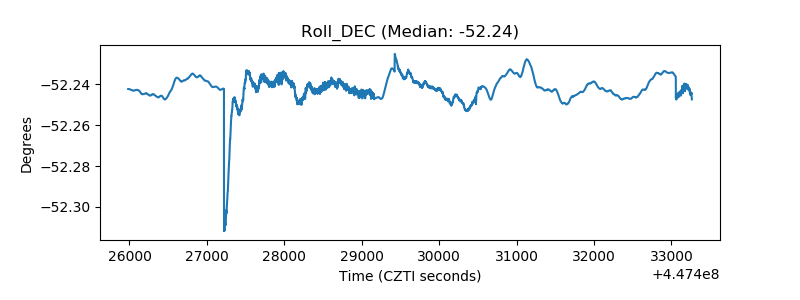 |
| _Roll_RA |  |
| Veto Counter | 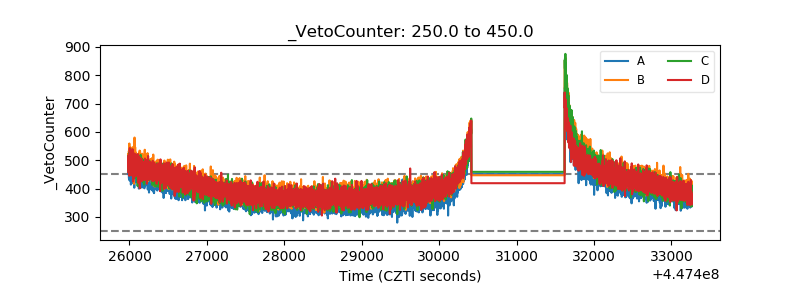 |