| Param | Original file | Final file |
|---|---|---|
| Filename | modeM0/AS1A13_071T08_9000006114_45637cztM0_level2.fits | modeM0/AS1A13_071T08_9000006114_45637cztM0_level2_quad_clean.evt |
| Size (bytes) | 604,892,160 | 115,577,280 |
| Size | 576.9 MB | 110.2 MB |
| Events in quadrant A | 6,466,452 | 775,421 |
| Events in quadrant B | 4,658,799 | 774,749 |
| Events in quadrant C | 3,305,995 | 783,954 |
| Events in quadrant D | 7,392,139 | 654,990 |
| Mode M9 | |||
|---|---|---|---|
| Quadrant | BADHDUFLAG | Total packets | Discarded packets |
| A | 0 | 2 | 0 |
| B | 0 | 2 | 0 |
| C | 0 | 2 | 0 |
| D | 0 | 2 | 0 |
| Mode M0 | |||
|---|---|---|---|
| Quadrant | BADHDUFLAG | Total packets | Discarded packets |
| A | 0 | 24251 | 3 |
| B | 0 | 18729 | 1 |
| C | 0 | 15280 | 1 |
| D | 0 | 27159 | 1 |
| Mode SS | |||
|---|---|---|---|
| Quadrant | BADHDUFLAG | Total packets | Discarded packets |
| A | 0 | 148 | 0 |
| B | 0 | 148 | 0 |
| C | 0 | 148 | 0 |
| D | 0 | 148 | 0 |
| Quadrant | Total seconds | Saturated seconds | Saturation percentage |
|---|---|---|---|
| A | 7328 | 343 | 4.680677% |
| B | 7328 | 522 | 7.123362% |
| C | 7329 | 55 | 0.750443% |
| D | 7329 | 836 | 11.406740% |
Noise dominated data is calculated using 1-second bins in cleaned event files. If a bin has >2000 counts, and if more than 50% of those come from <1% of pixels, then it is considered to be noise-dominated and hence unusable.
| Quadrant | # 1 sec bins | Bins with >0 counts | Bins with >2000 counts | High rate bins dominated by noise | Noise dominated (total time) | Noise dominated (detector-on time) | Marked lightcurve |
|---|---|---|---|---|---|---|---|
| A | 7568 | 7330 | 8 | 8 | 0.11% | 0.11% | 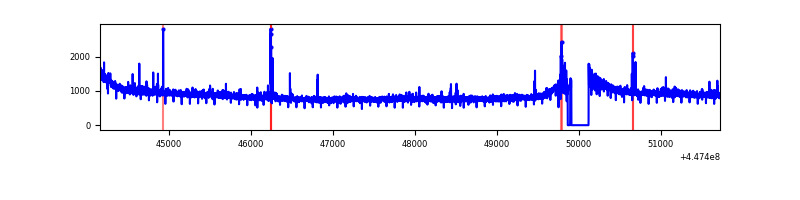 |
| B | 7568 | 7329 | 227 | 227 | 3.00% | 3.10% | 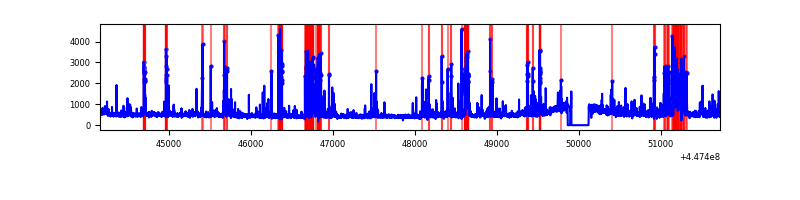 |
| C | 7569 | 7331 | 6 | 6 | 0.08% | 0.08% | 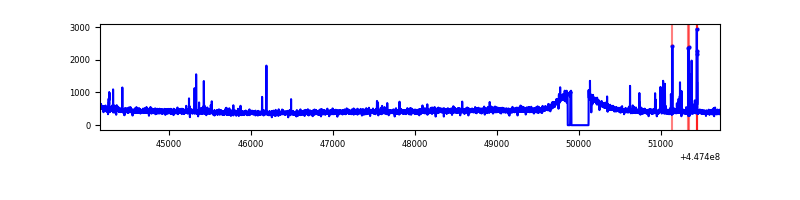 |
| D | 7569 | 7330 | 585 | 585 | 7.73% | 7.98% | 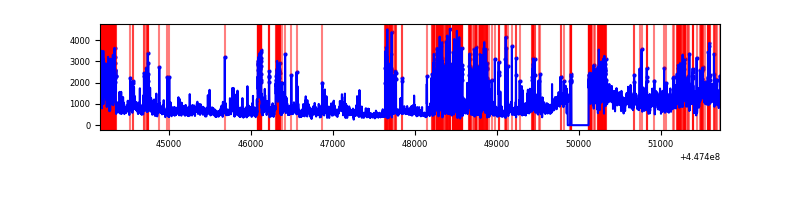 |
Top three noisy pixels from each quadrant. If the there are fewer than three noisy pixels in the level2.evt file, extra rows are filled as -1
| Pixel properties | Quadrant properties | ||||||
|---|---|---|---|---|---|---|---|
| Quadrant | DetID | PixID | Counts | Sigma | Mean | Median | Sigma |
| A | 10 | 83 | 3109474 | 17840.62 | 837 | 816 | 174.2 |
| A | 13 | 248 | 66751 | 378.4 | 837 | 816 | 174.2 |
| A | 0 | 243 | 23776 | 131.77 | 837 | 816 | 174.2 |
| B | 3 | 112 | 683631 | 4214.45 | 826 | 802 | 162.0 |
| B | 5 | 172 | 395147 | 2433.92 | 826 | 802 | 162.0 |
| B | 0 | 186 | 52352 | 318.17 | 826 | 802 | 162.0 |
| C | 14 | 254 | 49705 | 252.75 | 823 | 829 | 193.4 |
| C | 2 | 14 | 18225 | 89.96 | 823 | 829 | 193.4 |
| C | 3 | 233 | 12596 | 60.85 | 823 | 829 | 193.4 |
| D | 11 | 241 | 1839921 | 9212.31 | 783 | 754 | 199.6 |
| D | 1 | 52 | 936301 | 4686.12 | 783 | 754 | 199.6 |
| D | 8 | 129 | 584160 | 2922.26 | 783 | 754 | 199.6 |
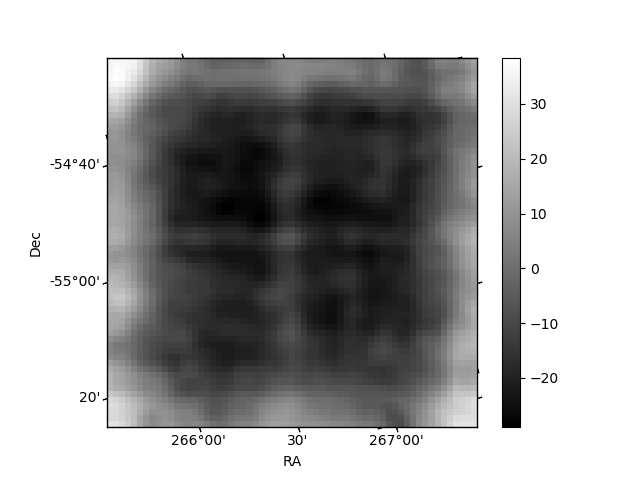
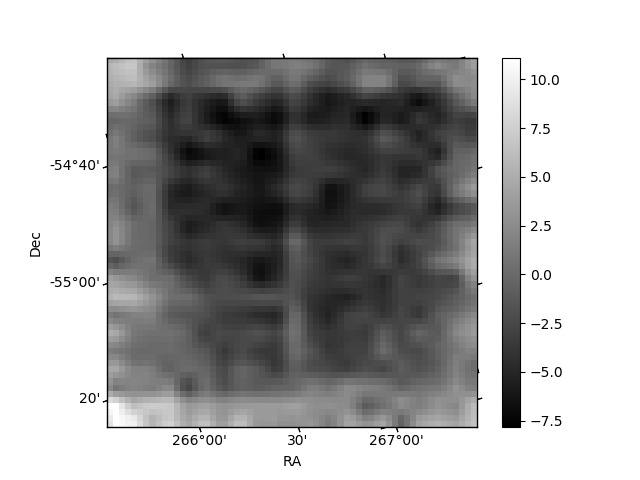
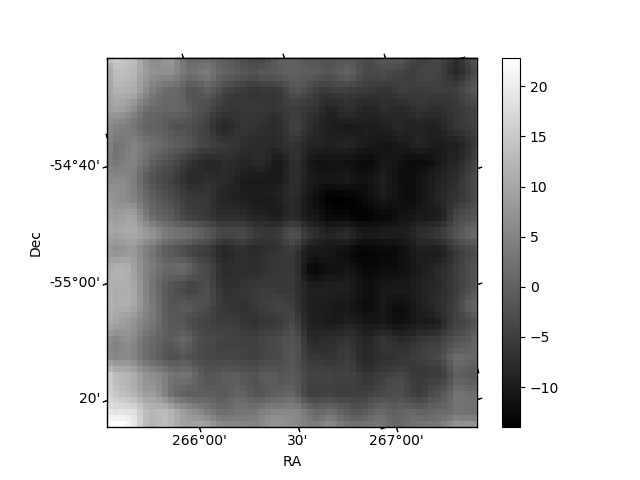
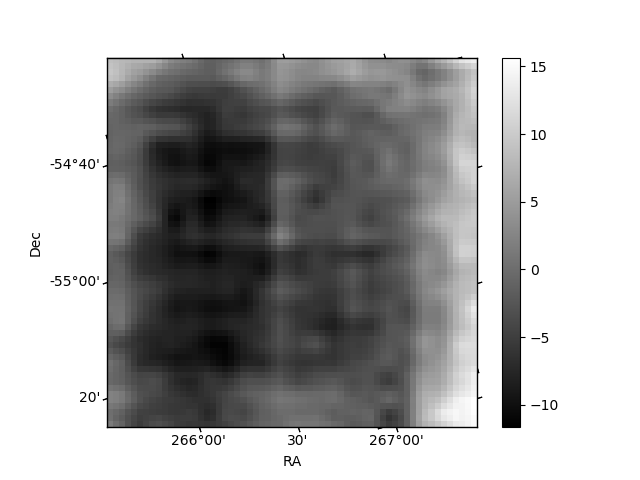
Histogram calculated using DETX and DETY for each event in the final _common_clean file
| Quadrant A | 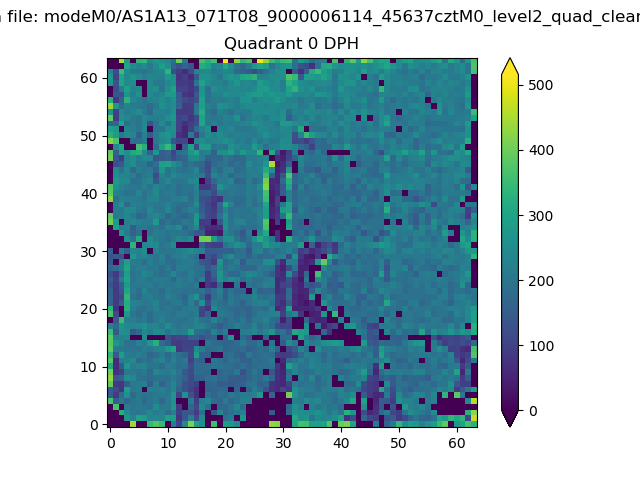 |
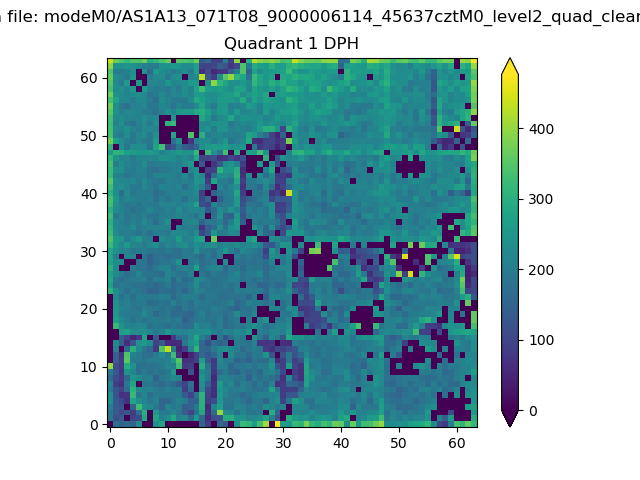 |
Quadrant B |
|---|---|---|---|
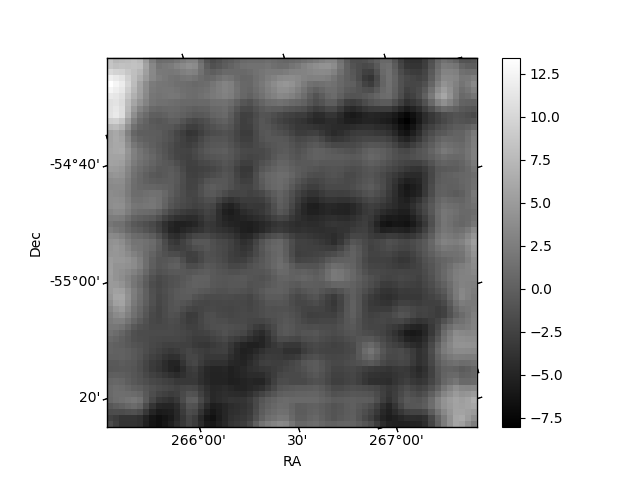
| Quadrant D | 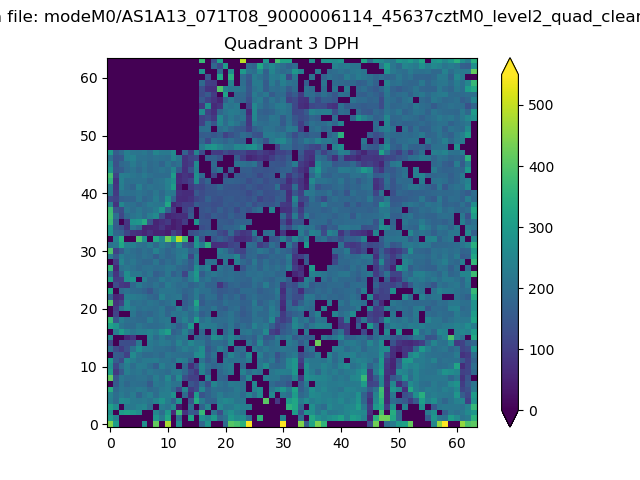 |
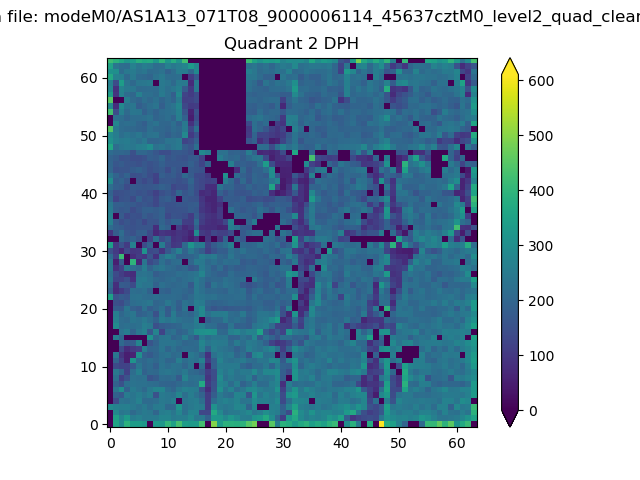 |
Quadrant C |
| Plot type | Count rate plots | Images |
|---|---|---|
| Comparison with Poisson distribution Blue bars denote a histogram of data divided into 1 sec bins. Red curve is a Poisson curve with rate = median count rate of data. |
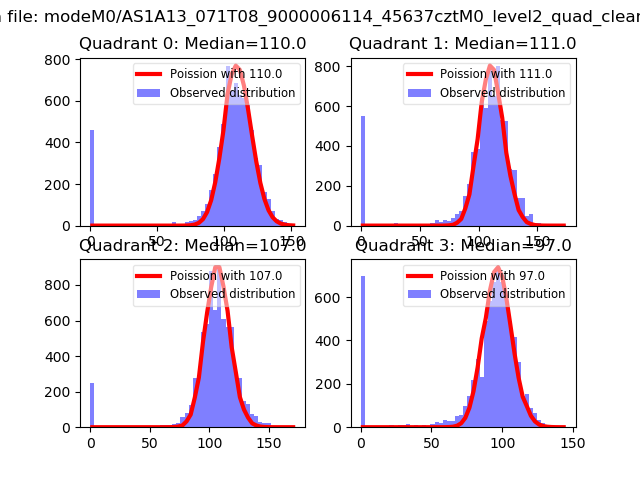 |
 |
| Quadrant-wise count rates Data is divided into 100 sec bins |
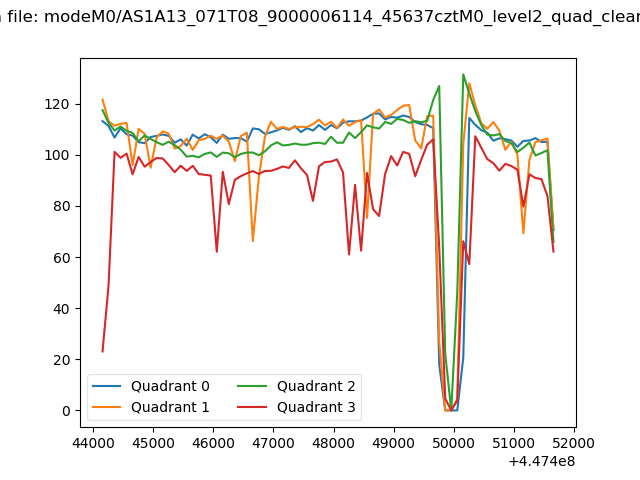 |
|
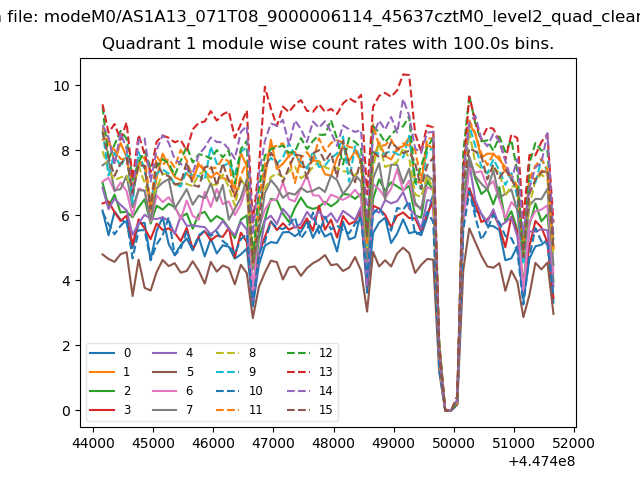
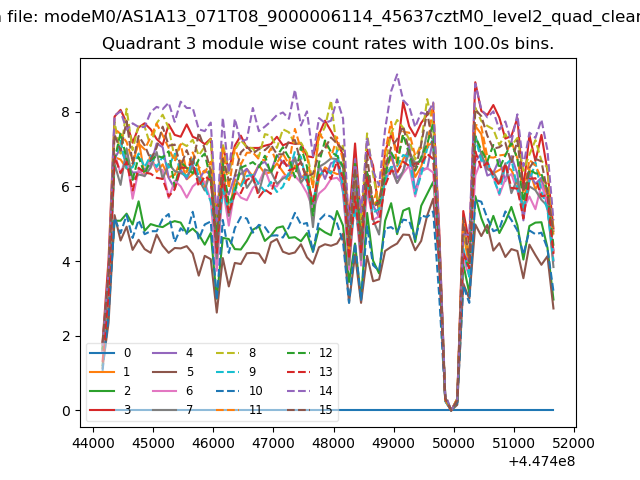
| Module-wise count rates for Quadrant A Data is divided into 100 sec bins |
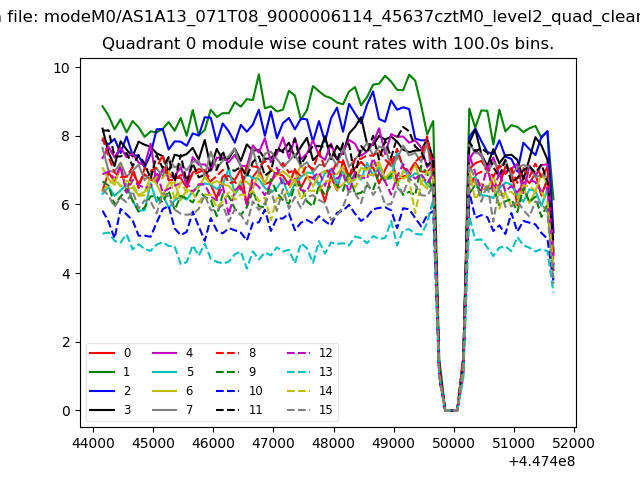 |
 |
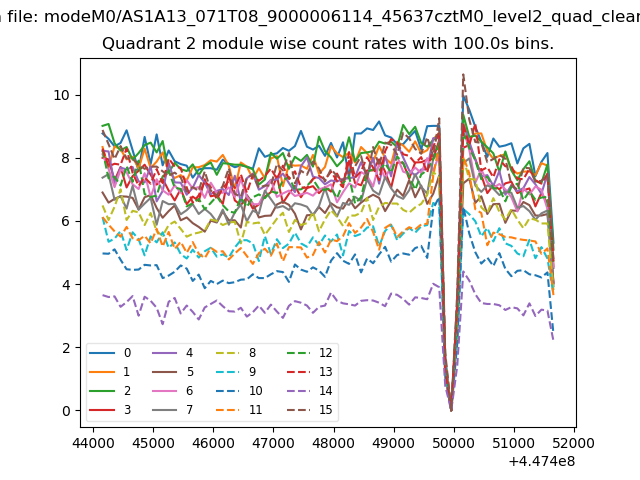
| Module-wise count rates for Quadrant B Data is divided into 100 sec bins |
 |
 |
| Module-wise count rates for Quadrant C Data is divided into 100 sec bins |
 |
 |
| Module-wise count rates for Quadrant D Data is divided into 100 sec bins |
 |
 |
| Parameter | Plot |
|---|---|
| CZT HV Monitor | 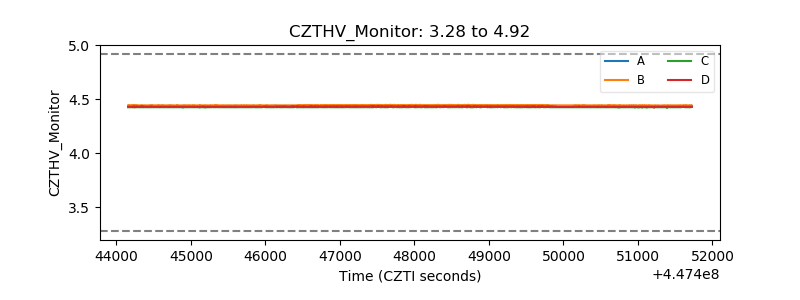 |
| D_VDD | 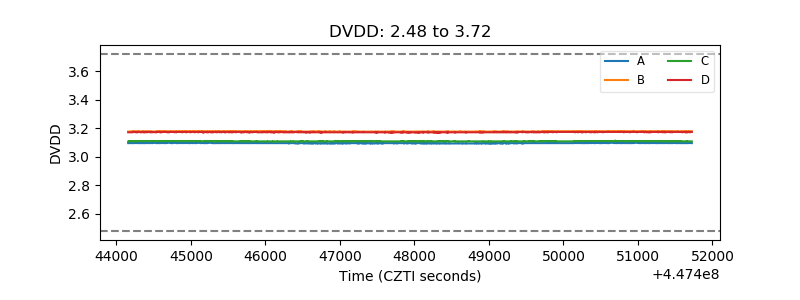 |
| Temperature 1 | 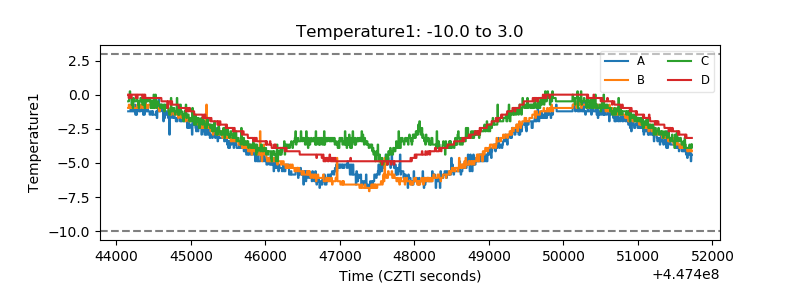 |
| Veto HV Monitor | 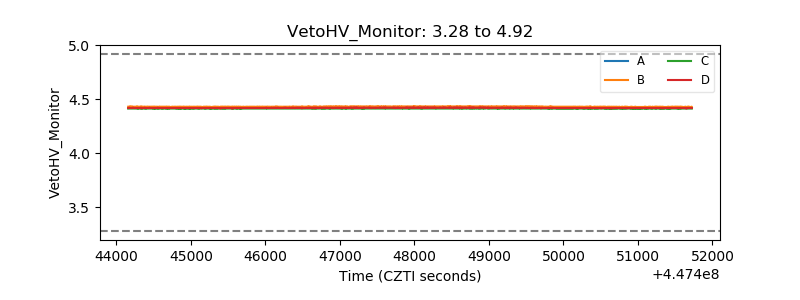 |
| Veto LLD | 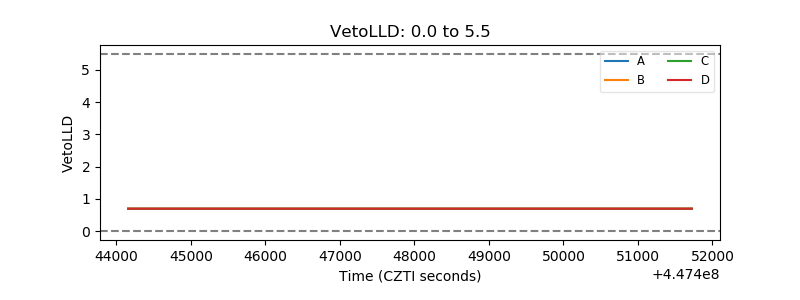 |
| Alpha Counter | 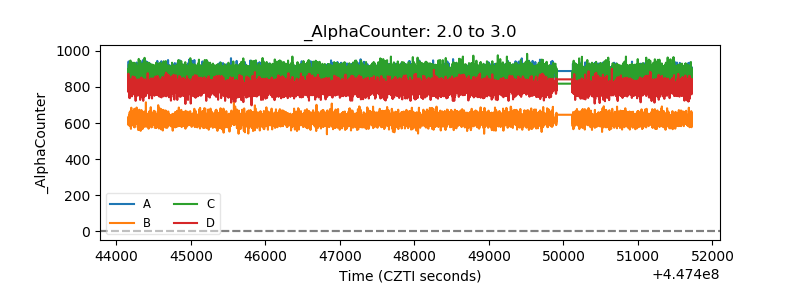 |
| _CPM_Rate | 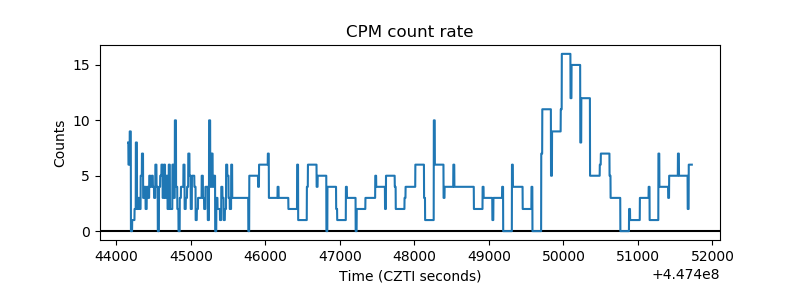 |
| CZT Counter | 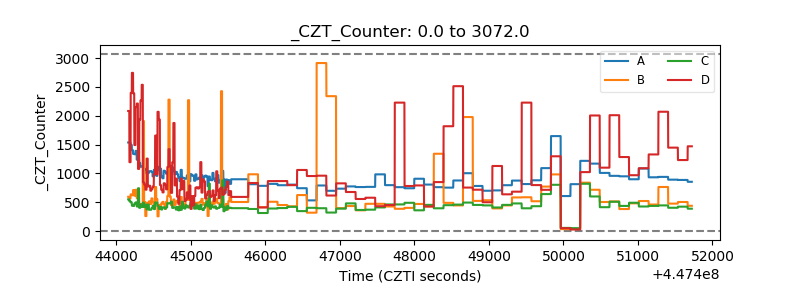 |
| +2.5 Volts monitor | 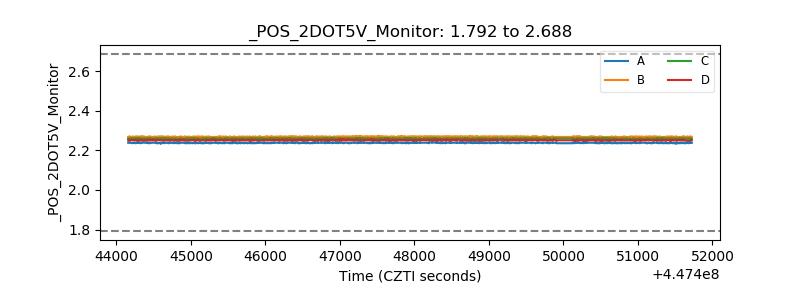 |
| +5 Volts monitor | 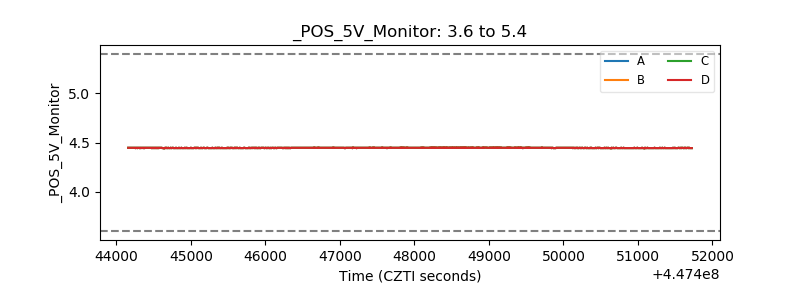 |
| _ROLL_ROT | 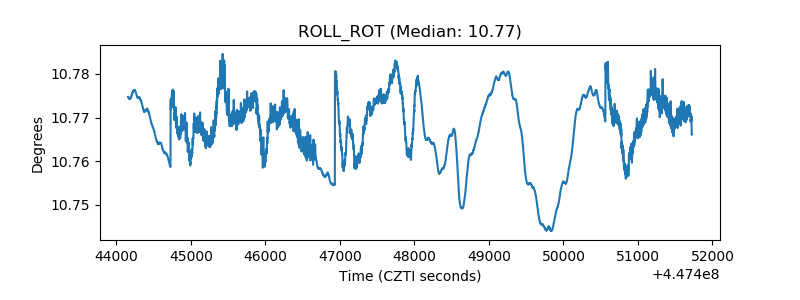 |
| _Roll_DEC | 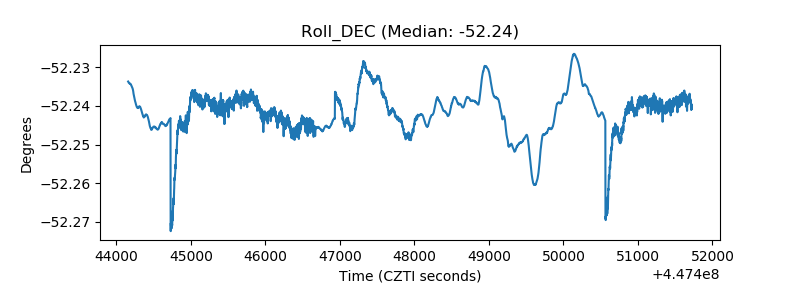 |
| _Roll_RA | 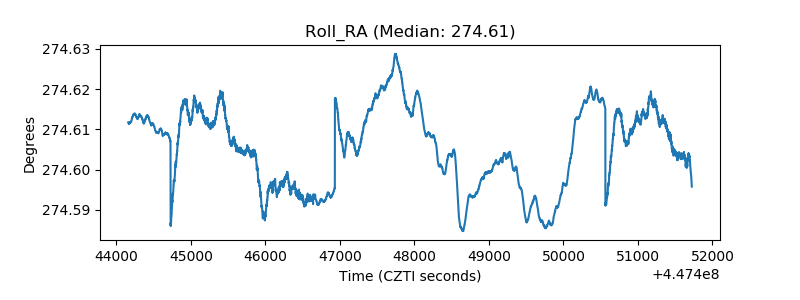 |
| Veto Counter | 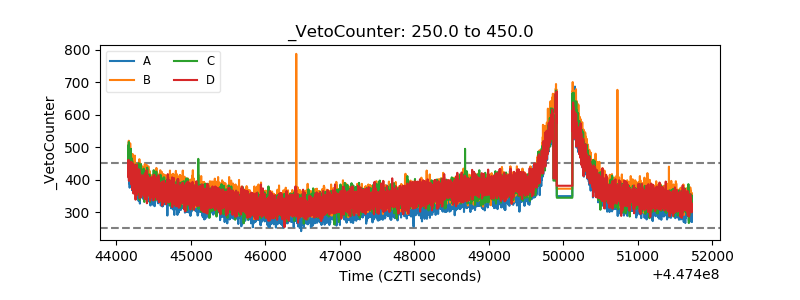 |