| Param | Original file | Final file |
|---|---|---|
| Filename | modeM0/AS1A13_071T08_9000006114_45645cztM0_level2.fits | modeM0/AS1A13_071T08_9000006114_45645cztM0_level2_quad_clean.evt |
| Size (bytes) | 1,010,119,680 | 198,181,440 |
| Size | 963.3 MB | 189.0 MB |
| Events in quadrant A | 11,005,485 | 1,334,516 |
| Events in quadrant B | 6,504,947 | 1,377,421 |
| Events in quadrant C | 5,771,165 | 1,322,838 |
| Events in quadrant D | 13,131,647 | 1,089,950 |
| Mode M9 | |||
|---|---|---|---|
| Quadrant | BADHDUFLAG | Total packets | Discarded packets |
| A | 0 | 6 | 0 |
| B | 0 | 6 | 0 |
| C | 0 | 6 | 0 |
| D | 0 | 6 | 0 |
| Mode M0 | |||
|---|---|---|---|
| Quadrant | BADHDUFLAG | Total packets | Discarded packets |
| A | 0 | 41751 | 5 |
| B | 0 | 28102 | 2 |
| C | 0 | 26559 | 2 |
| D | 0 | 47910 | 2 |
| Mode SS | |||
|---|---|---|---|
| Quadrant | BADHDUFLAG | Total packets | Discarded packets |
| A | 0 | 258 | 0 |
| B | 0 | 258 | 0 |
| C | 0 | 258 | 0 |
| D | 0 | 258 | 0 |
| Quadrant | Total seconds | Saturated seconds | Saturation percentage |
|---|---|---|---|
| A | 12656 | 373 | 2.947219% |
| B | 12657 | 251 | 1.983092% |
| C | 12657 | 77 | 0.608359% |
| D | 12657 | 1605 | 12.680730% |
Noise dominated data is calculated using 1-second bins in cleaned event files. If a bin has >2000 counts, and if more than 50% of those come from <1% of pixels, then it is considered to be noise-dominated and hence unusable.
| Quadrant | # 1 sec bins | Bins with >0 counts | Bins with >2000 counts | High rate bins dominated by noise | Noise dominated (total time) | Noise dominated (detector-on time) | Marked lightcurve |
|---|---|---|---|---|---|---|---|
| A | 13296 | 12658 | 32 | 32 | 0.24% | 0.25% | 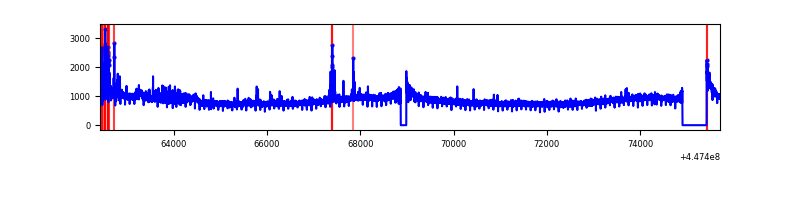 |
| B | 13297 | 12659 | 71 | 71 | 0.53% | 0.56% | 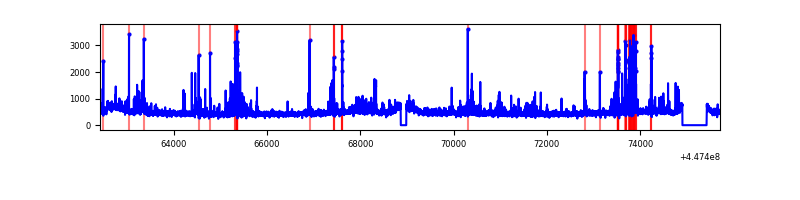 |
| C | 13297 | 12659 | 16 | 16 | 0.12% | 0.13% | 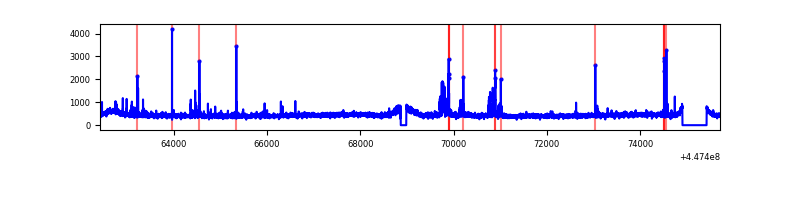 |
| D | 13296 | 12658 | 1178 | 1178 | 8.86% | 9.31% | 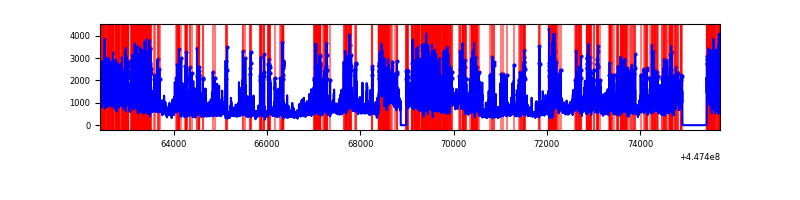 |
Top three noisy pixels from each quadrant. If the there are fewer than three noisy pixels in the level2.evt file, extra rows are filled as -1
| Pixel properties | Quadrant properties | ||||||
|---|---|---|---|---|---|---|---|
| Quadrant | DetID | PixID | Counts | Sigma | Mean | Median | Sigma |
| A | 10 | 83 | 5146789 | 17539.82 | 1415 | 1380 | 293.4 |
| A | 12 | 189 | 167391 | 565.9 | 1415 | 1380 | 293.4 |
| A | 10 | 248 | 61556 | 205.13 | 1415 | 1380 | 293.4 |
| B | 5 | 172 | 260637 | 927.98 | 1421 | 1375 | 279.4 |
| B | 3 | 112 | 144864 | 513.59 | 1421 | 1375 | 279.4 |
| B | 0 | 190 | 93850 | 331.0 | 1421 | 1375 | 279.4 |
| C | 2 | 14 | 188670 | 567.86 | 1398 | 1402 | 329.8 |
| C | 14 | 254 | 49837 | 146.87 | 1398 | 1402 | 329.8 |
| C | 1 | 3 | 23833 | 68.02 | 1398 | 1402 | 329.8 |
| D | 12 | 32 | 2872169 | 8449.78 | 1338 | 1296 | 339.8 |
| D | 11 | 241 | 2132472 | 6272.64 | 1338 | 1296 | 339.8 |
| D | 1 | 52 | 979000 | 2877.65 | 1338 | 1296 | 339.8 |
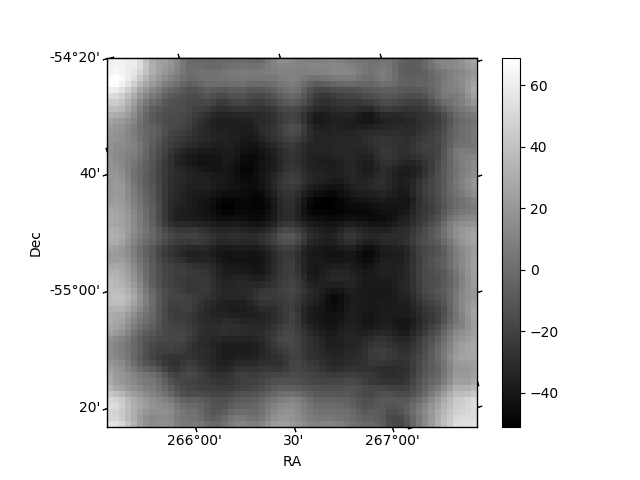
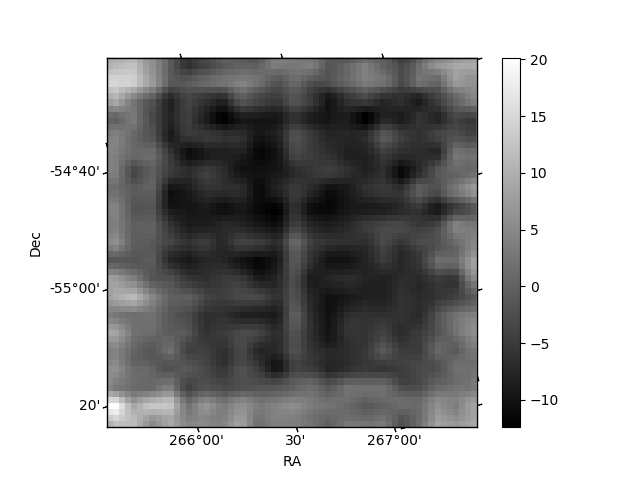
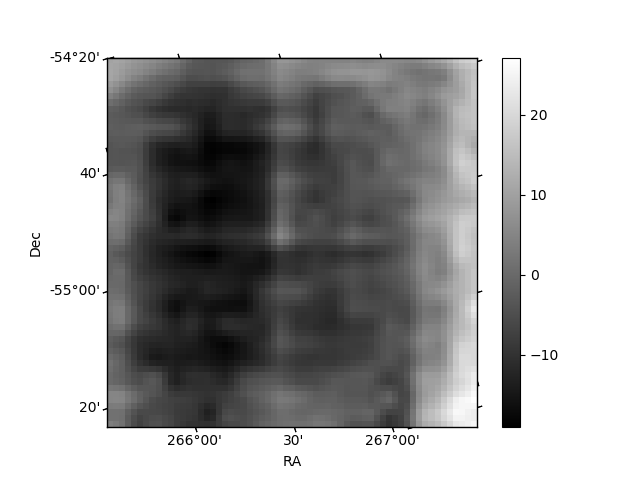
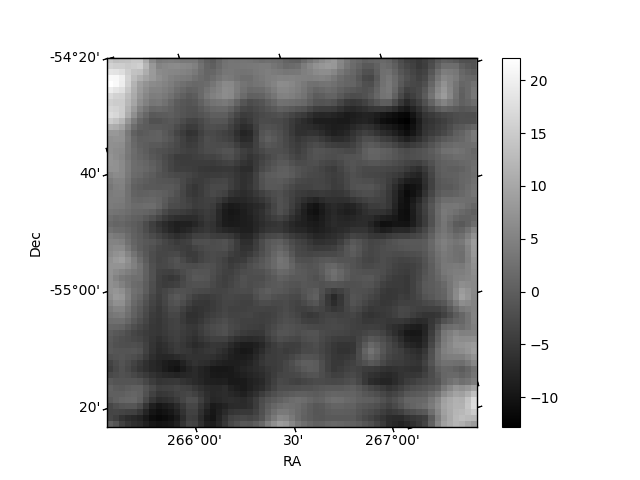
Histogram calculated using DETX and DETY for each event in the final _common_clean file
| Quadrant A | 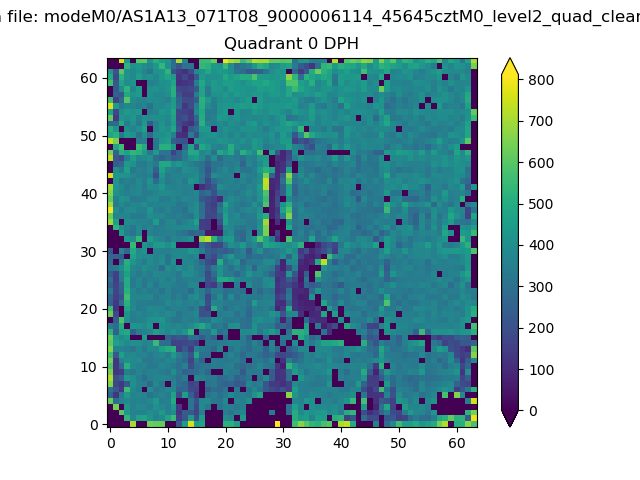 |
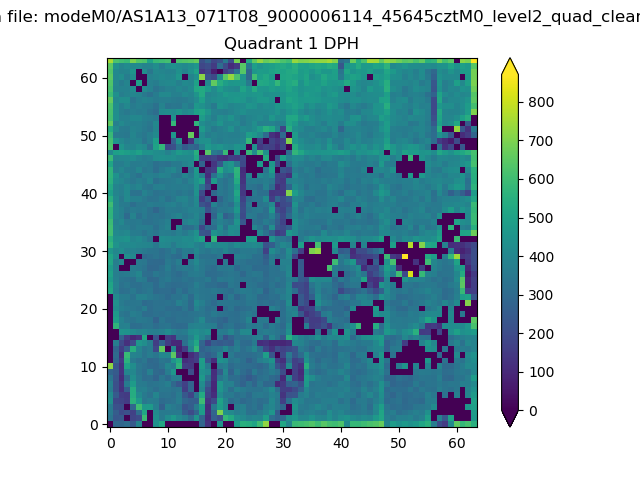 |
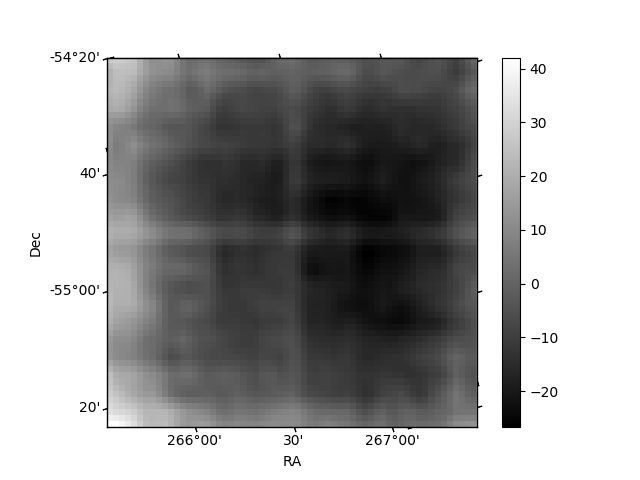
Quadrant B |
|---|---|---|---|
| Quadrant D | 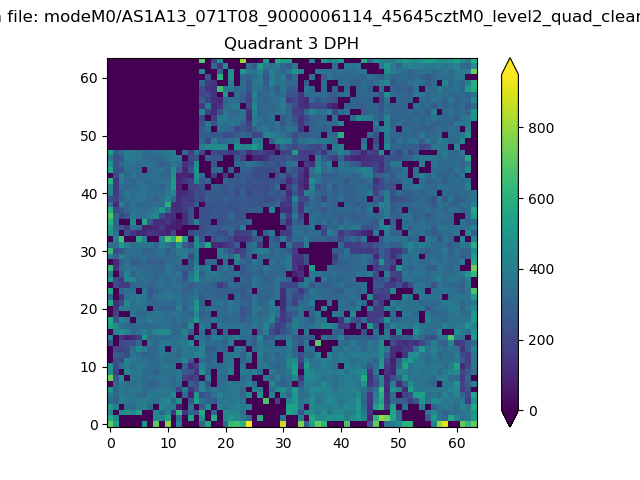 |
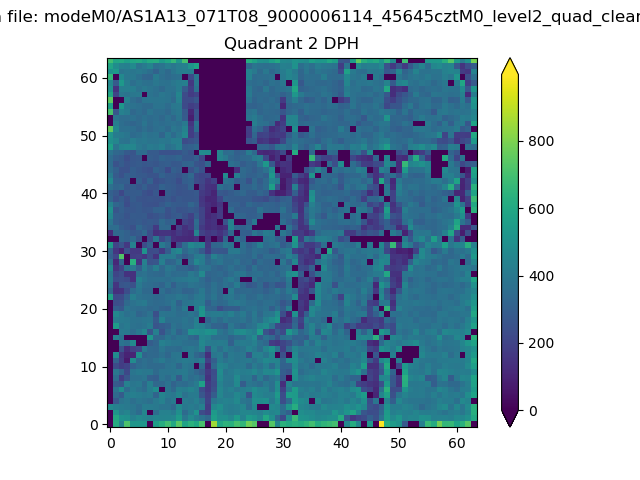 |
Quadrant C |
| Plot type | Count rate plots | Images |
|---|---|---|
| Comparison with Poisson distribution Blue bars denote a histogram of data divided into 1 sec bins. Red curve is a Poisson curve with rate = median count rate of data. |
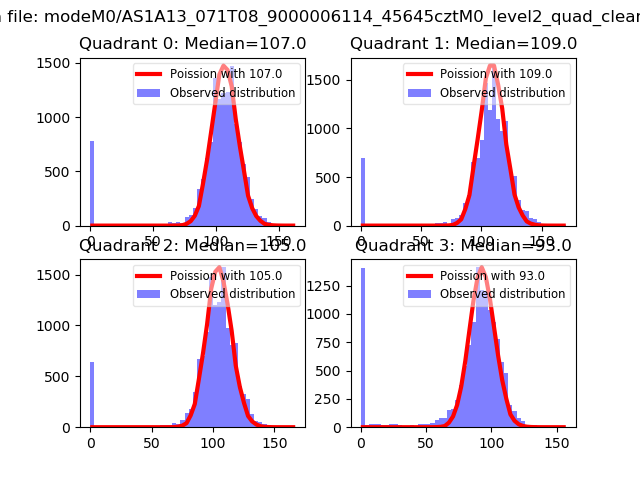 |
 |
| Quadrant-wise count rates Data is divided into 100 sec bins |
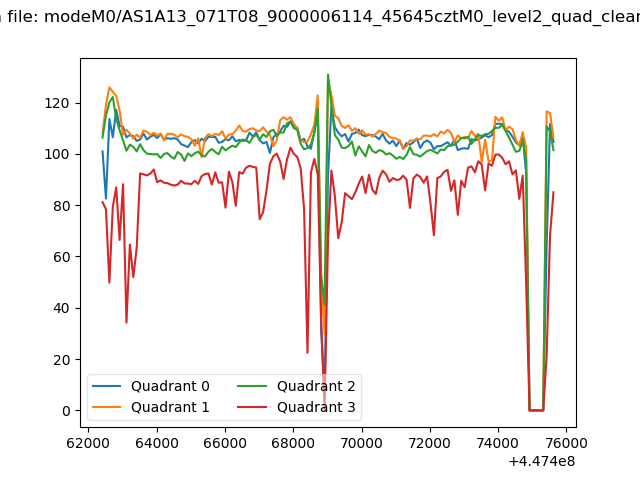 |
|
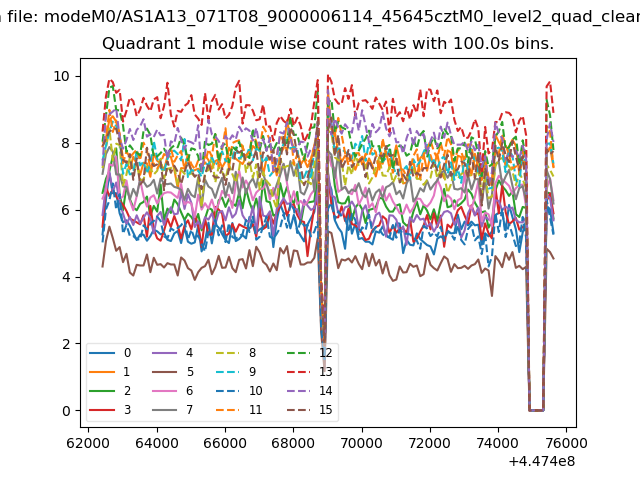
| Module-wise count rates for Quadrant A Data is divided into 100 sec bins |
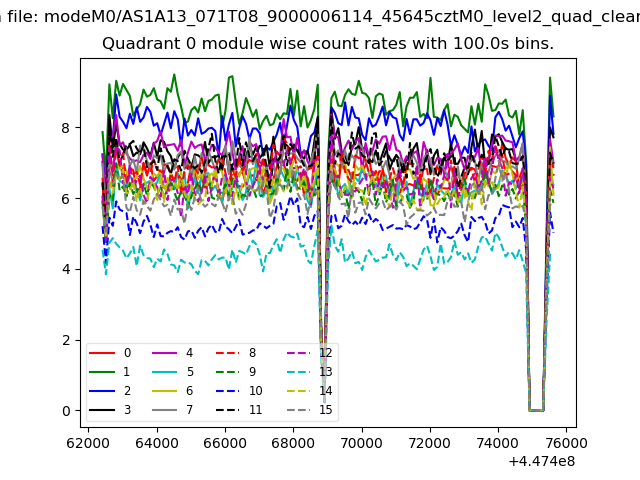 |
 |
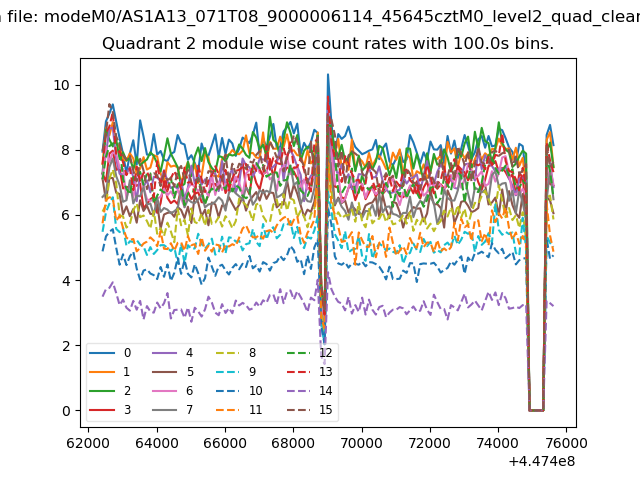
| Module-wise count rates for Quadrant B Data is divided into 100 sec bins |
 |
 |
| Module-wise count rates for Quadrant C Data is divided into 100 sec bins |
 |
 |
| Module-wise count rates for Quadrant D Data is divided into 100 sec bins |
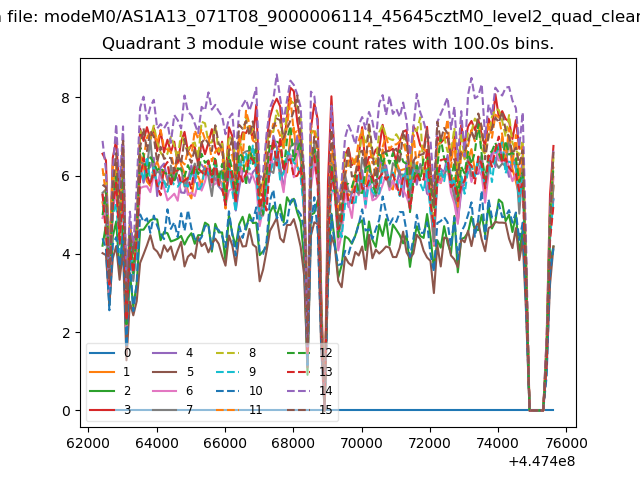 |
 |
| Parameter | Plot |
|---|---|
| CZT HV Monitor | 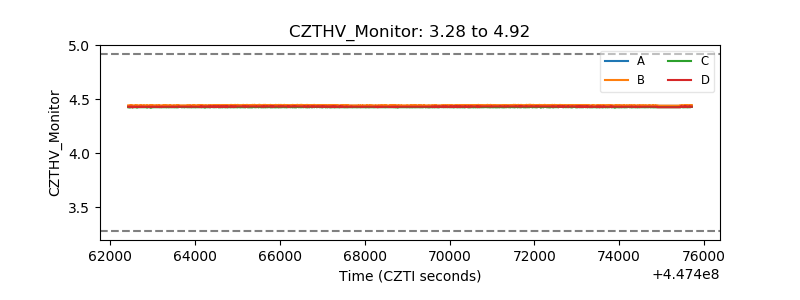 |
| D_VDD | 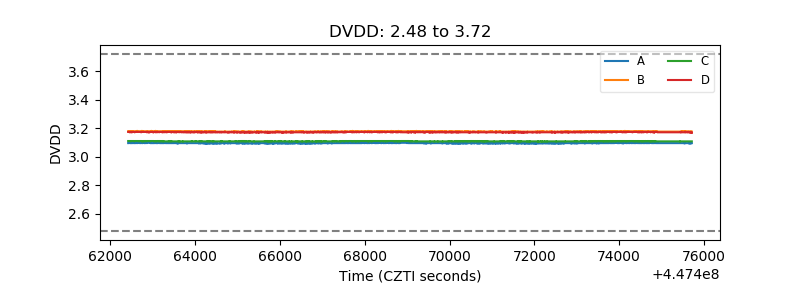 |
| Temperature 1 | 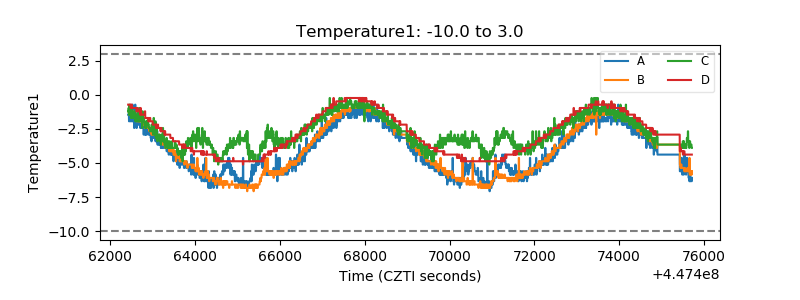 |
| Veto HV Monitor | 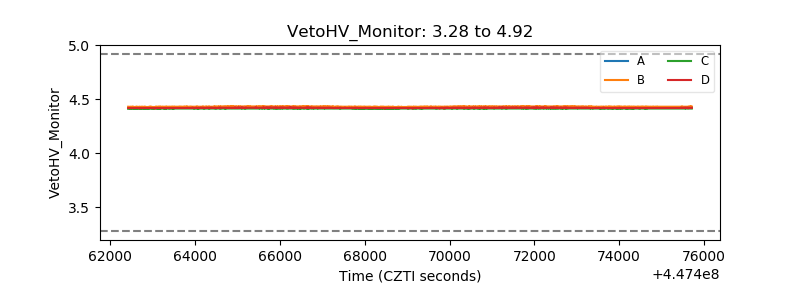 |
| Veto LLD | 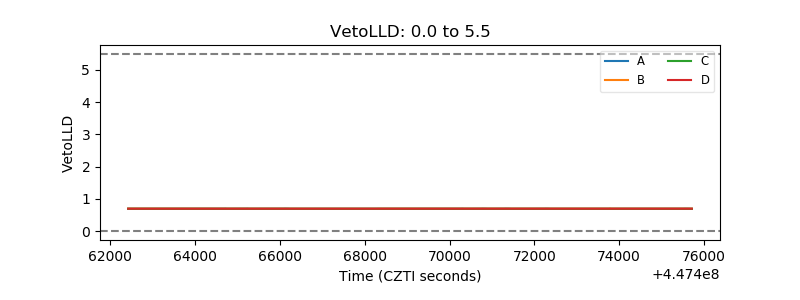 |
| Alpha Counter | 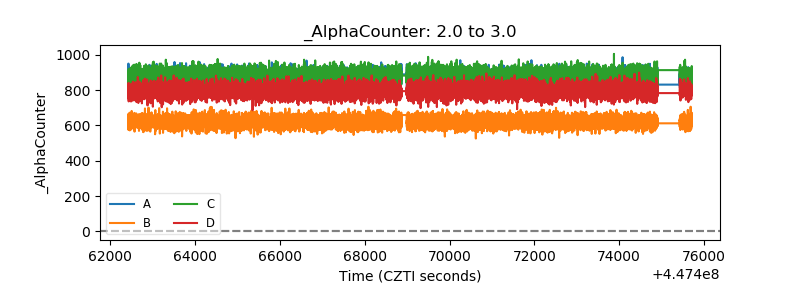 |
| _CPM_Rate | 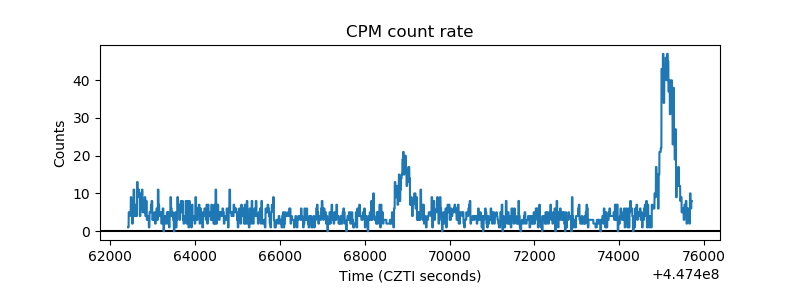 |
| CZT Counter | 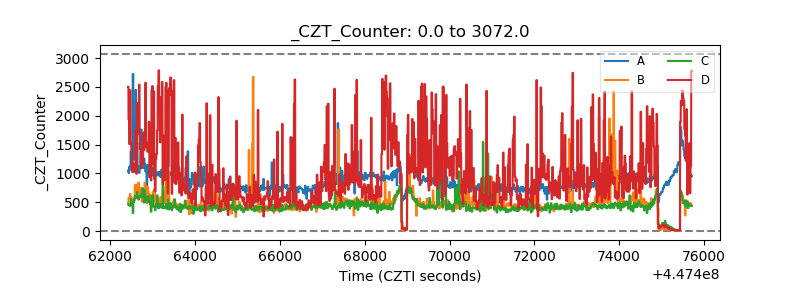 |
| +2.5 Volts monitor | 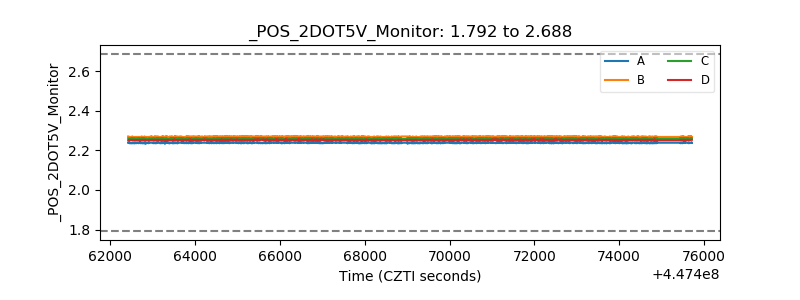 |
| +5 Volts monitor | 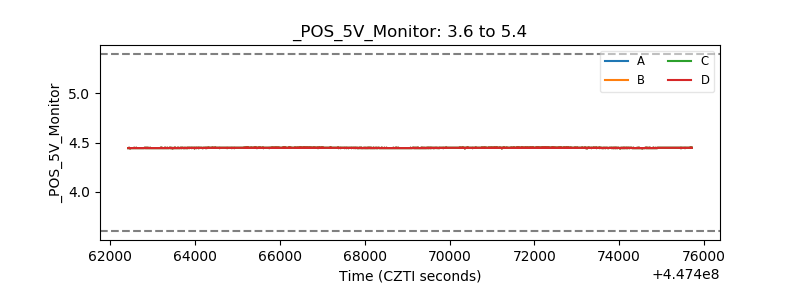 |
| _ROLL_ROT | 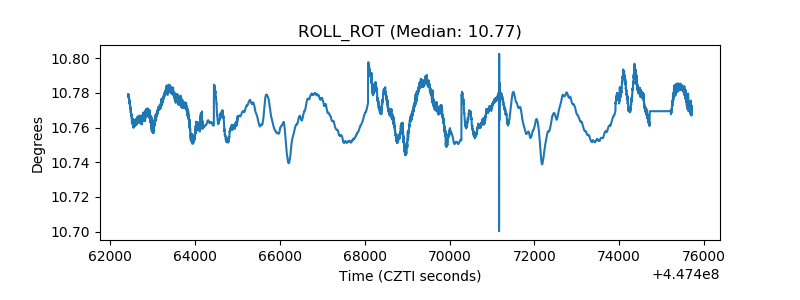 |
| _Roll_DEC | 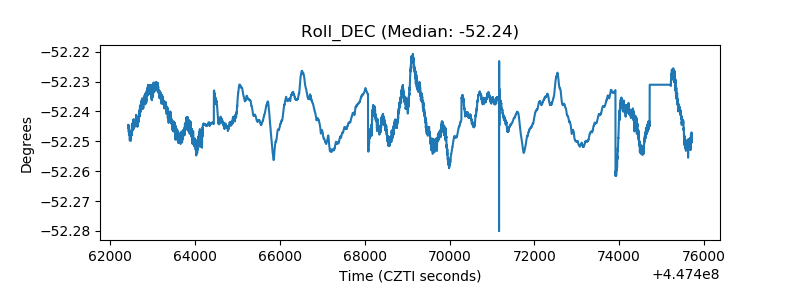 |
| _Roll_RA | 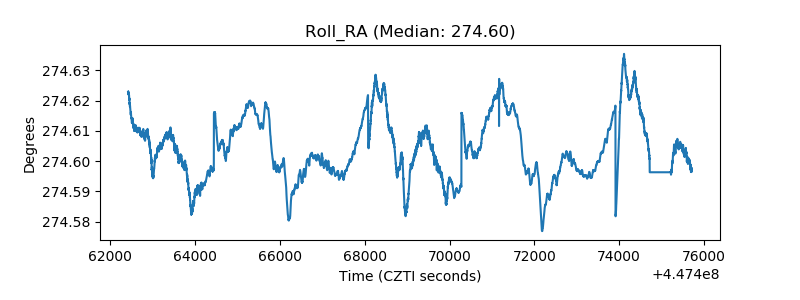 |
| Veto Counter | 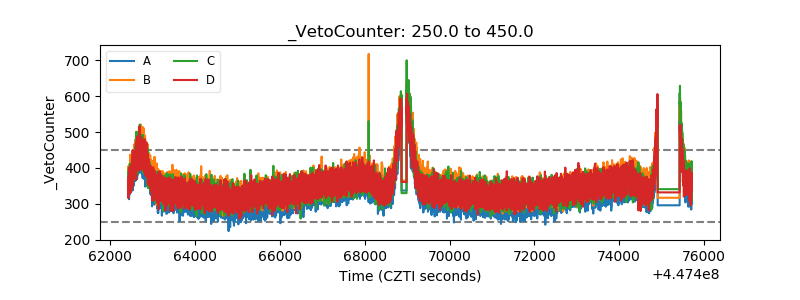 |