| Param | Original file | Final file |
|---|---|---|
| Filename | modeM0/AS1A13_071T07_9000006116_45647cztM0_level2.fits | modeM0/AS1A13_071T07_9000006116_45647cztM0_level2_quad_clean.evt |
| Size (bytes) | 528,704,640 | 100,641,600 |
| Size | 504.2 MB | 96.0 MB |
| Events in quadrant A | 5,236,384 | 700,000 |
| Events in quadrant B | 4,181,555 | 676,231 |
| Events in quadrant C | 3,086,571 | 692,313 |
| Events in quadrant D | 6,610,203 | 567,820 |
| Mode M9 | |||
|---|---|---|---|
| Quadrant | BADHDUFLAG | Total packets | Discarded packets |
| A | 0 | 12 | 0 |
| B | 0 | 12 | 0 |
| C | 0 | 12 | 0 |
| D | 0 | 12 | 0 |
| Mode M0 | |||
|---|---|---|---|
| Quadrant | BADHDUFLAG | Total packets | Discarded packets |
| A | 0 | 18996 | 1 |
| B | 0 | 16205 | 1 |
| C | 0 | 13285 | 1 |
| D | 0 | 23769 | 1 |
| Mode SS | |||
|---|---|---|---|
| Quadrant | BADHDUFLAG | Total packets | Discarded packets |
| A | 0 | 120 | 0 |
| B | 0 | 120 | 0 |
| C | 0 | 120 | 0 |
| D | 0 | 120 | 0 |
| Quadrant | Total seconds | Saturated seconds | Saturation percentage |
|---|---|---|---|
| A | 5881 | 167 | 2.839653% |
| B | 5882 | 515 | 8.755525% |
| C | 5882 | 145 | 2.465148% |
| D | 5882 | 860 | 14.620877% |
Noise dominated data is calculated using 1-second bins in cleaned event files. If a bin has >2000 counts, and if more than 50% of those come from <1% of pixels, then it is considered to be noise-dominated and hence unusable.
| Quadrant | # 1 sec bins | Bins with >0 counts | Bins with >2000 counts | High rate bins dominated by noise | Noise dominated (total time) | Noise dominated (detector-on time) | Marked lightcurve |
|---|---|---|---|---|---|---|---|
| A | 7056 | 5881 | 4 | 4 | 0.06% | 0.07% | 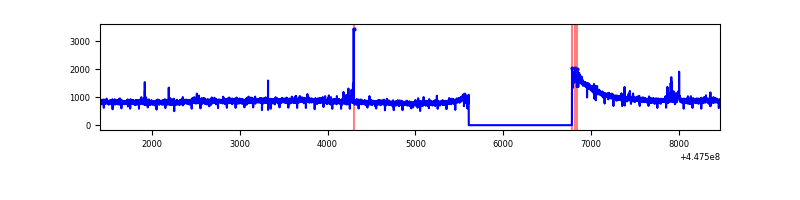 |
| B | 7057 | 5882 | 335 | 335 | 4.75% | 5.70% | 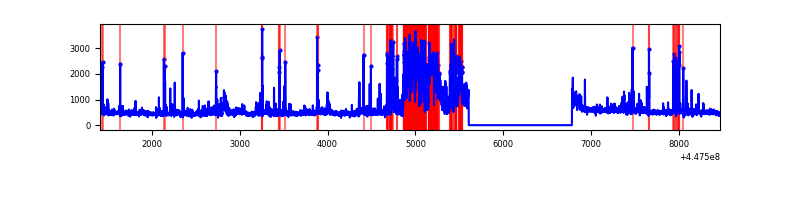 |
| C | 7057 | 5882 | 74 | 74 | 1.05% | 1.26% | 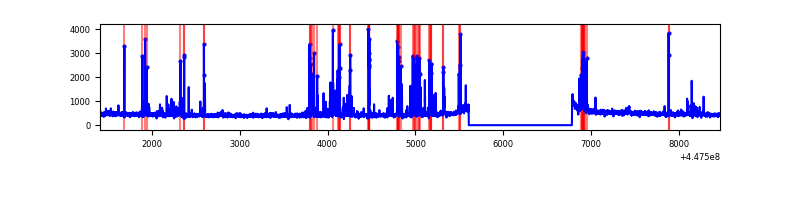 |
| D | 7057 | 5883 | 687 | 687 | 9.74% | 11.68% | 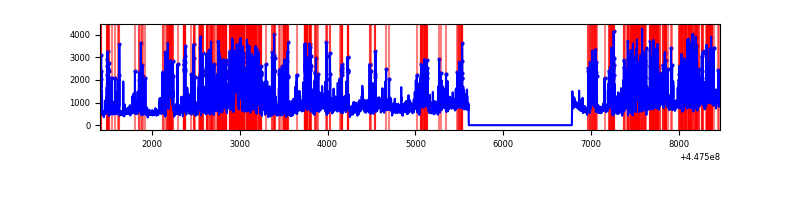 |
Top three noisy pixels from each quadrant. If the there are fewer than three noisy pixels in the level2.evt file, extra rows are filled as -1
| Pixel properties | Quadrant properties | ||||||
|---|---|---|---|---|---|---|---|
| Quadrant | DetID | PixID | Counts | Sigma | Mean | Median | Sigma |
| A | 10 | 83 | 2519708 | 17908.59 | 686 | 673 | 140.7 |
| A | 10 | 248 | 26996 | 187.14 | 686 | 673 | 140.7 |
| A | 0 | 243 | 14944 | 101.46 | 686 | 673 | 140.7 |
| B | 3 | 112 | 1111389 | 8747.11 | 665 | 647 | 127.0 |
| B | 5 | 32 | 157884 | 1238.24 | 665 | 647 | 127.0 |
| B | 5 | 172 | 73577 | 574.32 | 665 | 647 | 127.0 |
| C | 14 | 254 | 463233 | 2985.52 | 668 | 672 | 154.9 |
| C | 0 | 64 | 6656 | 38.62 | 668 | 672 | 154.9 |
| C | 2 | 14 | 4733 | 26.21 | 668 | 672 | 154.9 |
| D | 8 | 129 | 1364378 | 8502.79 | 640 | 619 | 160.4 |
| D | 11 | 241 | 1187247 | 7398.41 | 640 | 619 | 160.4 |
| D | 13 | 249 | 369190 | 2297.97 | 640 | 619 | 160.4 |
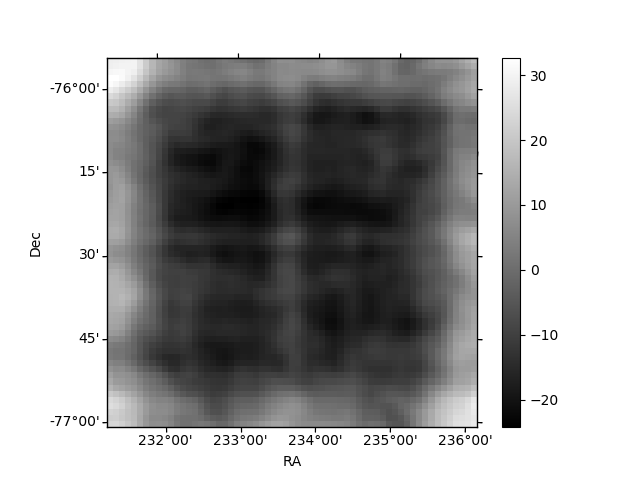
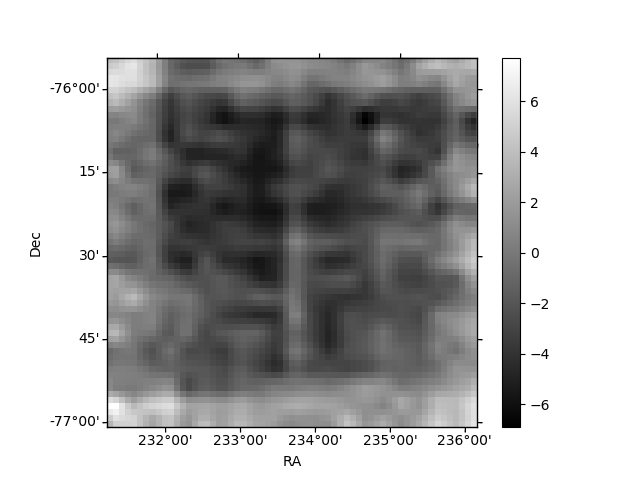
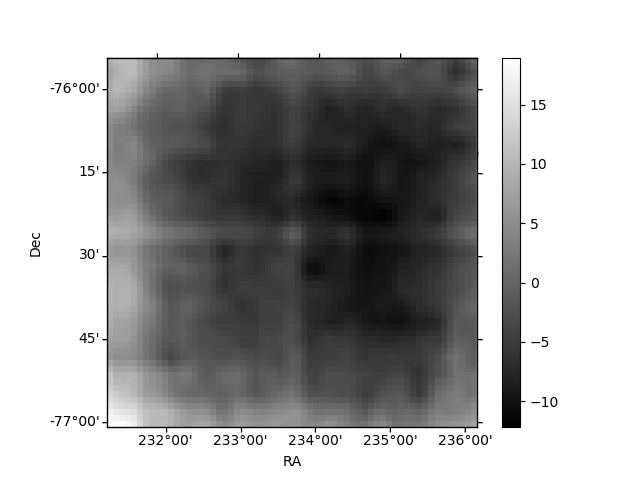
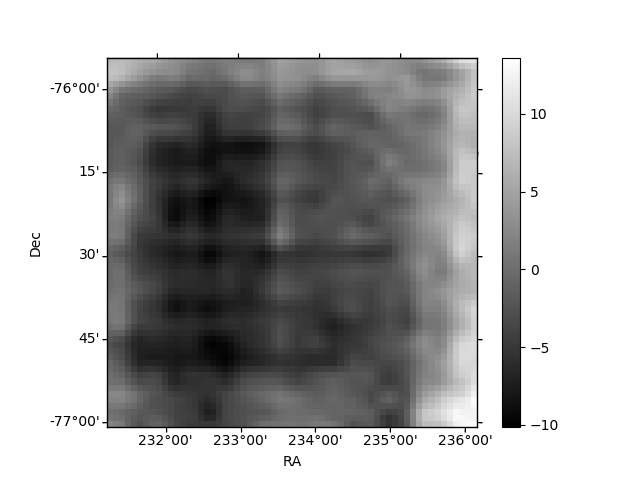
Histogram calculated using DETX and DETY for each event in the final _common_clean file
| Quadrant A | 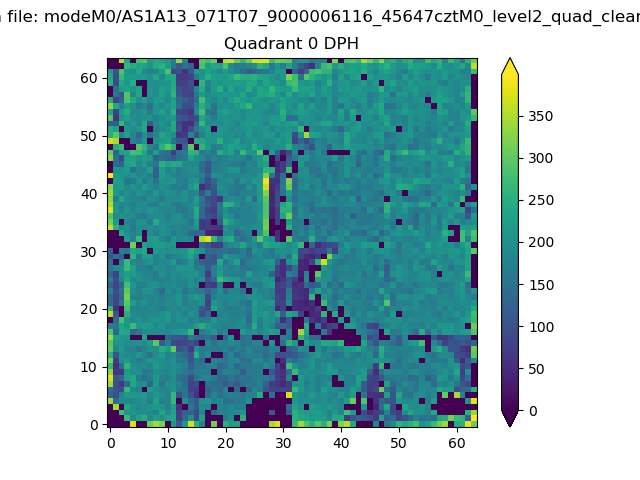 |
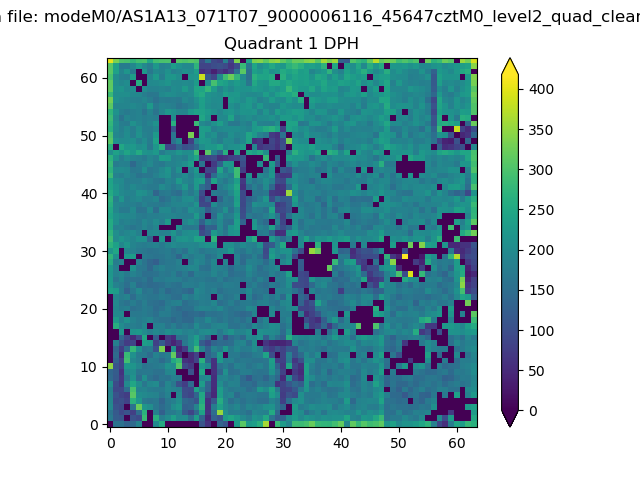 |
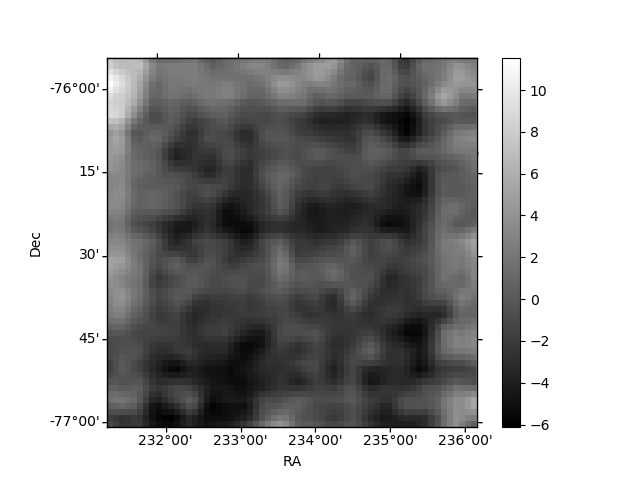
Quadrant B |
|---|---|---|---|
| Quadrant D | 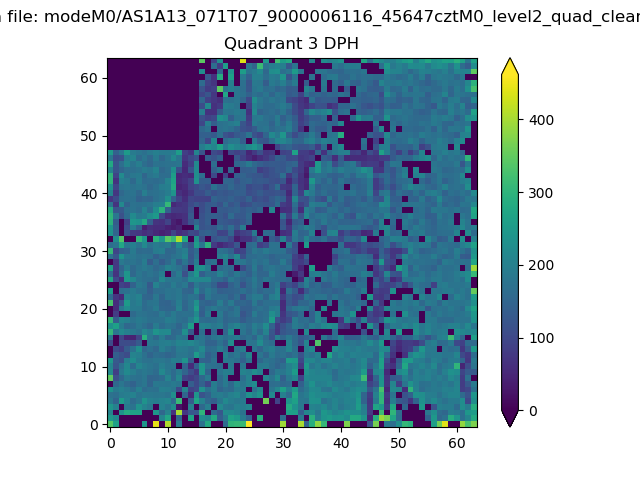 |
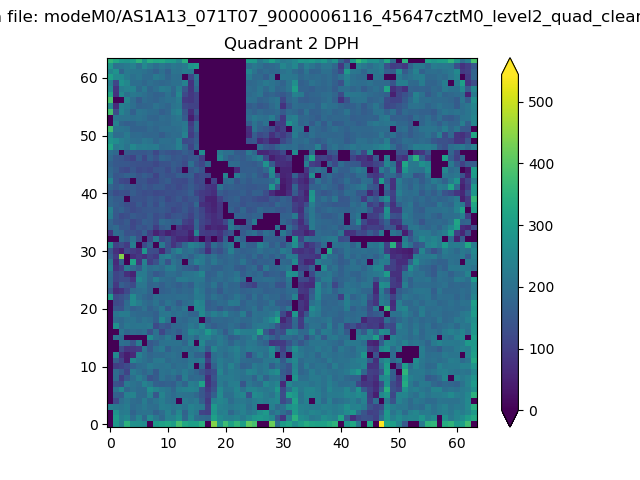 |
Quadrant C |
| Plot type | Count rate plots | Images |
|---|---|---|
| Comparison with Poisson distribution Blue bars denote a histogram of data divided into 1 sec bins. Red curve is a Poisson curve with rate = median count rate of data. |
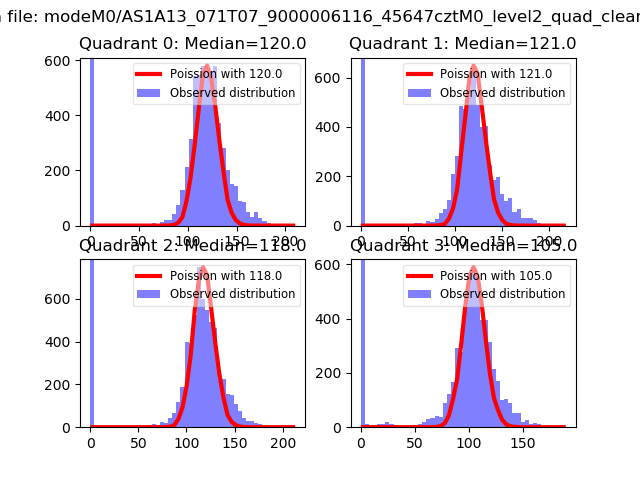 |
 |
| Quadrant-wise count rates Data is divided into 100 sec bins |
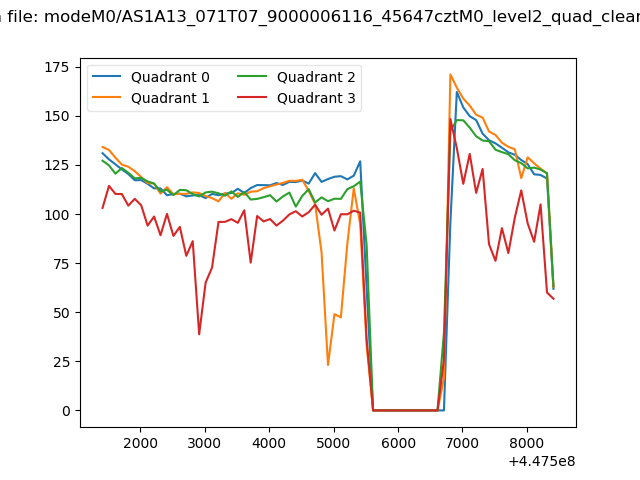 |
|
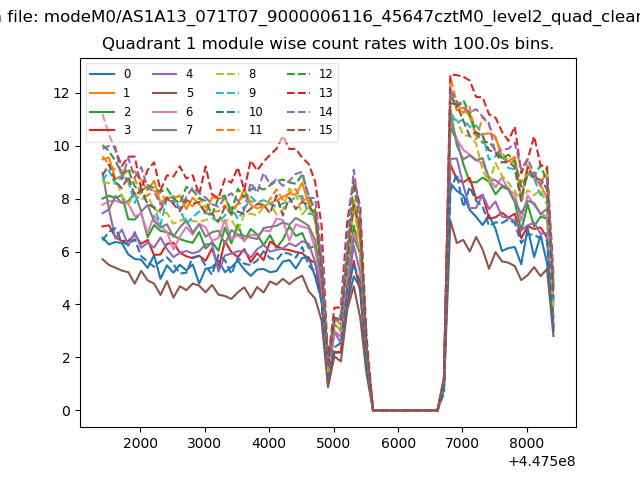
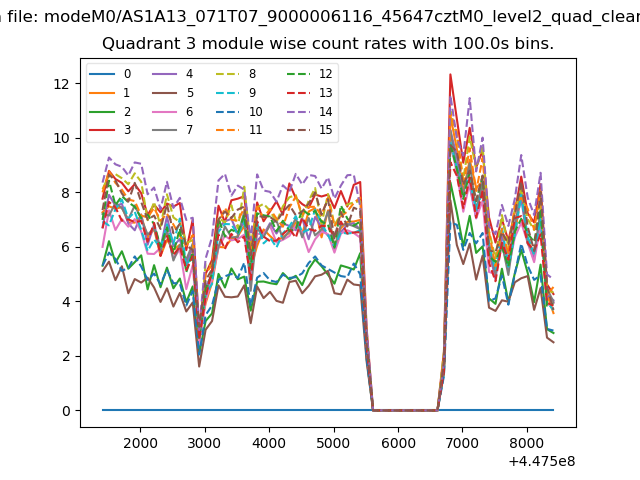
| Module-wise count rates for Quadrant A Data is divided into 100 sec bins |
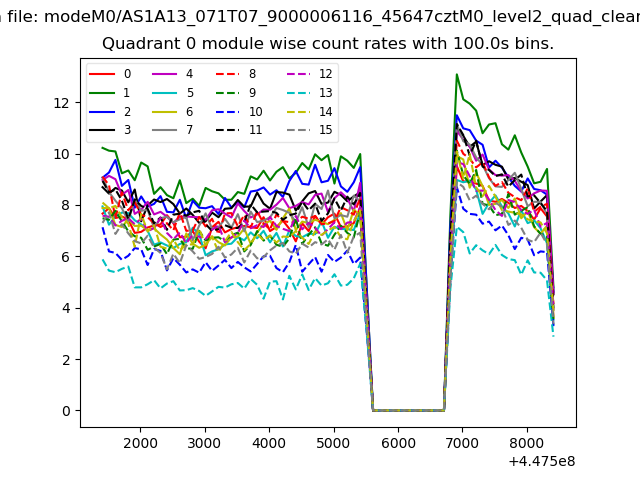 |
 |
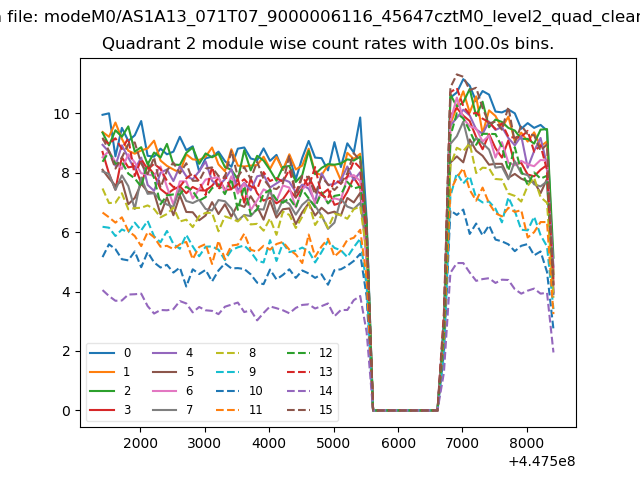
| Module-wise count rates for Quadrant B Data is divided into 100 sec bins |
 |
 |
| Module-wise count rates for Quadrant C Data is divided into 100 sec bins |
 |
 |
| Module-wise count rates for Quadrant D Data is divided into 100 sec bins |
 |
 |
| Parameter | Plot |
|---|---|
| CZT HV Monitor | 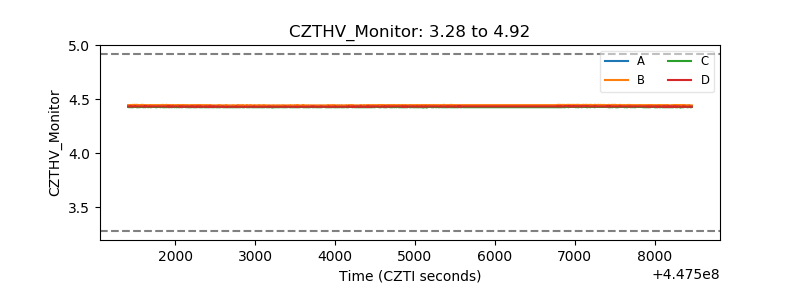 |
| D_VDD | 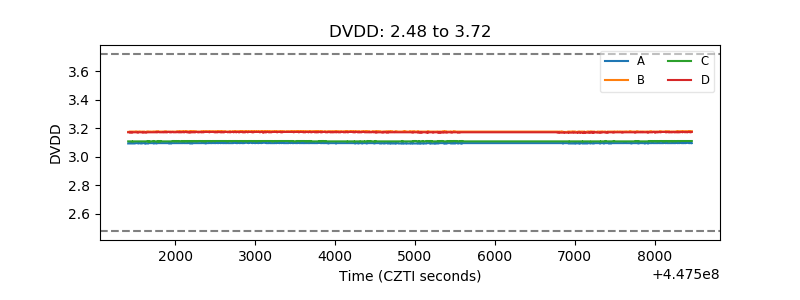 |
| Temperature 1 | 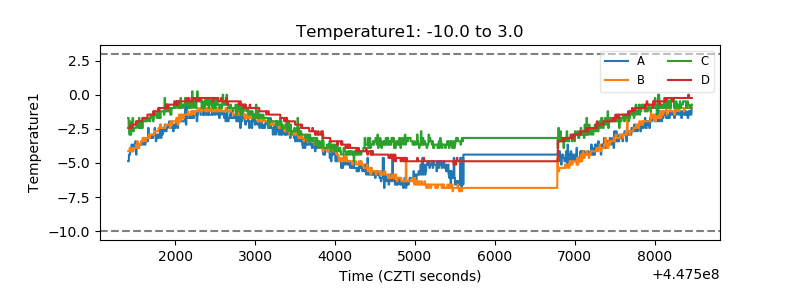 |
| Veto HV Monitor | 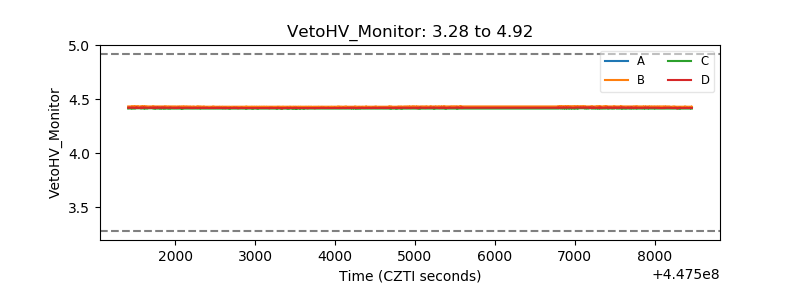 |
| Veto LLD | 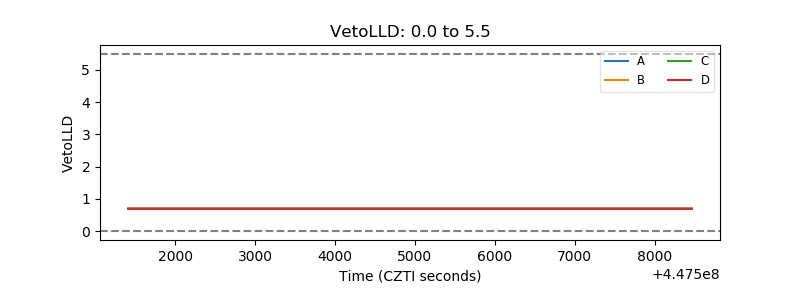 |
| Alpha Counter | 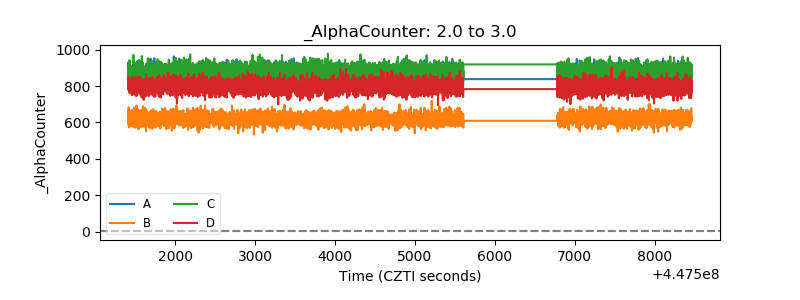 |
| _CPM_Rate | 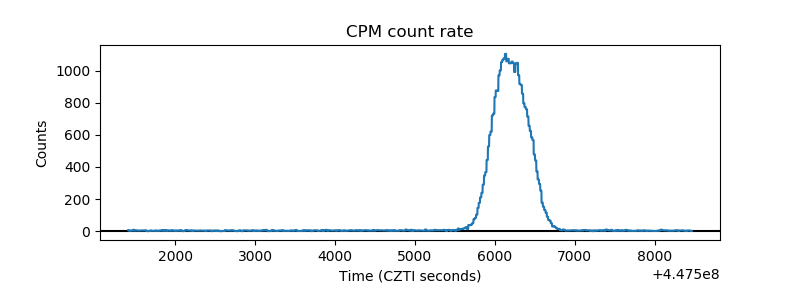 |
| CZT Counter | 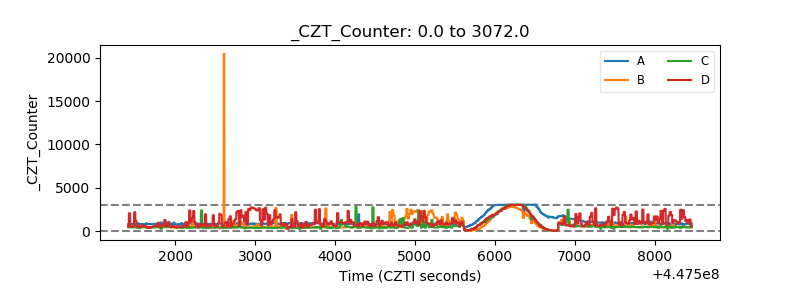 |
| +2.5 Volts monitor | 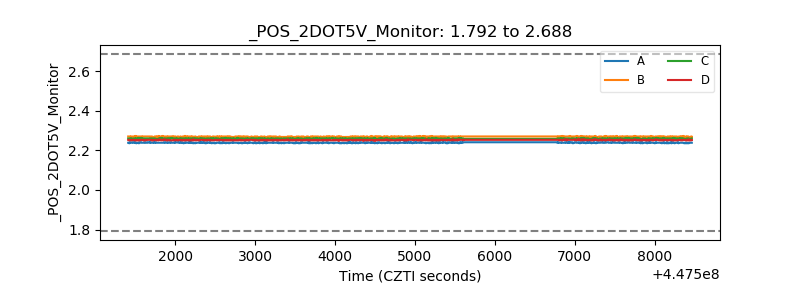 |
| +5 Volts monitor | 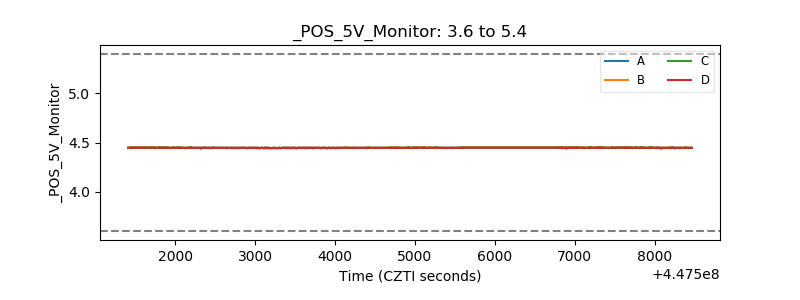 |
| _ROLL_ROT | 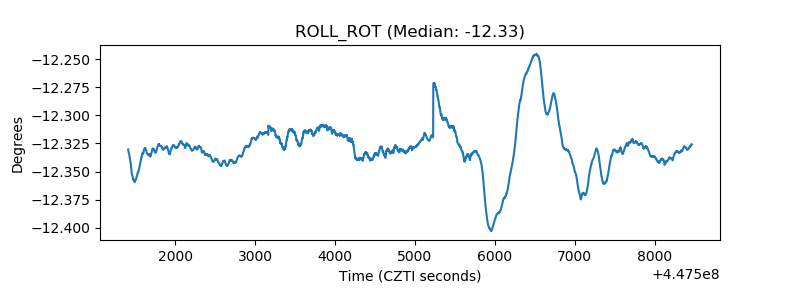 |
| _Roll_DEC | 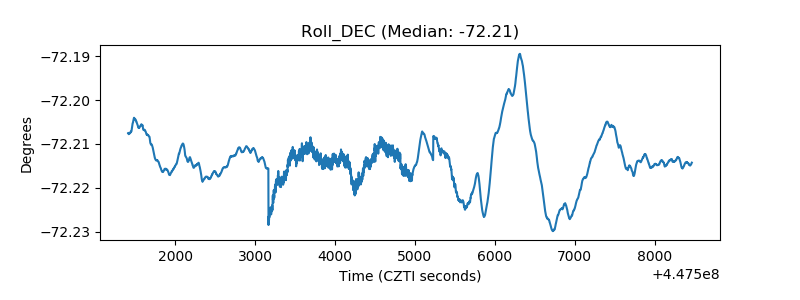 |
| _Roll_RA | 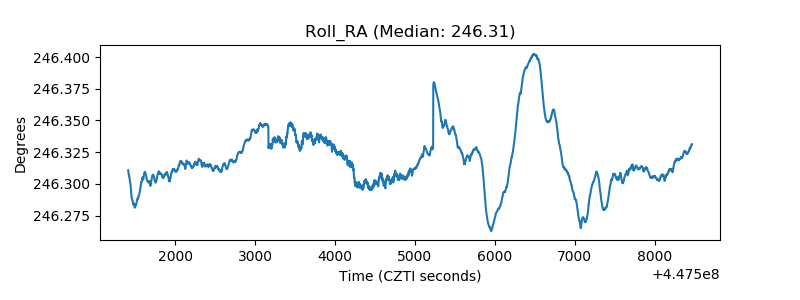 |
| Veto Counter | 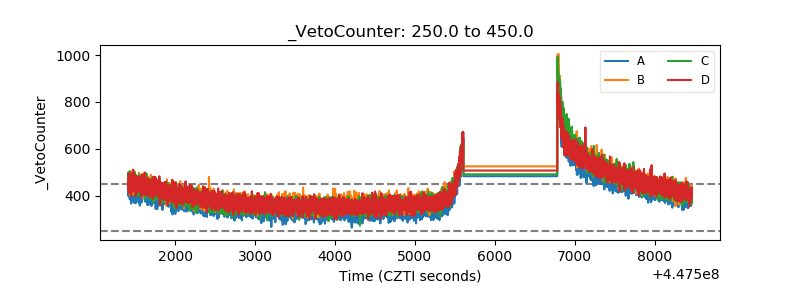 |