| Param | Original file | Final file |
|---|---|---|
| Filename | modeM0/AS1A13_071T07_9000006116_45648cztM0_level2.fits | modeM0/AS1A13_071T07_9000006116_45648cztM0_level2_quad_clean.evt |
| Size (bytes) | 572,866,560 | 109,598,400 |
| Size | 546.3 MB | 104.5 MB |
| Events in quadrant A | 5,709,626 | 758,964 |
| Events in quadrant B | 3,756,860 | 777,069 |
| Events in quadrant C | 3,135,192 | 754,734 |
| Events in quadrant D | 8,116,522 | 588,666 |
| Mode M9 | |||
|---|---|---|---|
| Quadrant | BADHDUFLAG | Total packets | Discarded packets |
| A | 0 | 12 | 0 |
| B | 0 | 12 | 0 |
| C | 0 | 12 | 0 |
| D | 0 | 12 | 0 |
| Mode M0 | |||
|---|---|---|---|
| Quadrant | BADHDUFLAG | Total packets | Discarded packets |
| A | 0 | 20766 | 1 |
| B | 0 | 15032 | 1 |
| C | 0 | 13622 | 2 |
| D | 0 | 28573 | 1 |
| Mode SS | |||
|---|---|---|---|
| Quadrant | BADHDUFLAG | Total packets | Discarded packets |
| A | 0 | 128 | 0 |
| B | 0 | 128 | 0 |
| C | 0 | 128 | 0 |
| D | 0 | 128 | 0 |
| Quadrant | Total seconds | Saturated seconds | Saturation percentage |
|---|---|---|---|
| A | 6294 | 194 | 3.082301% |
| B | 6295 | 266 | 4.225576% |
| C | 6294 | 115 | 1.827137% |
| D | 6294 | 1217 | 19.335875% |
Noise dominated data is calculated using 1-second bins in cleaned event files. If a bin has >2000 counts, and if more than 50% of those come from <1% of pixels, then it is considered to be noise-dominated and hence unusable.
| Quadrant | # 1 sec bins | Bins with >0 counts | Bins with >2000 counts | High rate bins dominated by noise | Noise dominated (total time) | Noise dominated (detector-on time) | Marked lightcurve |
|---|---|---|---|---|---|---|---|
| A | 7504 | 6294 | 15 | 15 | 0.20% | 0.24% | 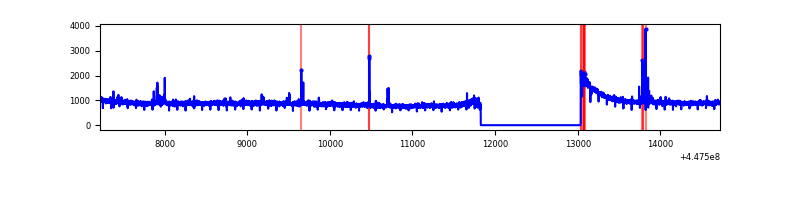 |
| B | 7505 | 6295 | 133 | 133 | 1.77% | 2.11% | 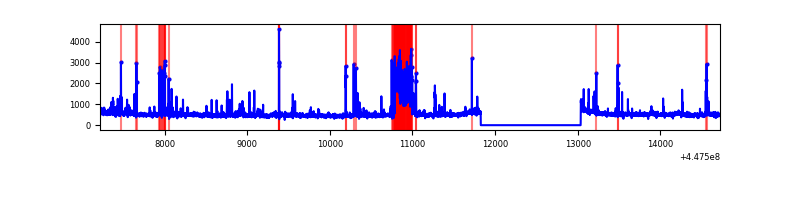 |
| C | 7504 | 6294 | 44 | 44 | 0.59% | 0.70% | 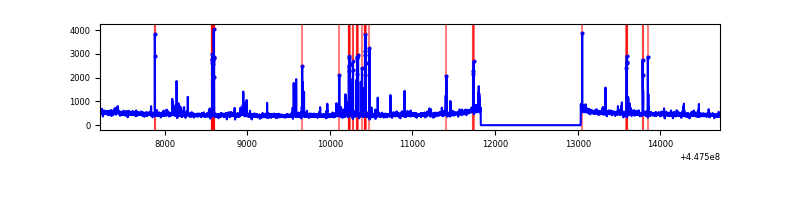 |
| D | 7504 | 6295 | 1021 | 1021 | 13.61% | 16.22% | 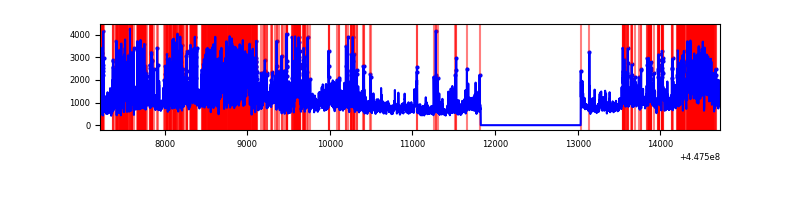 |
Top three noisy pixels from each quadrant. If the there are fewer than three noisy pixels in the level2.evt file, extra rows are filled as -1
| Pixel properties | Quadrant properties | ||||||
|---|---|---|---|---|---|---|---|
| Quadrant | DetID | PixID | Counts | Sigma | Mean | Median | Sigma |
| A | 10 | 83 | 2743068 | 18171.54 | 741 | 726 | 150.9 |
| A | 13 | 248 | 36732 | 238.59 | 741 | 726 | 150.9 |
| A | 0 | 243 | 27034 | 174.32 | 741 | 726 | 150.9 |
| B | 3 | 112 | 465617 | 3328.96 | 734 | 713 | 139.7 |
| B | 0 | 183 | 116726 | 830.71 | 734 | 713 | 139.7 |
| B | 5 | 172 | 62749 | 444.21 | 734 | 713 | 139.7 |
| C | 14 | 254 | 300980 | 1796.83 | 722 | 726 | 167.1 |
| C | 0 | 64 | 7565 | 40.93 | 722 | 726 | 167.1 |
| C | 13 | 61 | 4875 | 24.83 | 722 | 726 | 167.1 |
| D | 11 | 241 | 1892101 | 11340.85 | 671 | 650 | 166.8 |
| D | 8 | 129 | 1604661 | 9617.4 | 671 | 650 | 166.8 |
| D | 1 | 52 | 742168 | 4446.03 | 671 | 650 | 166.8 |
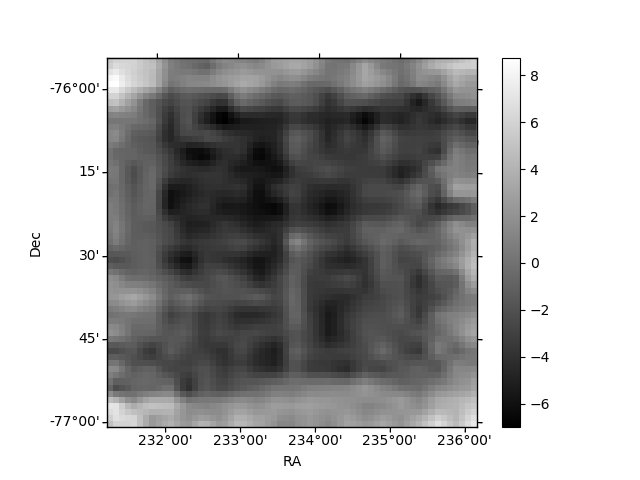
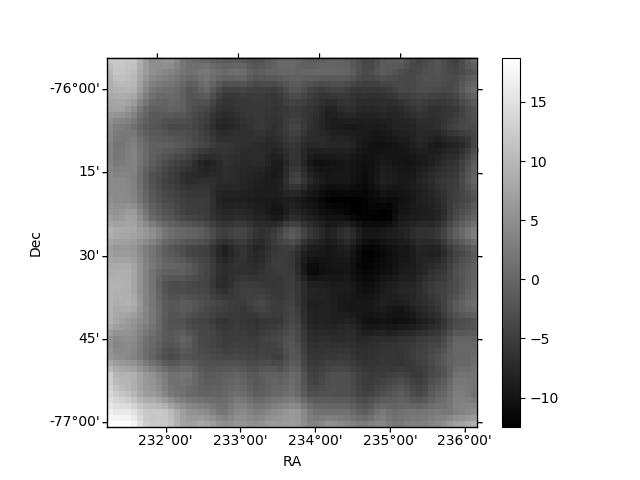
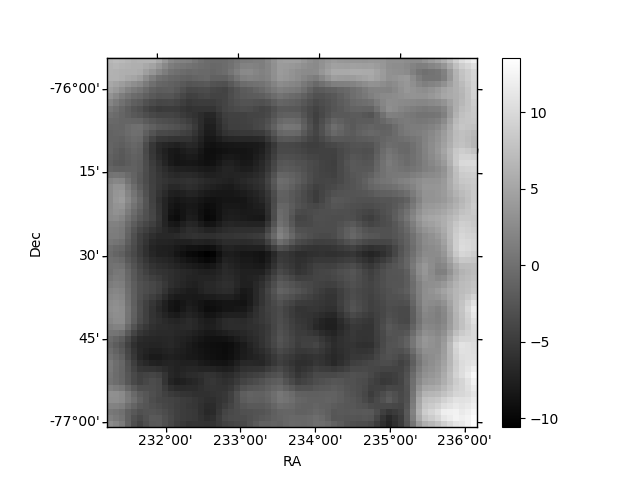
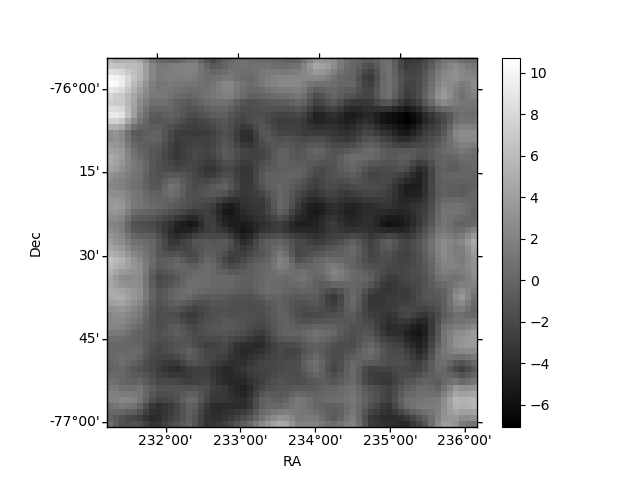
Histogram calculated using DETX and DETY for each event in the final _common_clean file
| Quadrant A | 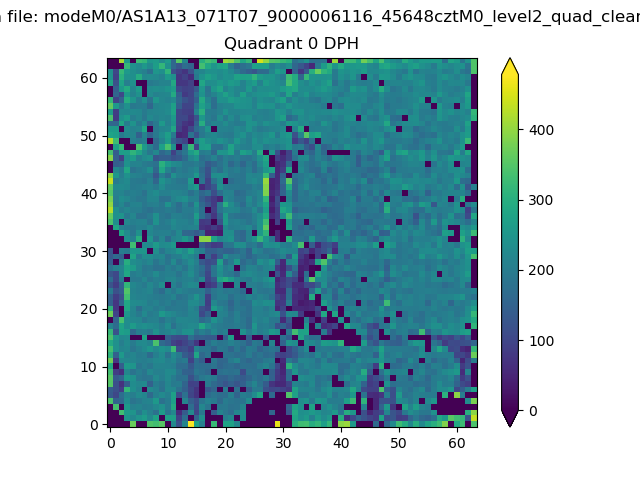 |
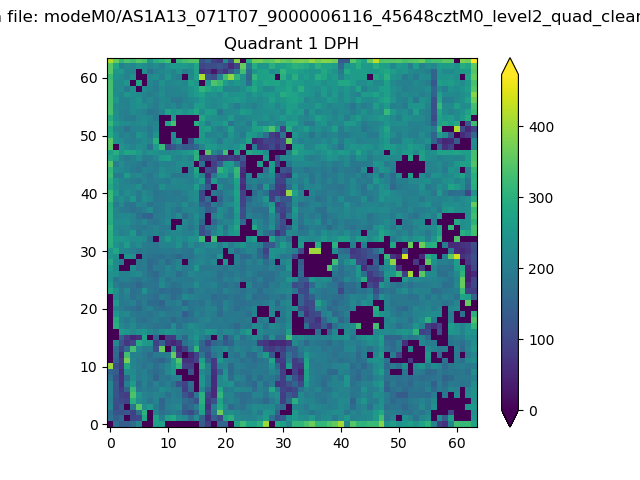 |
Quadrant B |
|---|---|---|---|
| Quadrant D | 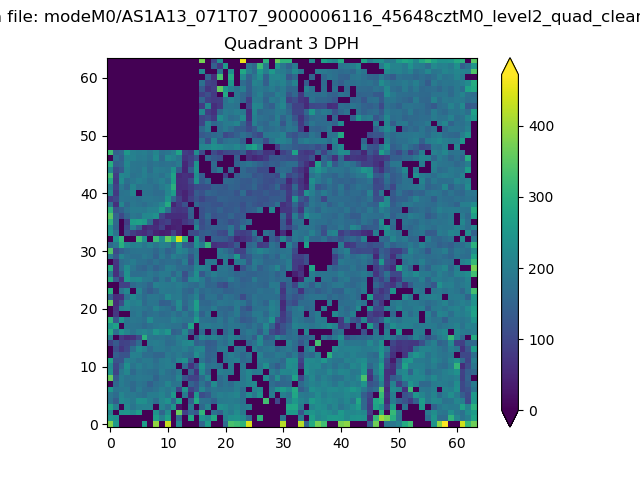 |
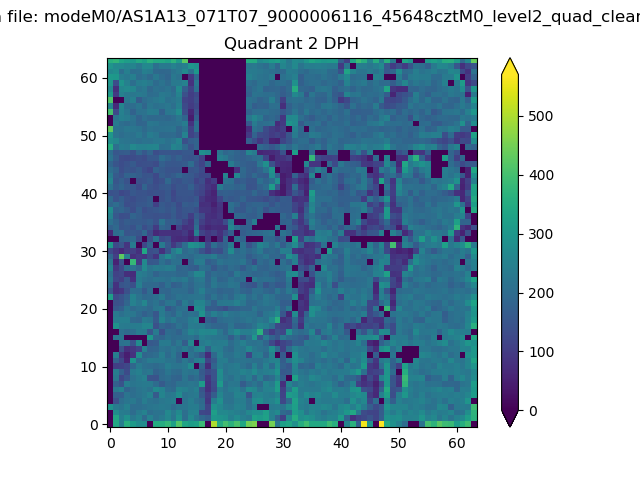 |
Quadrant C |
| Plot type | Count rate plots | Images |
|---|---|---|
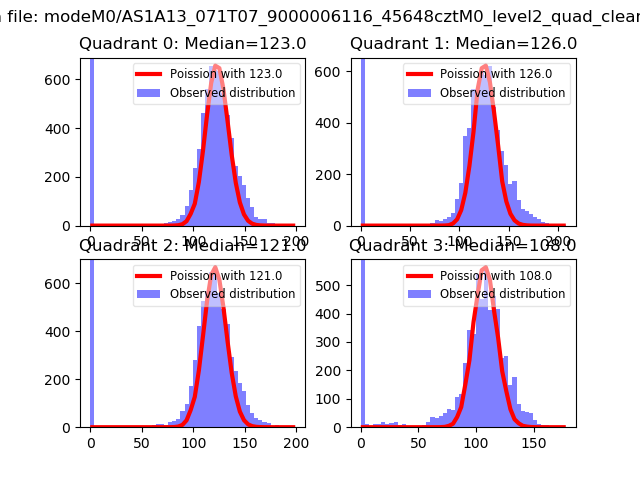
| Comparison with Poisson distribution Blue bars denote a histogram of data divided into 1 sec bins. Red curve is a Poisson curve with rate = median count rate of data. |
 |
 |
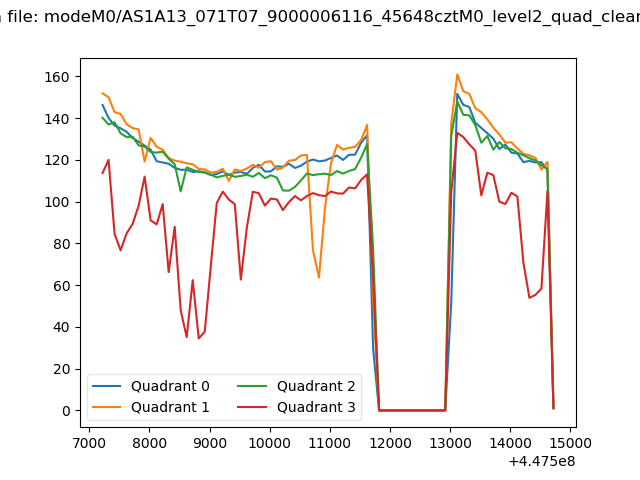
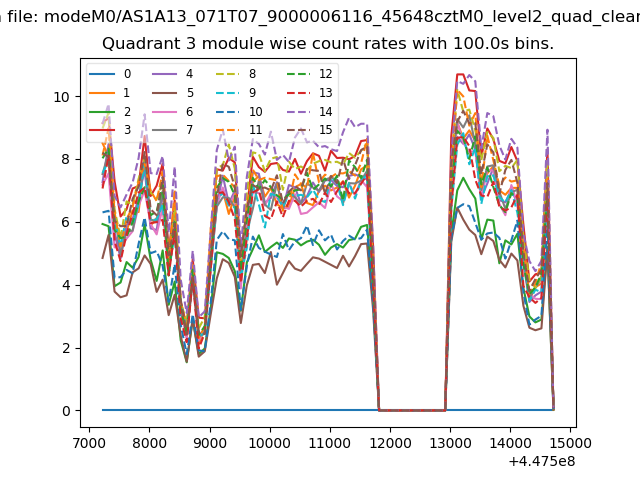
| Quadrant-wise count rates Data is divided into 100 sec bins |
 |
|
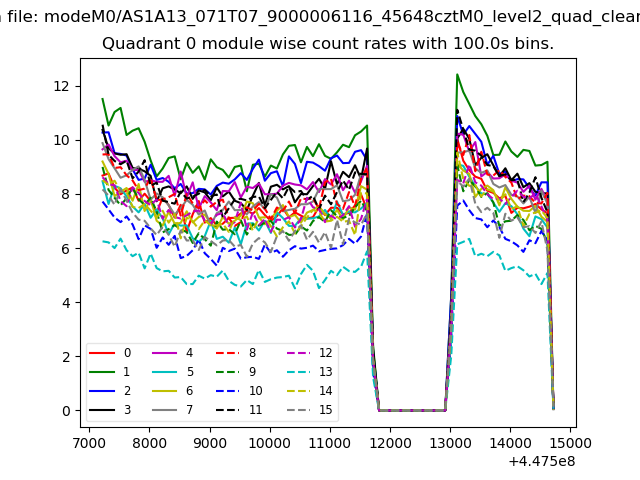
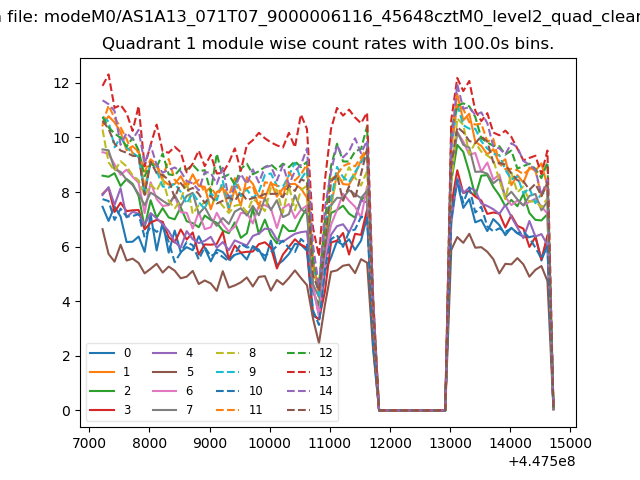
| Module-wise count rates for Quadrant A Data is divided into 100 sec bins |
 |
 |
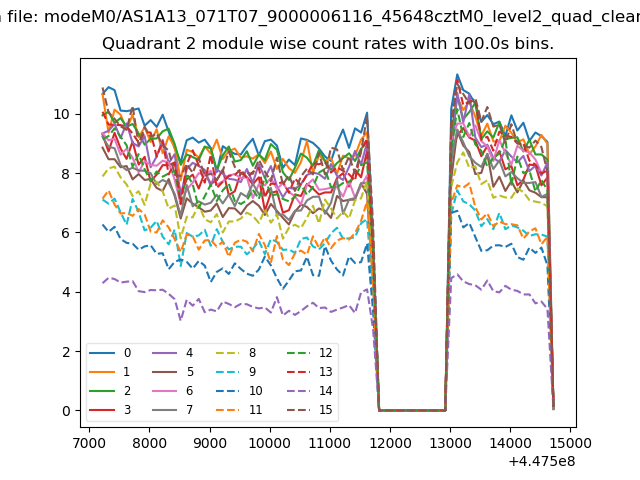
| Module-wise count rates for Quadrant B Data is divided into 100 sec bins |
 |
 |
| Module-wise count rates for Quadrant C Data is divided into 100 sec bins |
 |
 |
| Module-wise count rates for Quadrant D Data is divided into 100 sec bins |
 |
 |
| Parameter | Plot |
|---|---|
| CZT HV Monitor | 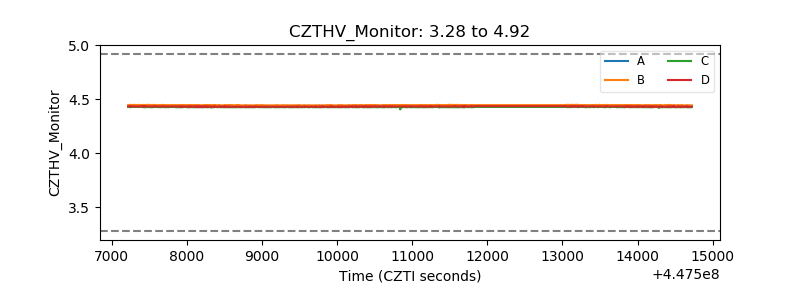 |
| D_VDD | 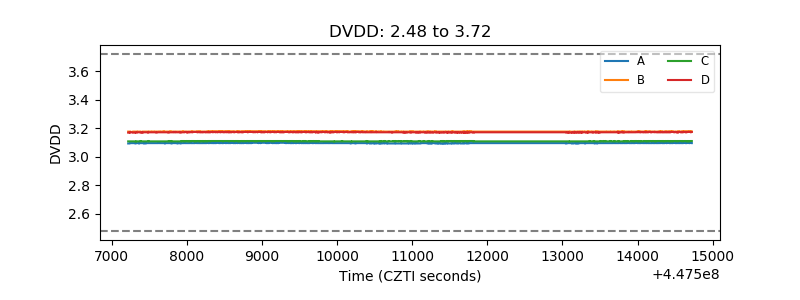 |
| Temperature 1 | 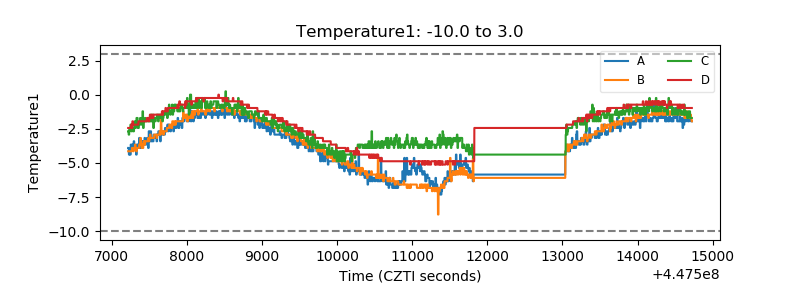 |
| Veto HV Monitor |  |
| Veto LLD | 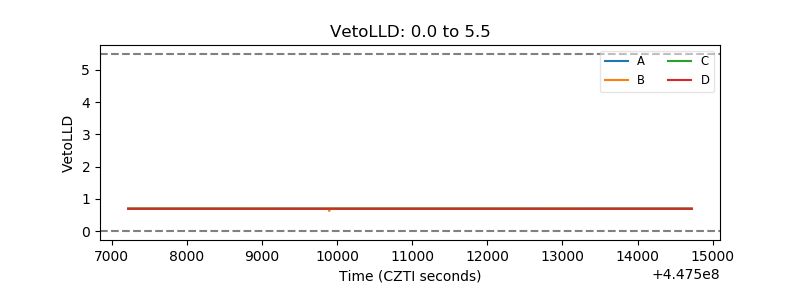 |
| Alpha Counter | 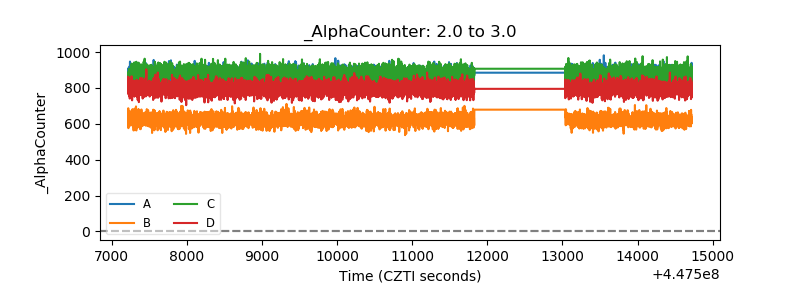 |
| _CPM_Rate | 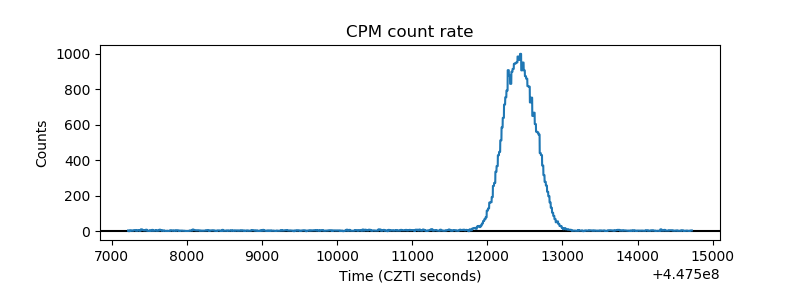 |
| CZT Counter | 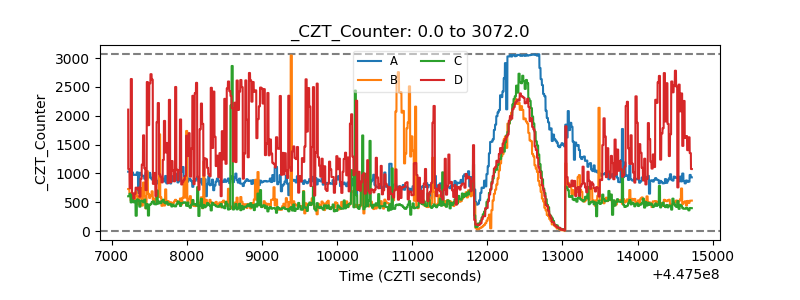 |
| +2.5 Volts monitor | 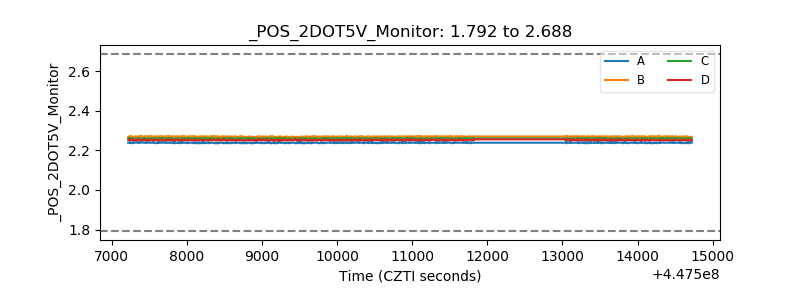 |
| +5 Volts monitor | 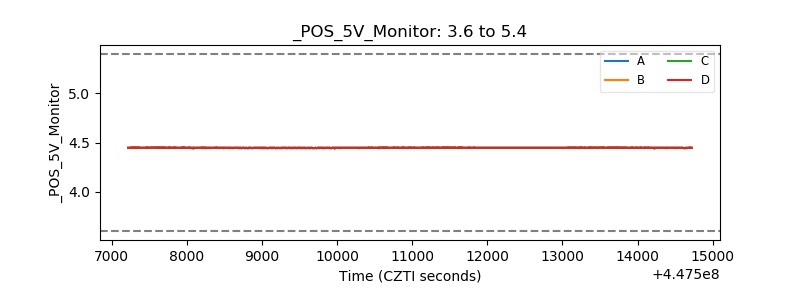 |
| _ROLL_ROT | 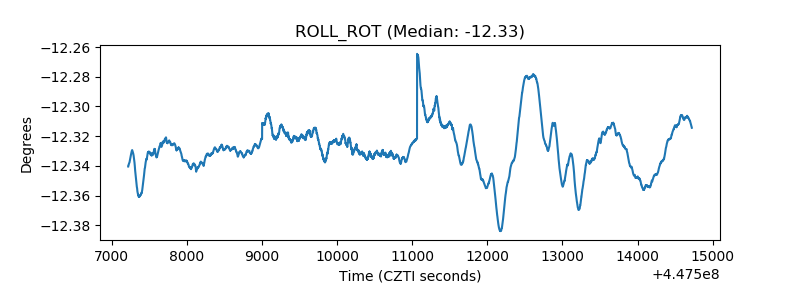 |
| _Roll_DEC | 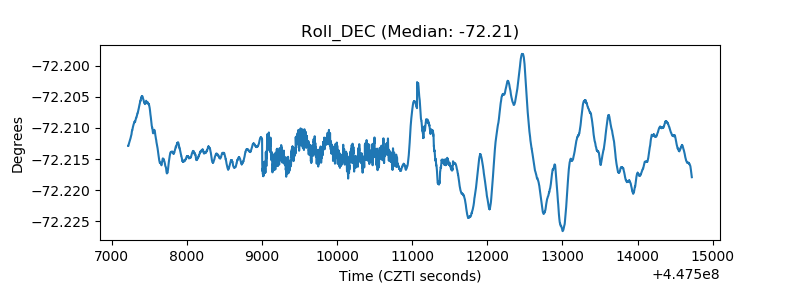 |
| _Roll_RA | 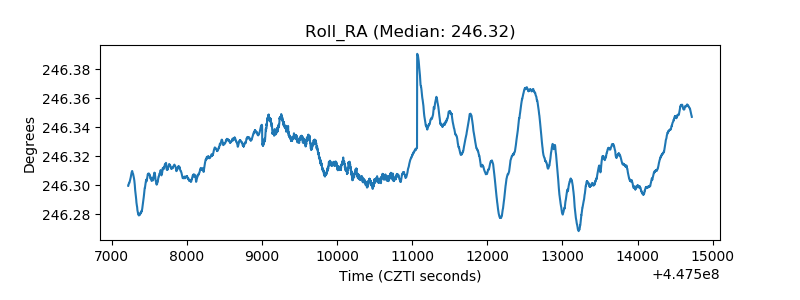 |
| Veto Counter | 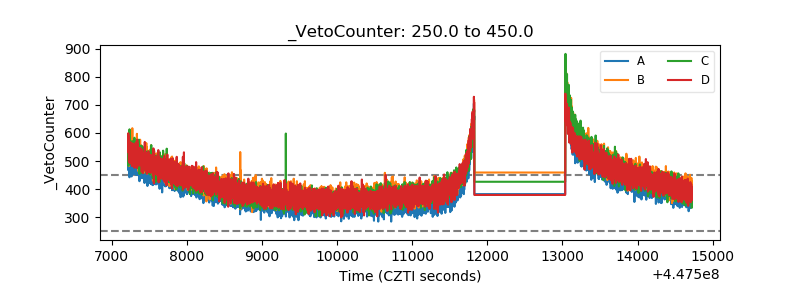 |