| Param | Original file | Final file |
|---|---|---|
| Filename | modeM0/AS1A13_071T07_9000006116_45650cztM0_level2.fits | modeM0/AS1A13_071T07_9000006116_45650cztM0_level2_quad_clean.evt |
| Size (bytes) | 596,905,920 | 88,971,840 |
| Size | 569.3 MB | 84.9 MB |
| Events in quadrant A | 5,174,246 | 644,340 |
| Events in quadrant B | 7,131,433 | 475,158 |
| Events in quadrant C | 3,161,170 | 636,277 |
| Events in quadrant D | 6,175,762 | 529,490 |
| Mode M9 | |||
|---|---|---|---|
| Quadrant | BADHDUFLAG | Total packets | Discarded packets |
| A | 0 | 9 | 0 |
| B | 0 | 9 | 0 |
| C | 0 | 9 | 0 |
| D | 0 | 9 | 0 |
| Mode M0 | |||
|---|---|---|---|
| Quadrant | BADHDUFLAG | Total packets | Discarded packets |
| A | 0 | 19197 | 1 |
| B | 0 | 25066 | 1 |
| C | 0 | 13643 | 1 |
| D | 0 | 22289 | 1 |
| Mode SS | |||
|---|---|---|---|
| Quadrant | BADHDUFLAG | Total packets | Discarded packets |
| A | 0 | 120 | 0 |
| B | 0 | 120 | 0 |
| C | 0 | 120 | 0 |
| D | 0 | 120 | 0 |
| Quadrant | Total seconds | Saturated seconds | Saturation percentage |
|---|---|---|---|
| A | 5839 | 276 | 4.726837% |
| B | 5840 | 1978 | 33.869863% |
| C | 5840 | 173 | 2.962329% |
| D | 5840 | 917 | 15.702055% |
Noise dominated data is calculated using 1-second bins in cleaned event files. If a bin has >2000 counts, and if more than 50% of those come from <1% of pixels, then it is considered to be noise-dominated and hence unusable.
| Quadrant | # 1 sec bins | Bins with >0 counts | Bins with >2000 counts | High rate bins dominated by noise | Noise dominated (total time) | Noise dominated (detector-on time) | Marked lightcurve |
|---|---|---|---|---|---|---|---|
| A | 6819 | 5839 | 29 | 29 | 0.43% | 0.50% | 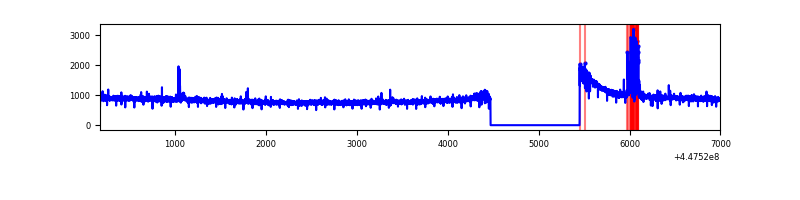 |
| B | 6820 | 5840 | 1583 | 1583 | 23.21% | 27.11% | 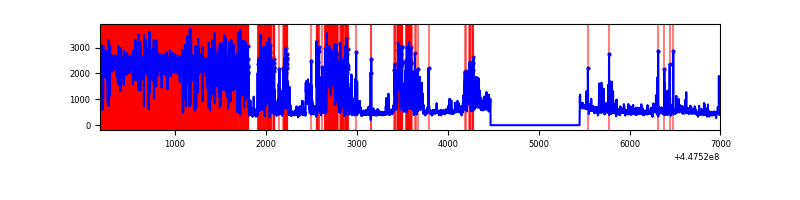 |
| C | 6820 | 5841 | 106 | 106 | 1.55% | 1.81% | 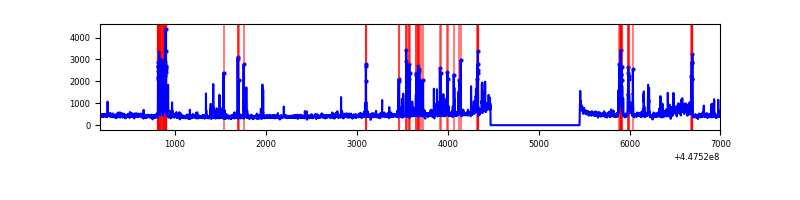 |
| D | 6820 | 5841 | 769 | 769 | 11.28% | 13.17% | 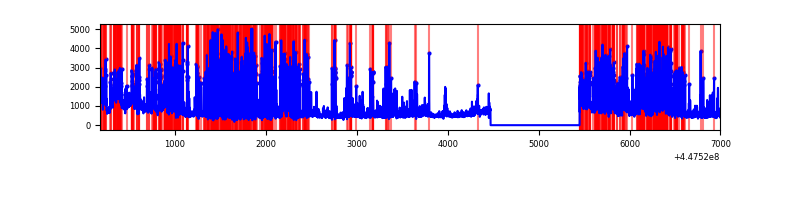 |
Top three noisy pixels from each quadrant. If the there are fewer than three noisy pixels in the level2.evt file, extra rows are filled as -1
| Pixel properties | Quadrant properties | ||||||
|---|---|---|---|---|---|---|---|
| Quadrant | DetID | PixID | Counts | Sigma | Mean | Median | Sigma |
| A | 10 | 83 | 2514890 | 18646.27 | 651 | 636 | 134.8 |
| A | 13 | 248 | 115751 | 853.72 | 651 | 636 | 134.8 |
| A | 13 | 6 | 12282 | 86.37 | 651 | 636 | 134.8 |
| B | 12 | 3 | 4227496 | 39752.46 | 551 | 534 | 106.3 |
| B | 3 | 112 | 319055 | 2995.53 | 551 | 534 | 106.3 |
| B | 4 | 171 | 118267 | 1107.22 | 551 | 534 | 106.3 |
| C | 14 | 254 | 541368 | 3651.41 | 637 | 639 | 148.1 |
| C | 9 | 54 | 76319 | 511.05 | 637 | 639 | 148.1 |
| C | 0 | 207 | 18541 | 120.89 | 637 | 639 | 148.1 |
| D | 1 | 52 | 2103628 | 13816.87 | 606 | 585 | 152.2 |
| D | 8 | 129 | 878824 | 5769.98 | 606 | 585 | 152.2 |
| D | 11 | 241 | 510274 | 3348.63 | 606 | 585 | 152.2 |
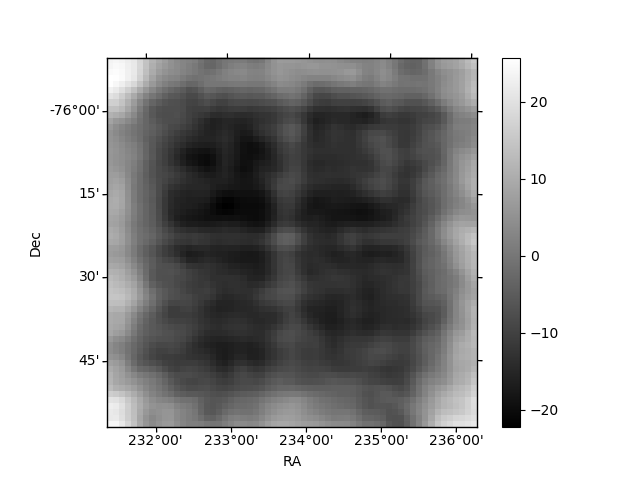
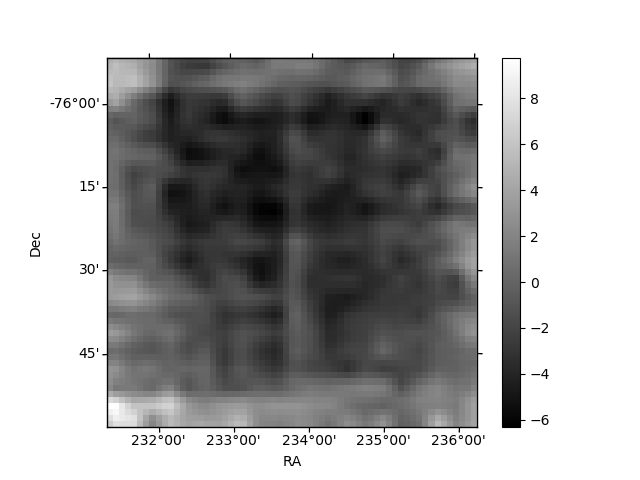
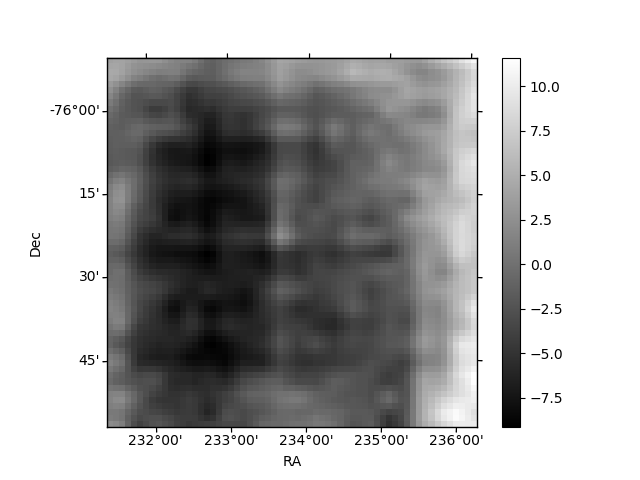
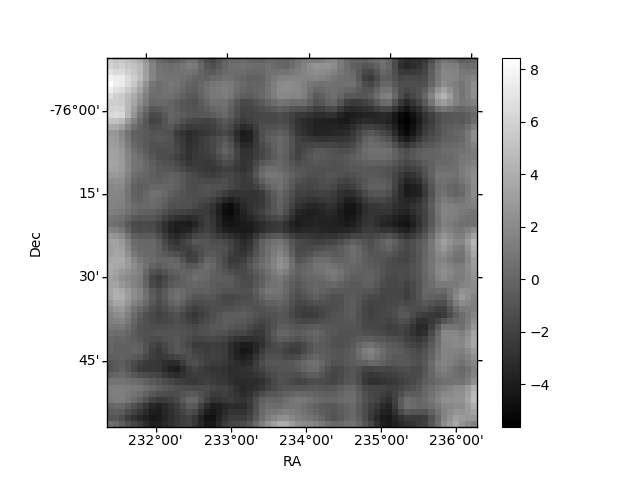
Histogram calculated using DETX and DETY for each event in the final _common_clean file
| Quadrant A | 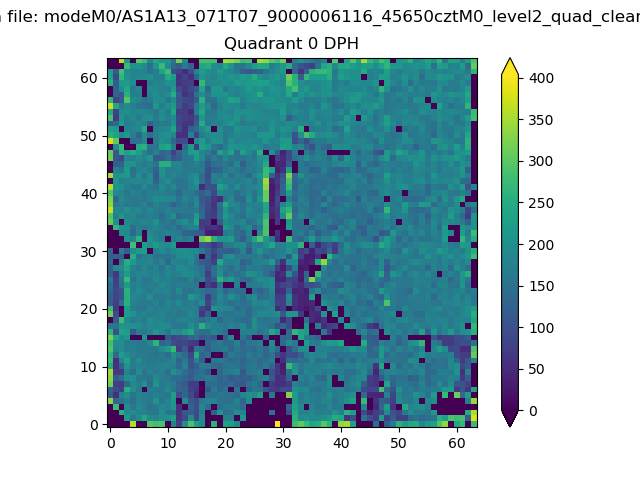 |
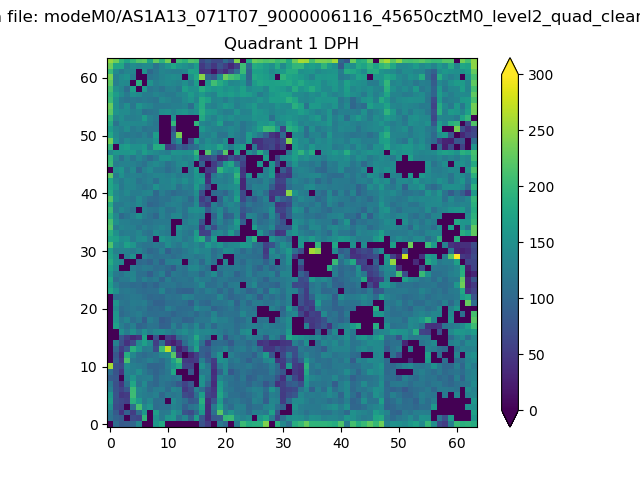 |
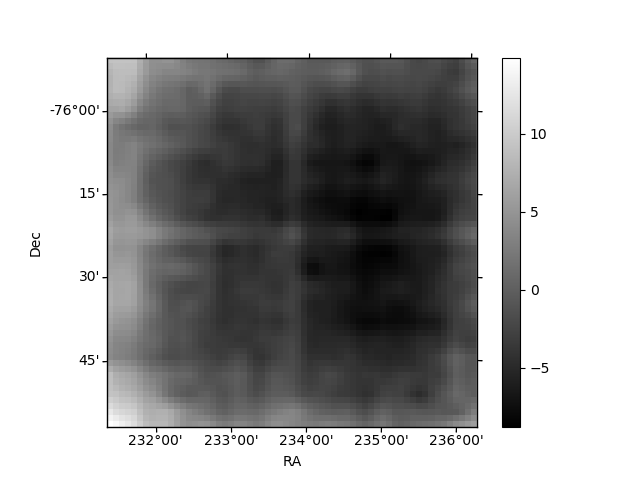
Quadrant B |
|---|---|---|---|
| Quadrant D | 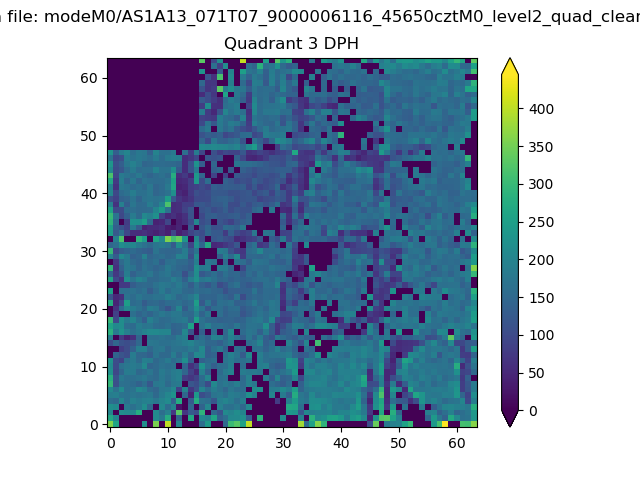 |
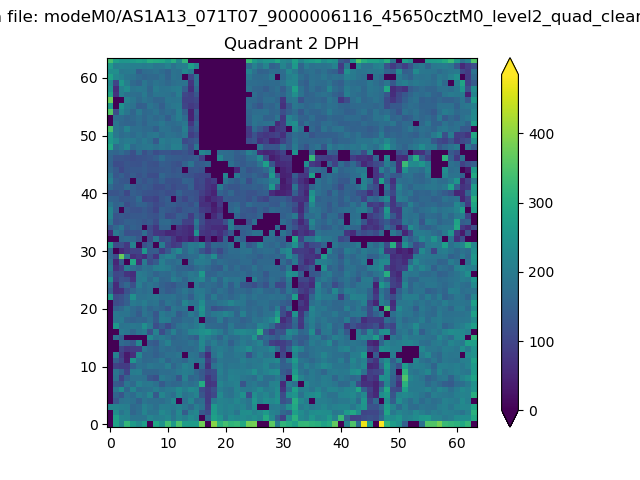 |
Quadrant C |
| Plot type | Count rate plots | Images |
|---|---|---|
| Comparison with Poisson distribution Blue bars denote a histogram of data divided into 1 sec bins. Red curve is a Poisson curve with rate = median count rate of data. |
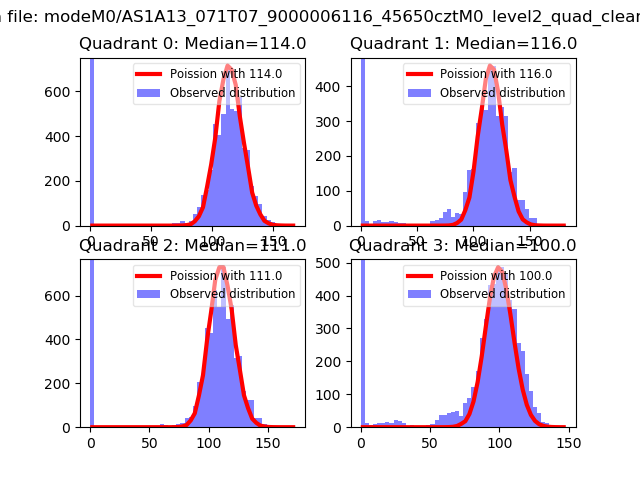 |
 |
| Quadrant-wise count rates Data is divided into 100 sec bins |
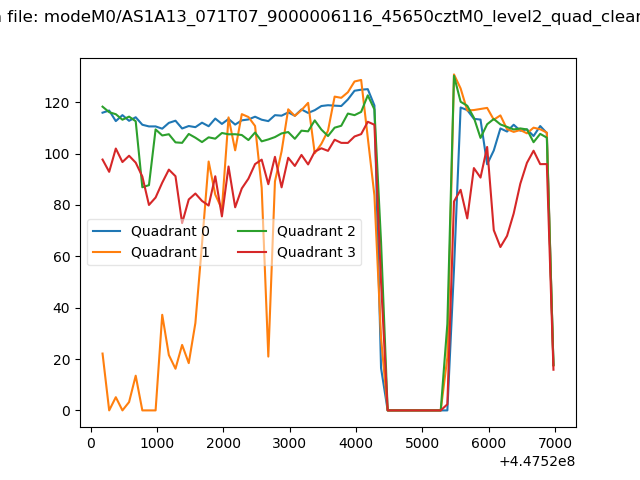 |
|
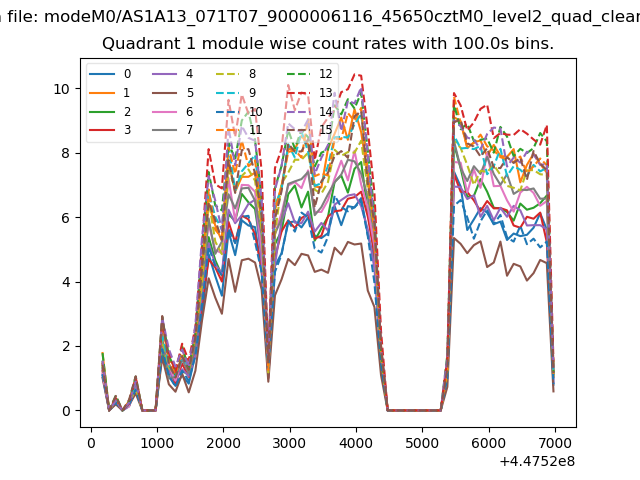
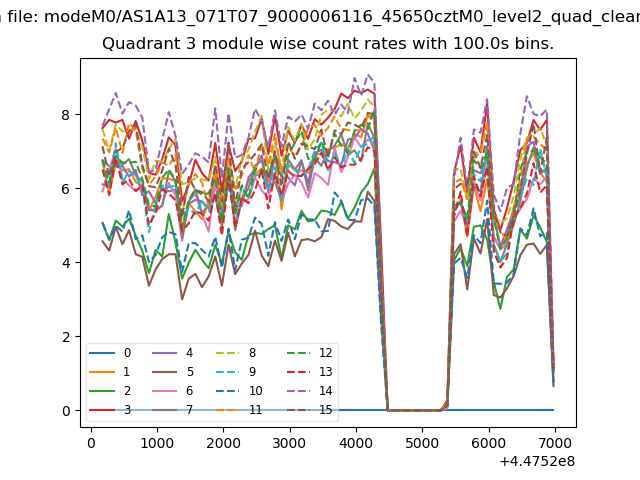
| Module-wise count rates for Quadrant A Data is divided into 100 sec bins |
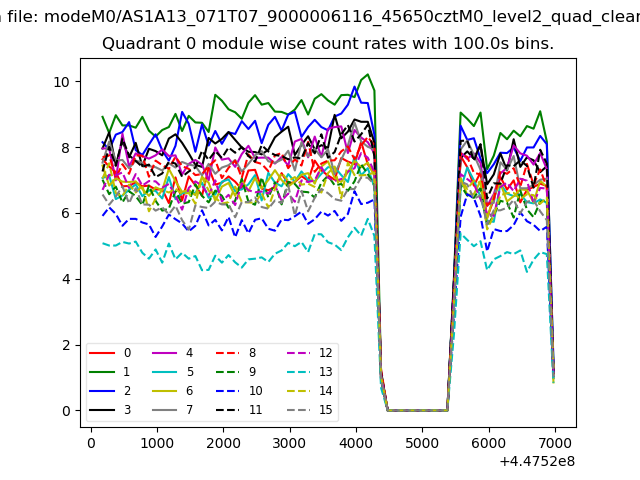 |
 |
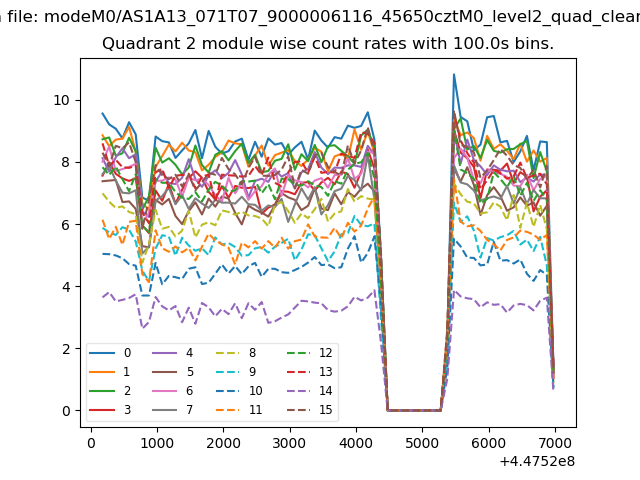
| Module-wise count rates for Quadrant B Data is divided into 100 sec bins |
 |
 |
| Module-wise count rates for Quadrant C Data is divided into 100 sec bins |
 |
 |
| Module-wise count rates for Quadrant D Data is divided into 100 sec bins |
 |
 |
| Parameter | Plot |
|---|---|
| CZT HV Monitor |  |
| D_VDD | 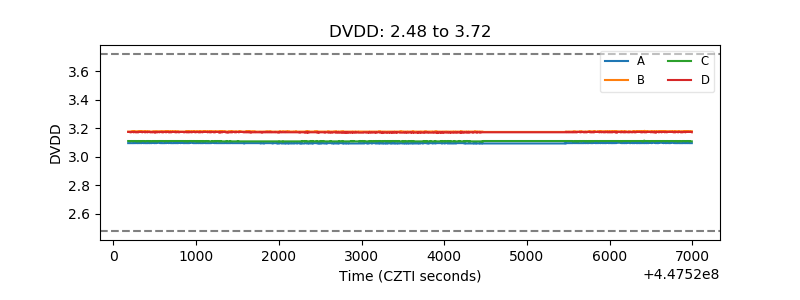 |
| Temperature 1 | 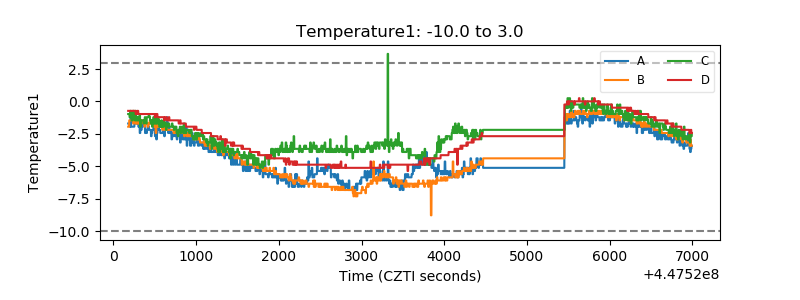 |
| Veto HV Monitor | 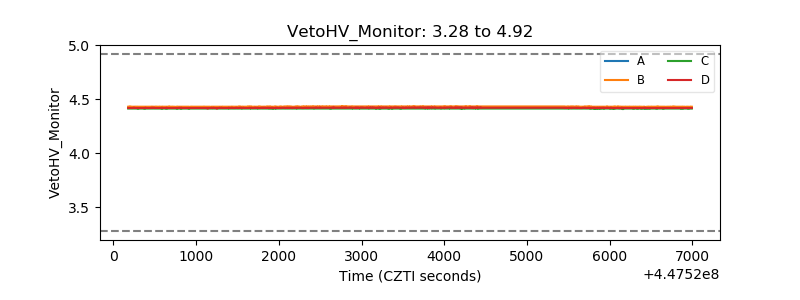 |
| Veto LLD | 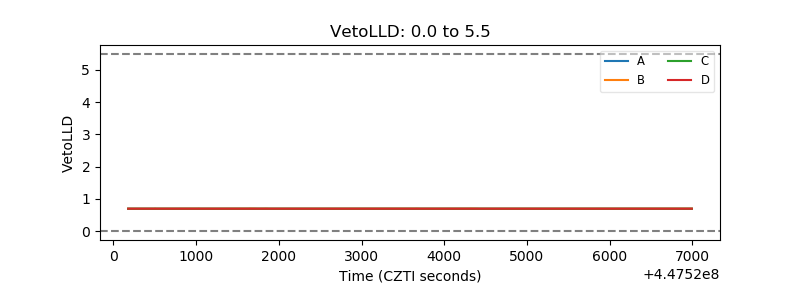 |
| Alpha Counter | 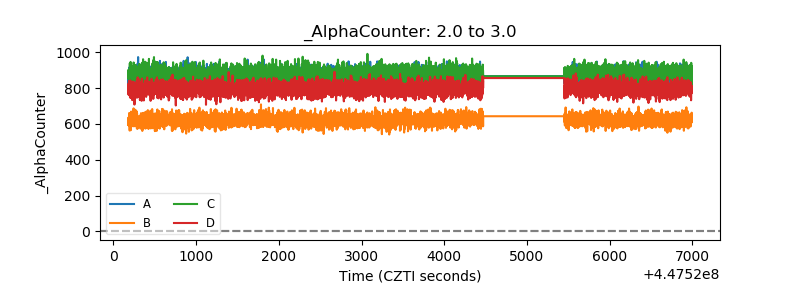 |
| _CPM_Rate | 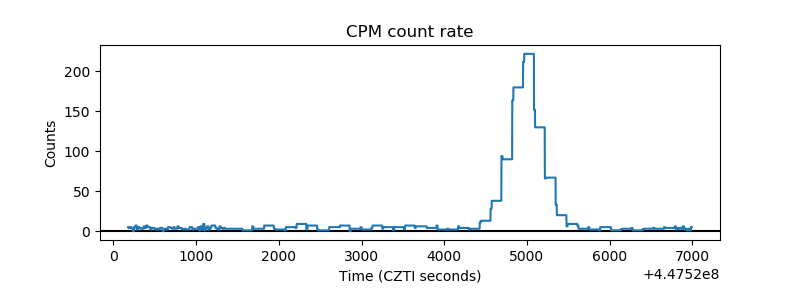 |
| CZT Counter | 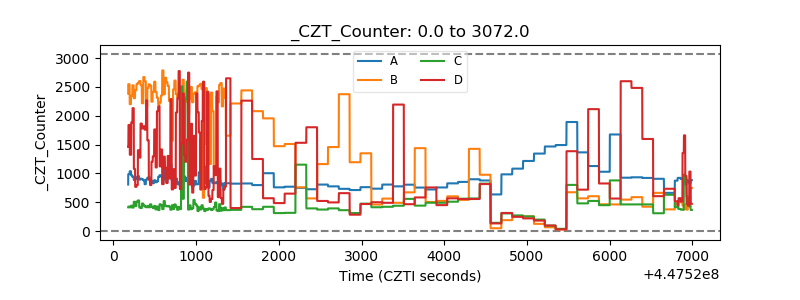 |
| +2.5 Volts monitor | 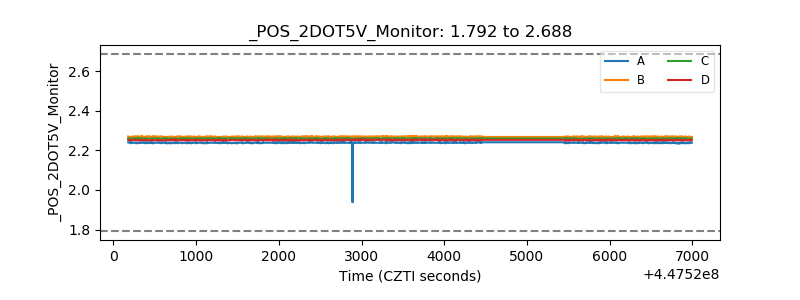 |
| +5 Volts monitor | 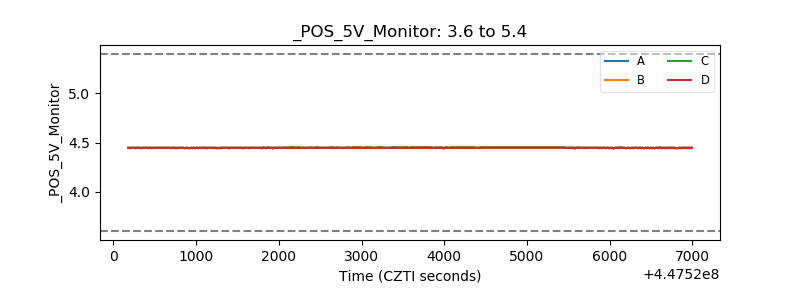 |
| _ROLL_ROT | 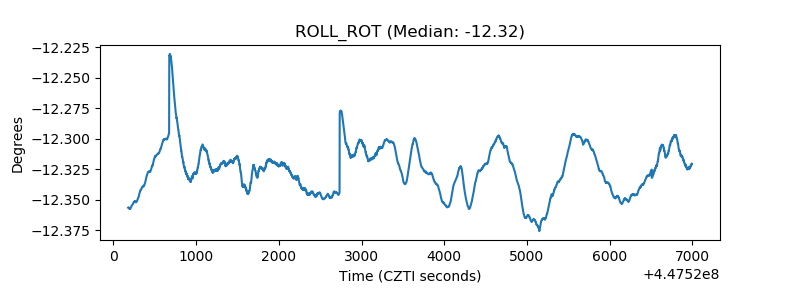 |
| _Roll_DEC | 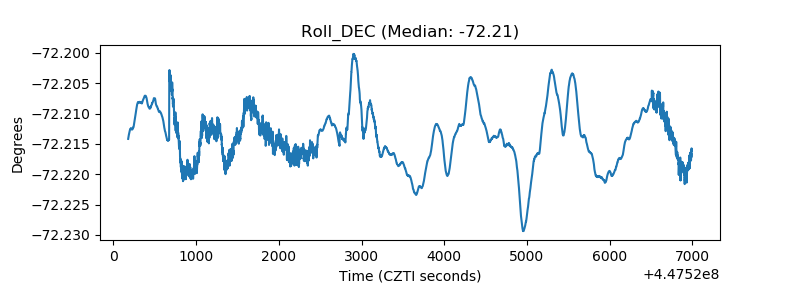 |
| _Roll_RA | 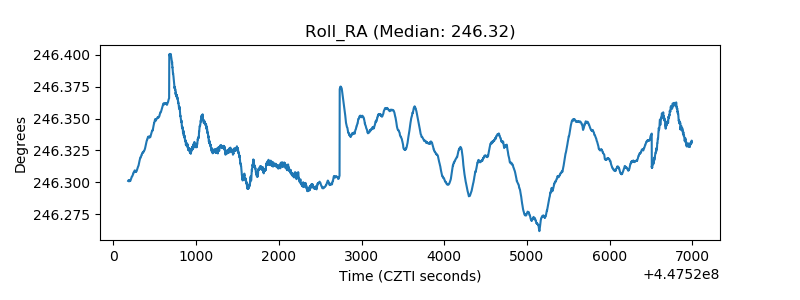 |
| Veto Counter | 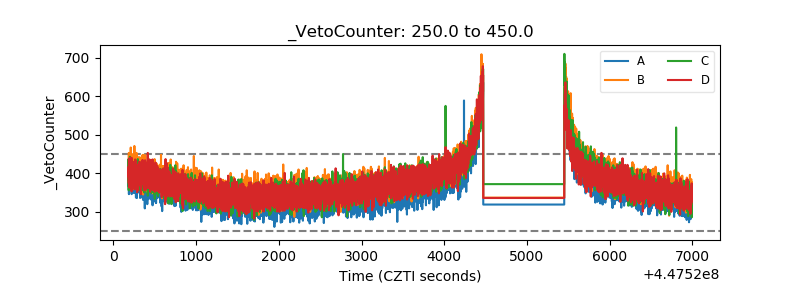 |