| Param | Original file | Final file |
|---|---|---|
| Filename | modeM0/AS1A13_071T07_9000006116_45651cztM0_level2.fits | modeM0/AS1A13_071T07_9000006116_45651cztM0_level2_quad_clean.evt |
| Size (bytes) | 595,872,000 | 108,403,200 |
| Size | 568.3 MB | 103.4 MB |
| Events in quadrant A | 6,193,960 | 742,331 |
| Events in quadrant B | 4,392,071 | 736,715 |
| Events in quadrant C | 3,819,166 | 740,711 |
| Events in quadrant D | 7,115,222 | 580,150 |
| Mode M9 | |||
|---|---|---|---|
| Quadrant | BADHDUFLAG | Total packets | Discarded packets |
| A | 0 | 6 | 0 |
| B | 0 | 6 | 0 |
| C | 0 | 6 | 0 |
| D | 0 | 6 | 0 |
| Mode M0 | |||
|---|---|---|---|
| Quadrant | BADHDUFLAG | Total packets | Discarded packets |
| A | 0 | 23128 | 2 |
| B | 0 | 17644 | 1 |
| C | 0 | 16186 | 1 |
| D | 0 | 25826 | 1 |
| Mode SS | |||
|---|---|---|---|
| Quadrant | BADHDUFLAG | Total packets | Discarded packets |
| A | 0 | 140 | 0 |
| B | 0 | 140 | 0 |
| C | 0 | 140 | 0 |
| D | 0 | 140 | 0 |
| Quadrant | Total seconds | Saturated seconds | Saturation percentage |
|---|---|---|---|
| A | 6922 | 315 | 4.550708% |
| B | 6923 | 483 | 6.976744% |
| C | 6923 | 154 | 2.224469% |
| D | 6923 | 1292 | 18.662430% |
Noise dominated data is calculated using 1-second bins in cleaned event files. If a bin has >2000 counts, and if more than 50% of those come from <1% of pixels, then it is considered to be noise-dominated and hence unusable.
| Quadrant | # 1 sec bins | Bins with >0 counts | Bins with >2000 counts | High rate bins dominated by noise | Noise dominated (total time) | Noise dominated (detector-on time) | Marked lightcurve |
|---|---|---|---|---|---|---|---|
| A | 7482 | 6923 | 35 | 35 | 0.47% | 0.51% | 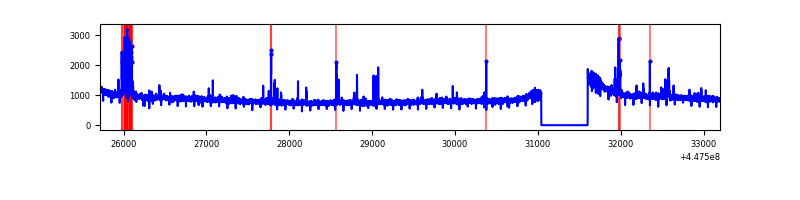 |
| B | 7483 | 6924 | 247 | 247 | 3.30% | 3.57% | 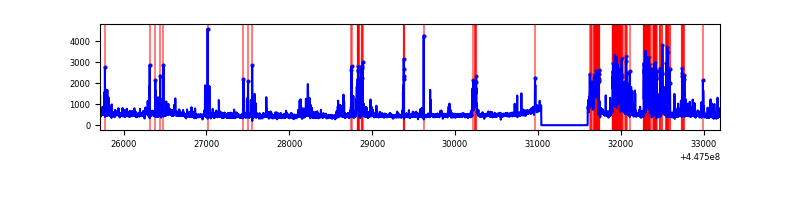 |
| C | 7483 | 6924 | 88 | 88 | 1.18% | 1.27% | 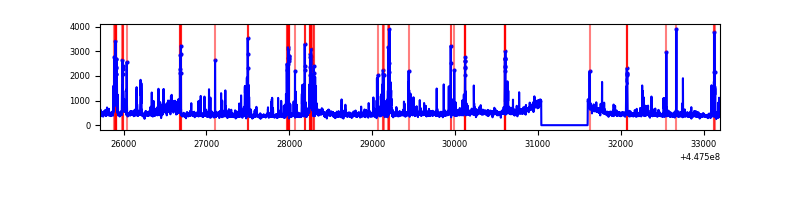 |
| D | 7483 | 6924 | 1090 | 1090 | 14.57% | 15.74% | 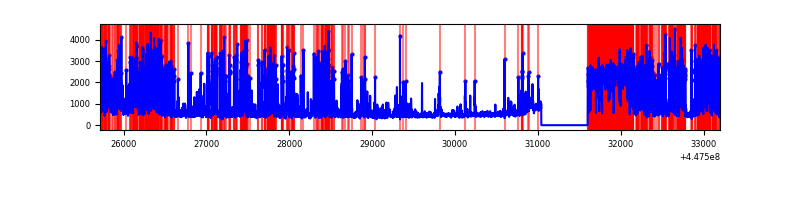 |
Top three noisy pixels from each quadrant. If the there are fewer than three noisy pixels in the level2.evt file, extra rows are filled as -1
| Pixel properties | Quadrant properties | ||||||
|---|---|---|---|---|---|---|---|
| Quadrant | DetID | PixID | Counts | Sigma | Mean | Median | Sigma |
| A | 10 | 83 | 3001774 | 18906.74 | 766 | 751 | 158.7 |
| A | 13 | 248 | 101866 | 637.03 | 766 | 751 | 158.7 |
| A | 0 | 243 | 38351 | 236.88 | 766 | 751 | 158.7 |
| B | 3 | 112 | 504840 | 3427.82 | 753 | 730 | 147.1 |
| B | 12 | 18 | 250174 | 1696.15 | 753 | 730 | 147.1 |
| B | 5 | 172 | 214087 | 1450.77 | 753 | 730 | 147.1 |
| C | 14 | 254 | 623525 | 3549.22 | 753 | 757 | 175.5 |
| C | 9 | 54 | 169428 | 961.27 | 753 | 757 | 175.5 |
| C | 12 | 2 | 22513 | 123.99 | 753 | 757 | 175.5 |
| D | 8 | 129 | 3385570 | 19779.86 | 680 | 658 | 171.1 |
| D | 1 | 52 | 467194 | 2726.22 | 680 | 658 | 171.1 |
| D | 11 | 241 | 187508 | 1091.86 | 680 | 658 | 171.1 |
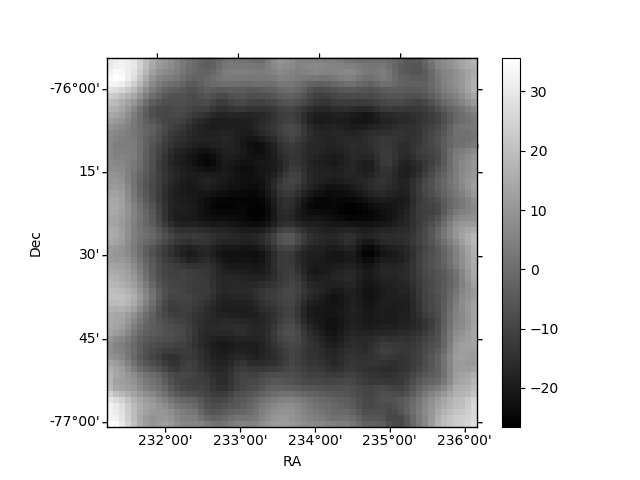
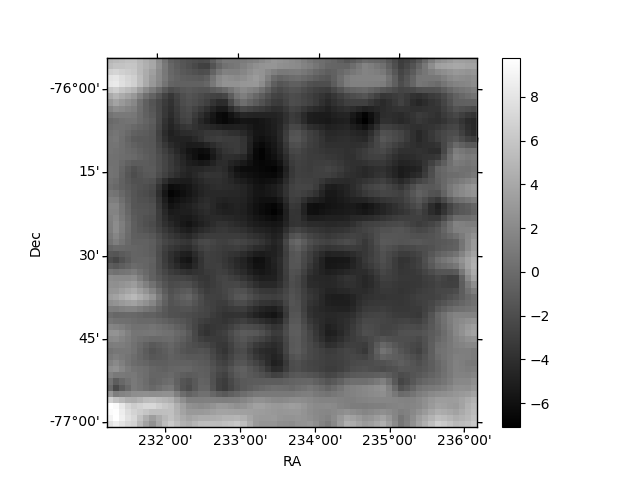
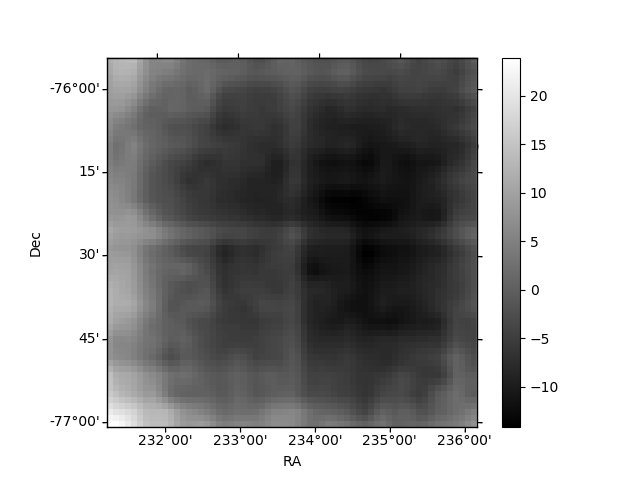
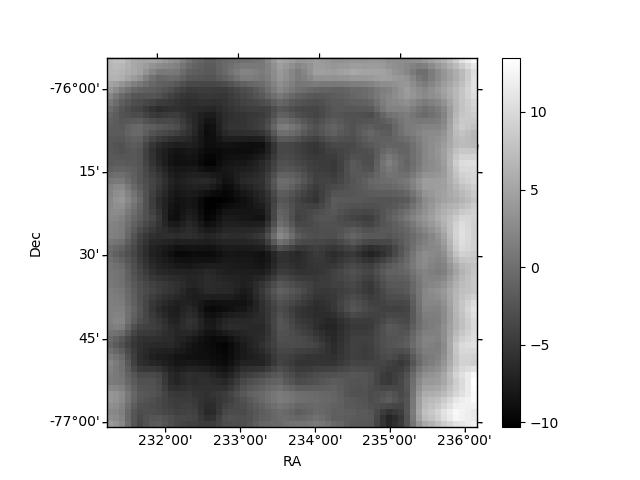
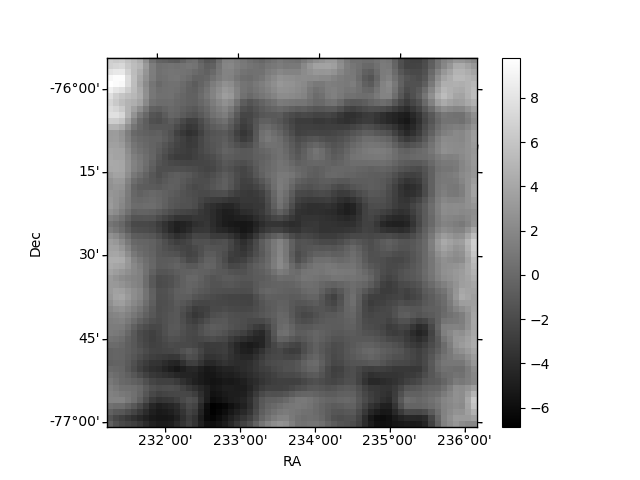
Histogram calculated using DETX and DETY for each event in the final _common_clean file
| Quadrant A | 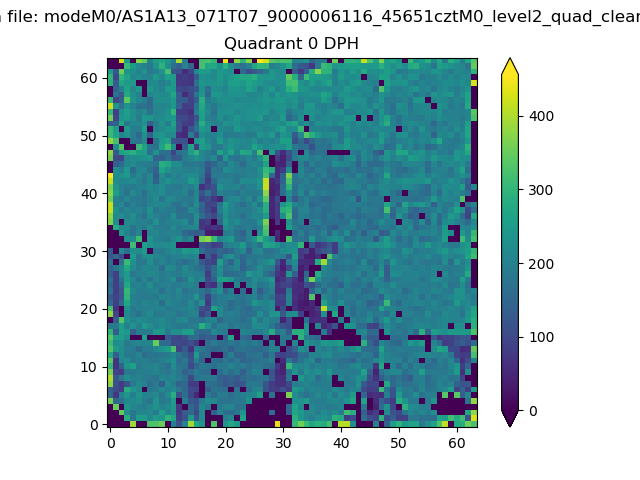 |
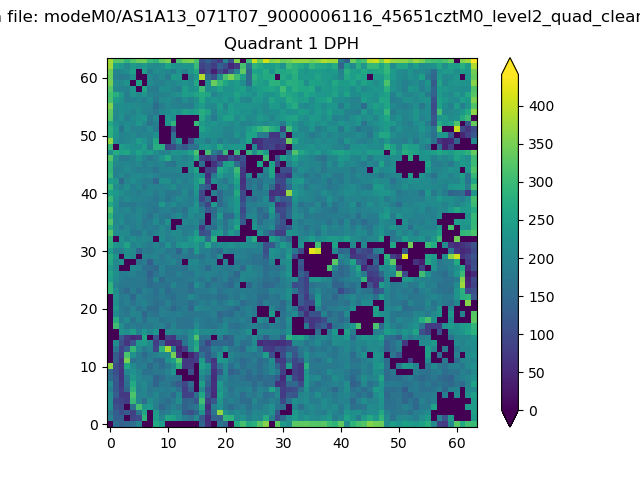 |
Quadrant B |
|---|---|---|---|
| Quadrant D | 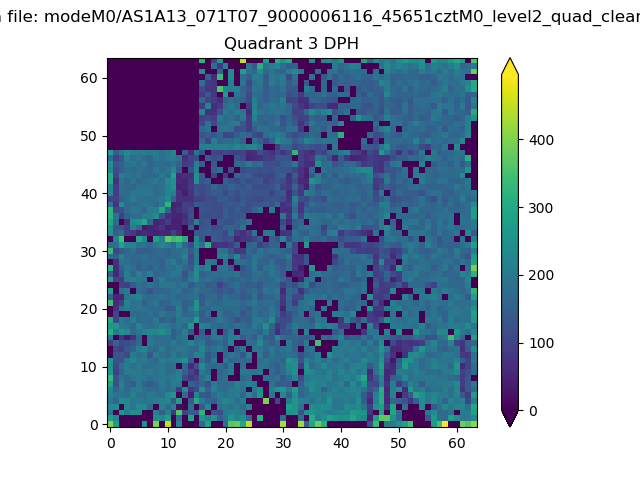 |
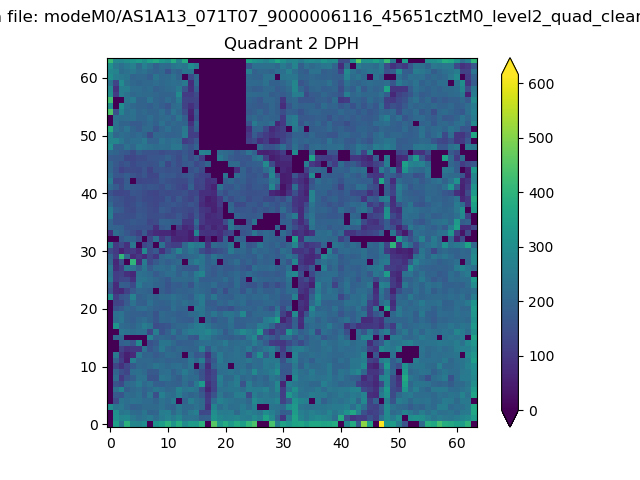 |
Quadrant C |
| Plot type | Count rate plots | Images |
|---|---|---|
| Comparison with Poisson distribution Blue bars denote a histogram of data divided into 1 sec bins. Red curve is a Poisson curve with rate = median count rate of data. |
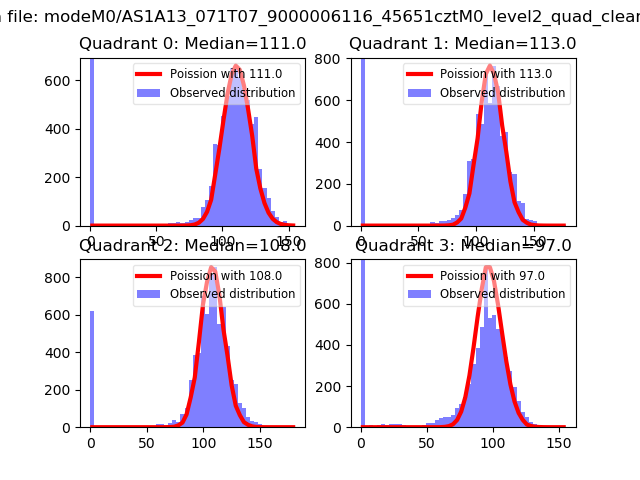 |
 |
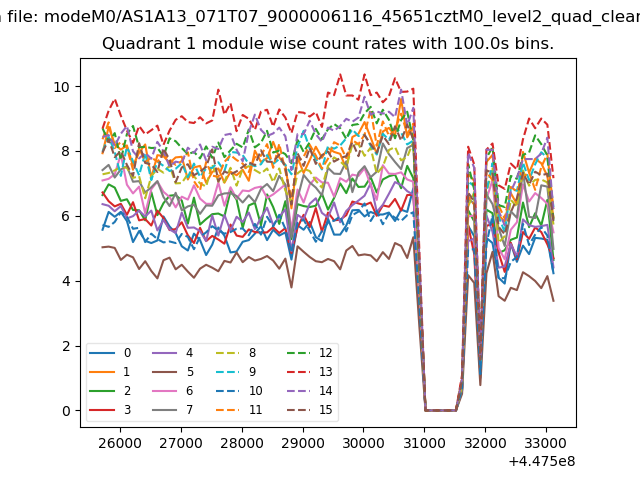
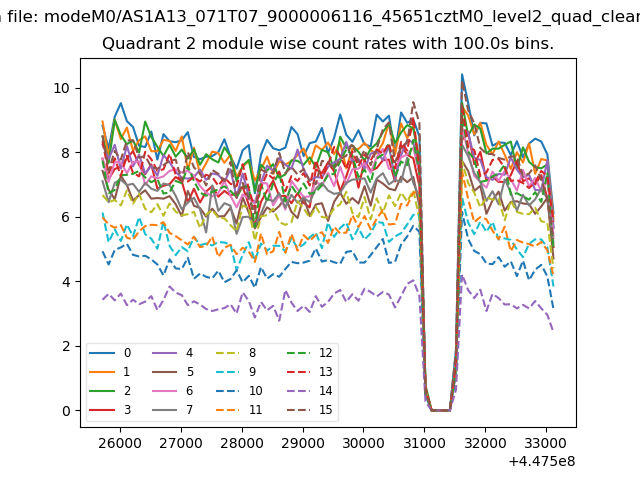
| Quadrant-wise count rates Data is divided into 100 sec bins |
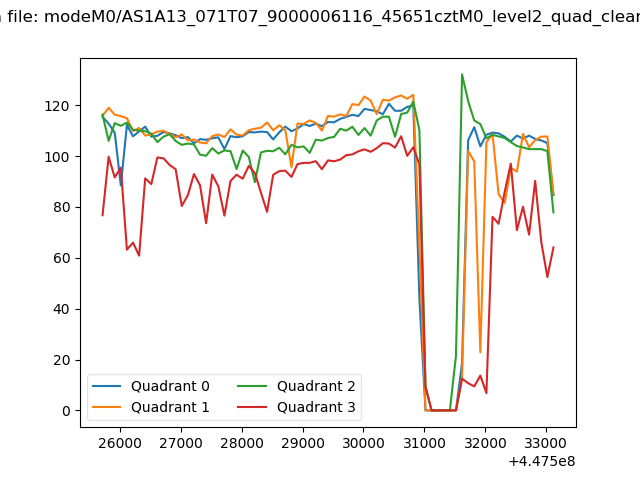 |
|
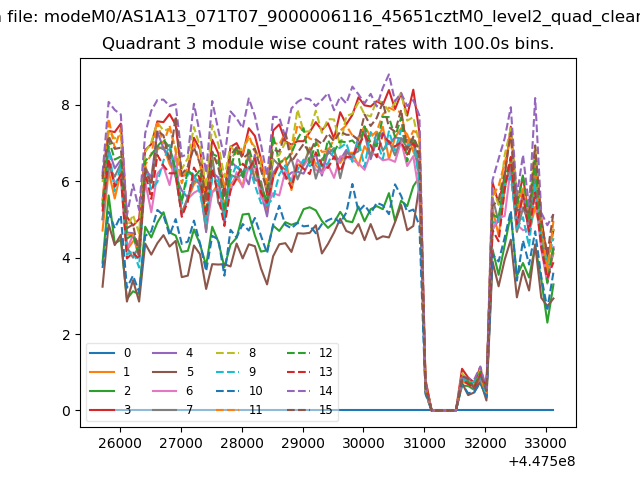
| Module-wise count rates for Quadrant A Data is divided into 100 sec bins |
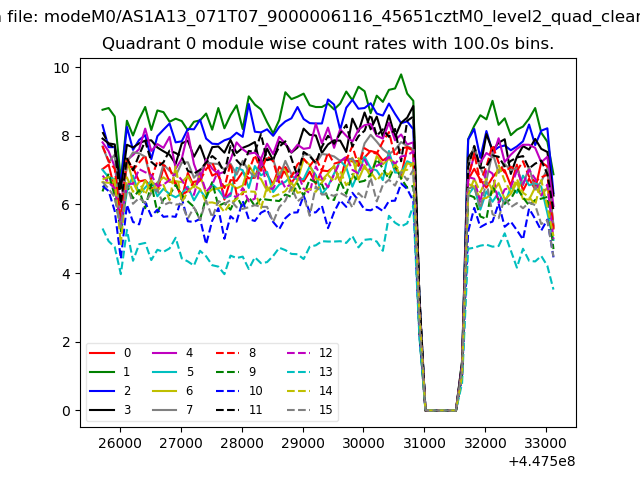 |
 |
| Module-wise count rates for Quadrant B Data is divided into 100 sec bins |
 |
 |
| Module-wise count rates for Quadrant C Data is divided into 100 sec bins |
 |
 |
| Module-wise count rates for Quadrant D Data is divided into 100 sec bins |
 |
 |
| Parameter | Plot |
|---|---|
| CZT HV Monitor | 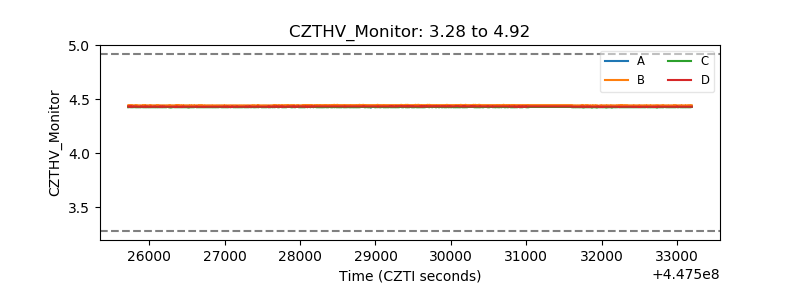 |
| D_VDD | 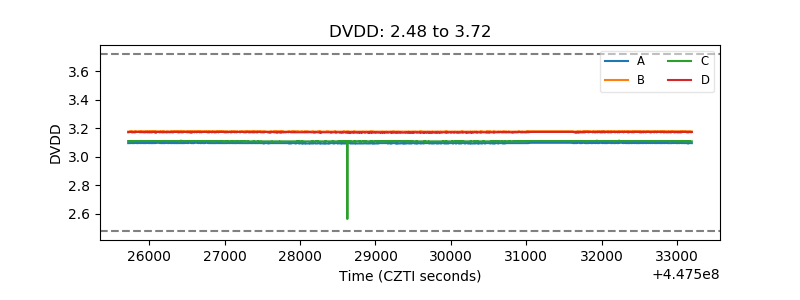 |
| Temperature 1 | 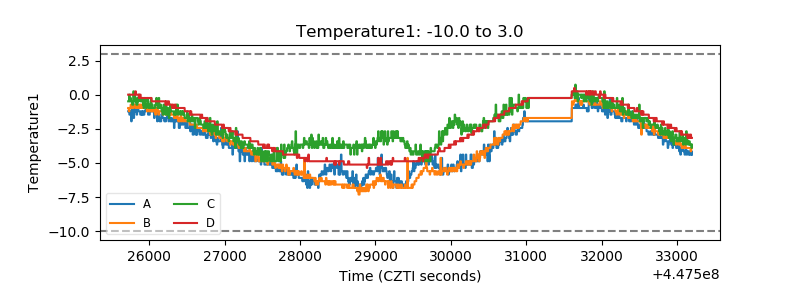 |
| Veto HV Monitor | 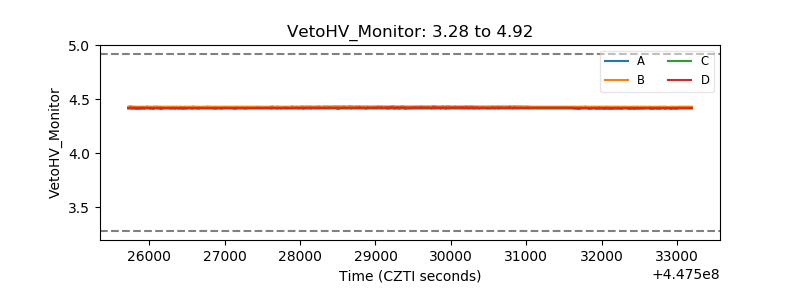 |
| Veto LLD | 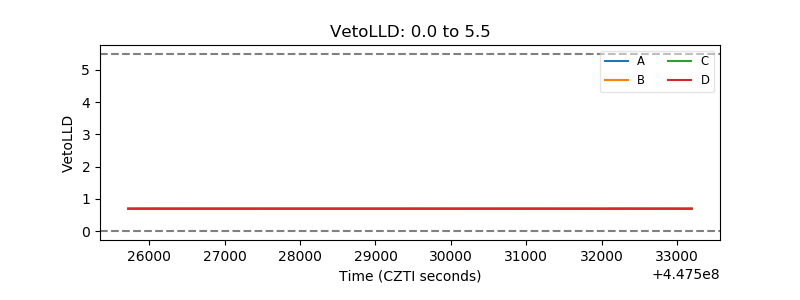 |
| Alpha Counter | 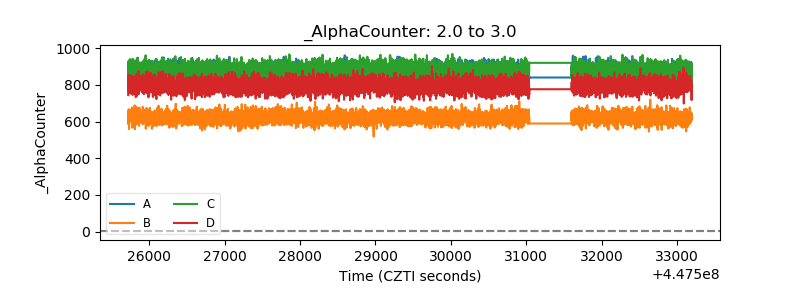 |
| _CPM_Rate | 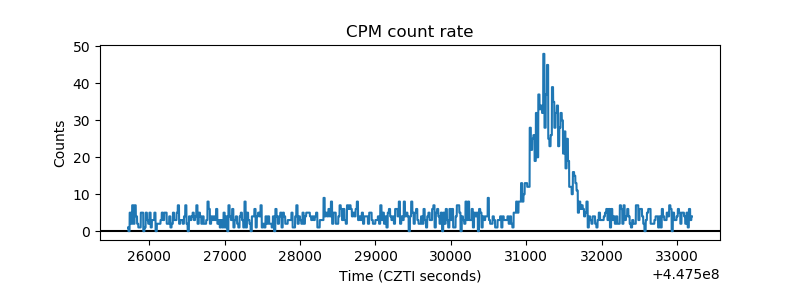 |
| CZT Counter | 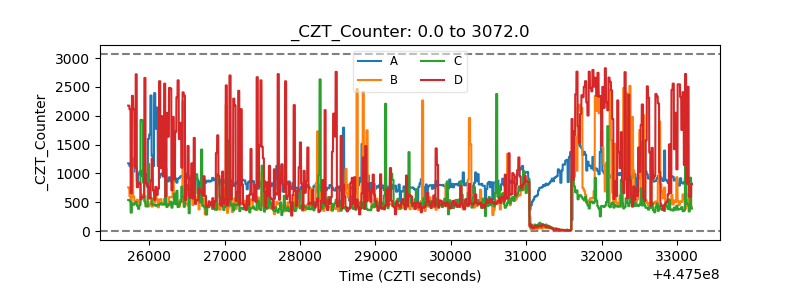 |
| +2.5 Volts monitor |  |
| +5 Volts monitor | 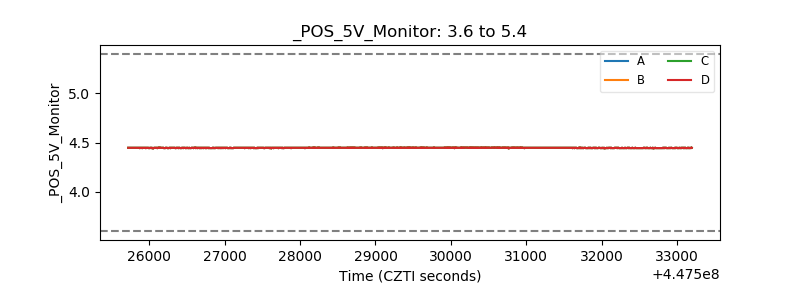 |
| _ROLL_ROT | 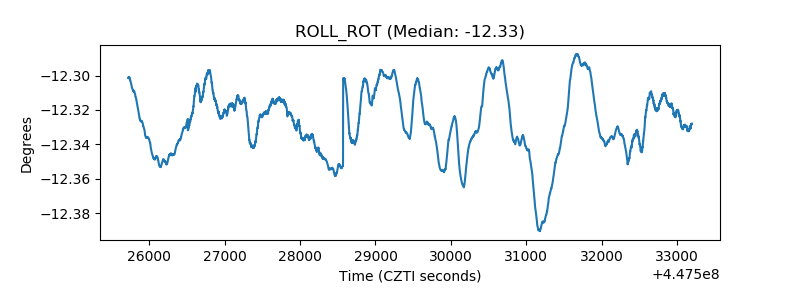 |
| _Roll_DEC | 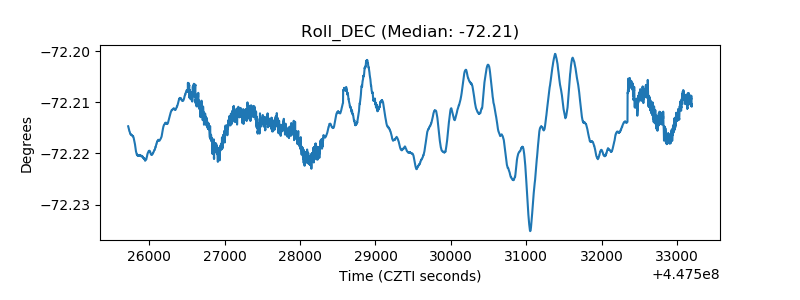 |
| _Roll_RA | 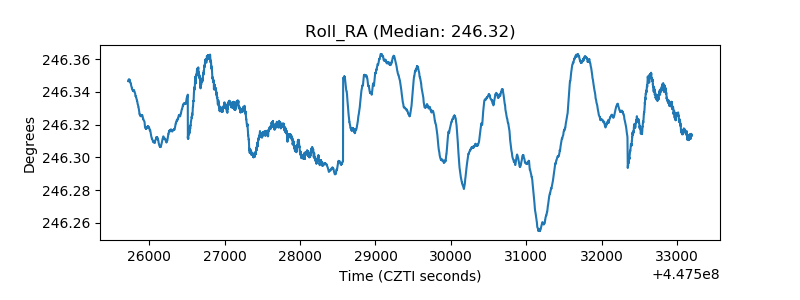 |
| Veto Counter | 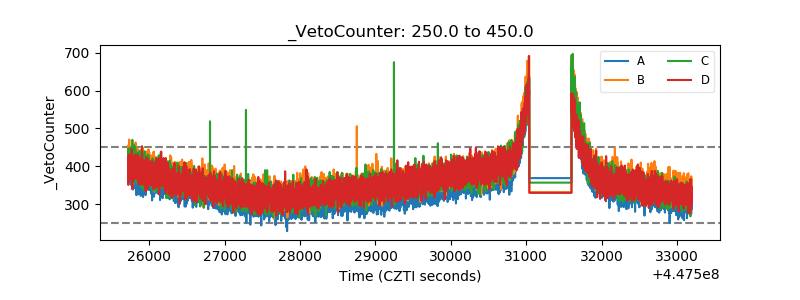 |