| Param | Original file | Final file |
|---|---|---|
| Filename | modeM0/AS1A13_071T07_9000006116_45652cztM0_level2.fits | modeM0/AS1A13_071T07_9000006116_45652cztM0_level2_quad_clean.evt |
| Size (bytes) | 616,682,880 | 116,830,080 |
| Size | 588.1 MB | 111.4 MB |
| Events in quadrant A | 6,403,193 | 799,752 |
| Events in quadrant B | 4,454,730 | 802,951 |
| Events in quadrant C | 3,962,984 | 771,694 |
| Events in quadrant D | 7,435,430 | 649,229 |
| Mode M0 | |||
|---|---|---|---|
| Quadrant | BADHDUFLAG | Total packets | Discarded packets |
| A | 0 | 24169 | 0 |
| B | 0 | 18293 | 0 |
| C | 0 | 17218 | 0 |
| D | 0 | 27186 | 1 |
| Mode SS | |||
|---|---|---|---|
| Quadrant | BADHDUFLAG | Total packets | Discarded packets |
| A | 0 | 148 | 0 |
| B | 0 | 148 | 0 |
| C | 0 | 148 | 0 |
| D | 0 | 148 | 0 |
| Quadrant | Total seconds | Saturated seconds | Saturation percentage |
|---|---|---|---|
| A | 7375 | 199 | 2.698305% |
| B | 7376 | 316 | 4.284165% |
| C | 7376 | 185 | 2.508134% |
| D | 7375 | 1004 | 13.613559% |
Noise dominated data is calculated using 1-second bins in cleaned event files. If a bin has >2000 counts, and if more than 50% of those come from <1% of pixels, then it is considered to be noise-dominated and hence unusable.
| Quadrant | # 1 sec bins | Bins with >0 counts | Bins with >2000 counts | High rate bins dominated by noise | Noise dominated (total time) | Noise dominated (detector-on time) | Marked lightcurve |
|---|---|---|---|---|---|---|---|
| A | 7375 | 7375 | 13 | 13 | 0.18% | 0.18% | 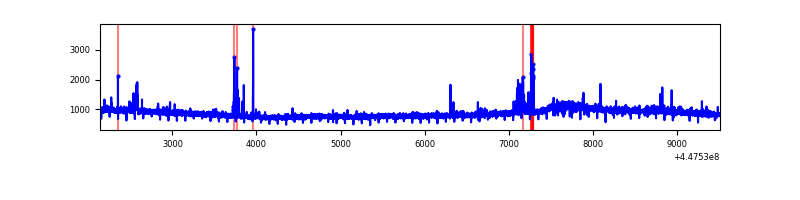 |
| B | 7376 | 7376 | 153 | 153 | 2.07% | 2.07% | 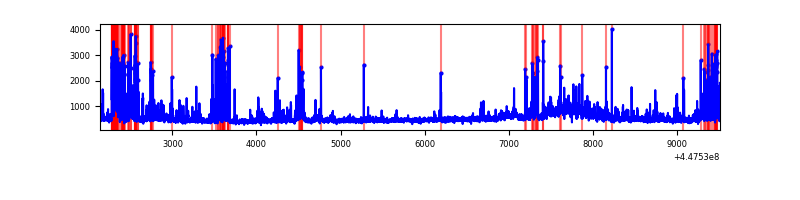 |
| C | 7376 | 7376 | 140 | 140 | 1.90% | 1.90% | 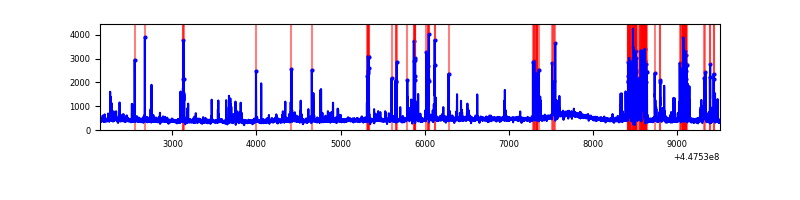 |
| D | 7375 | 7375 | 867 | 867 | 11.76% | 11.76% | 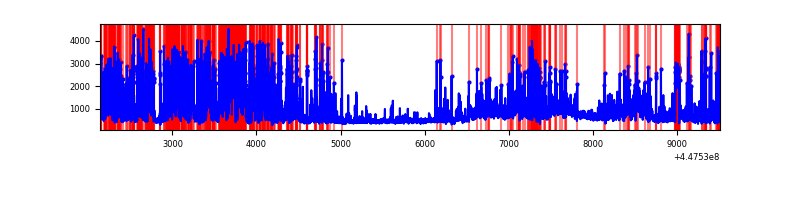 |
Top three noisy pixels from each quadrant. If the there are fewer than three noisy pixels in the level2.evt file, extra rows are filled as -1
| Pixel properties | Quadrant properties | ||||||
|---|---|---|---|---|---|---|---|
| Quadrant | DetID | PixID | Counts | Sigma | Mean | Median | Sigma |
| A | 10 | 83 | 3038396 | 17713.44 | 820 | 801 | 171.5 |
| A | 2 | 79 | 68472 | 394.62 | 820 | 801 | 171.5 |
| A | 0 | 243 | 28636 | 162.32 | 820 | 801 | 171.5 |
| B | 5 | 172 | 410101 | 2586.92 | 811 | 785 | 158.2 |
| B | 12 | 18 | 240434 | 1514.61 | 811 | 785 | 158.2 |
| B | 0 | 183 | 128434 | 806.76 | 811 | 785 | 158.2 |
| C | 14 | 254 | 800479 | 4308.13 | 793 | 795 | 185.6 |
| C | 9 | 54 | 15235 | 77.79 | 793 | 795 | 185.6 |
| C | 0 | 64 | 15155 | 77.36 | 793 | 795 | 185.6 |
| D | 8 | 129 | 2545392 | 13180.34 | 759 | 731 | 193.1 |
| D | 1 | 52 | 908125 | 4699.94 | 759 | 731 | 193.1 |
| D | 11 | 241 | 497701 | 2574.11 | 759 | 731 | 193.1 |
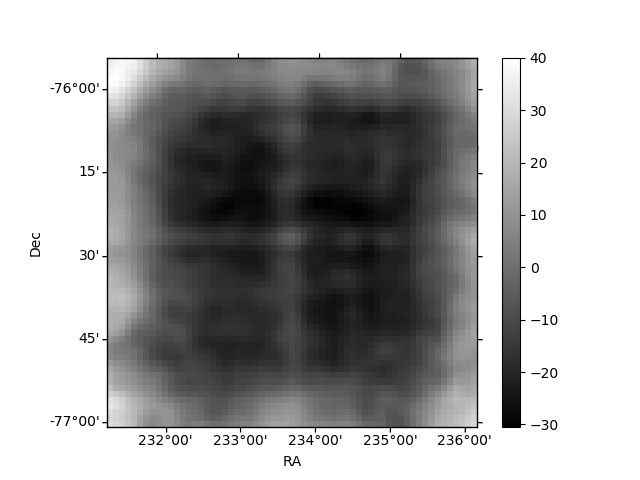
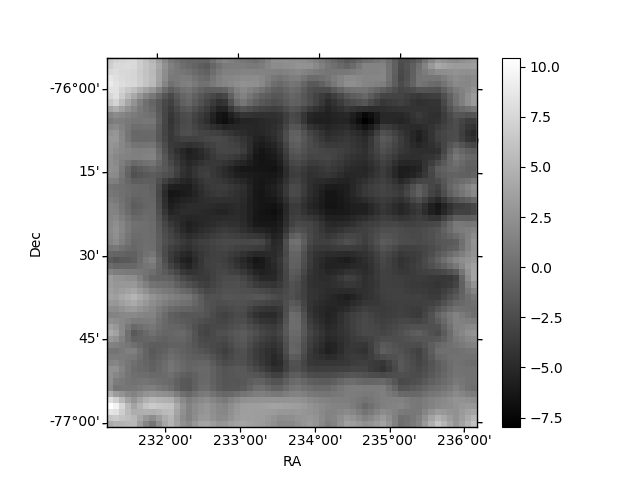
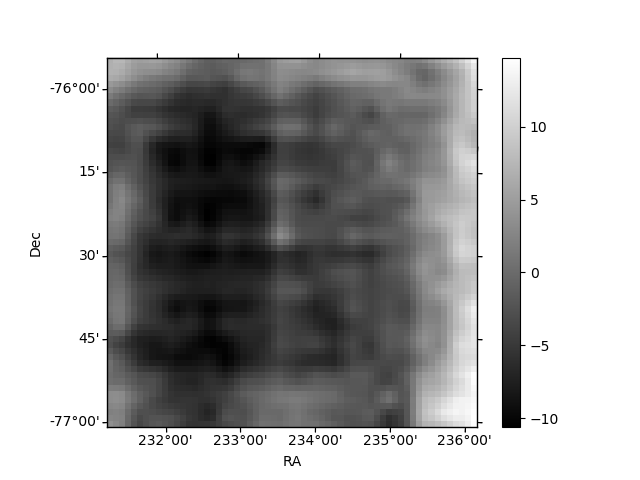
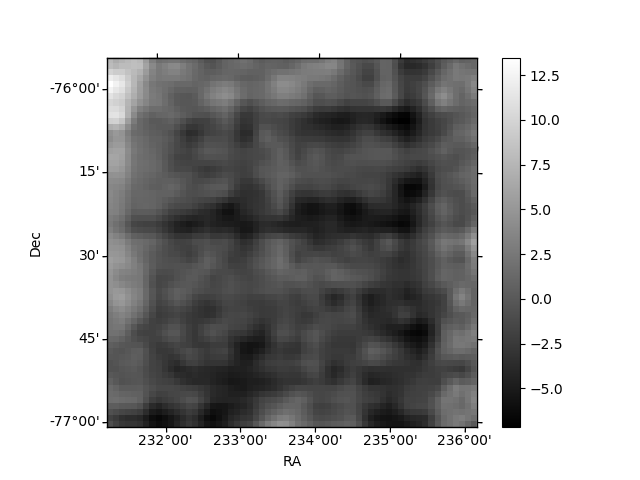
Histogram calculated using DETX and DETY for each event in the final _common_clean file
| Quadrant A | 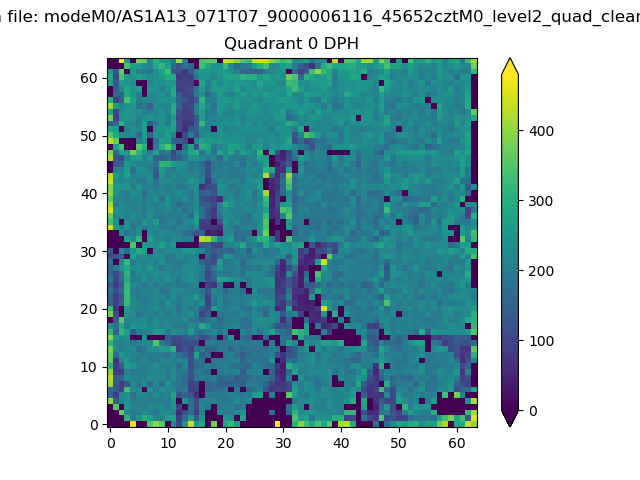 |
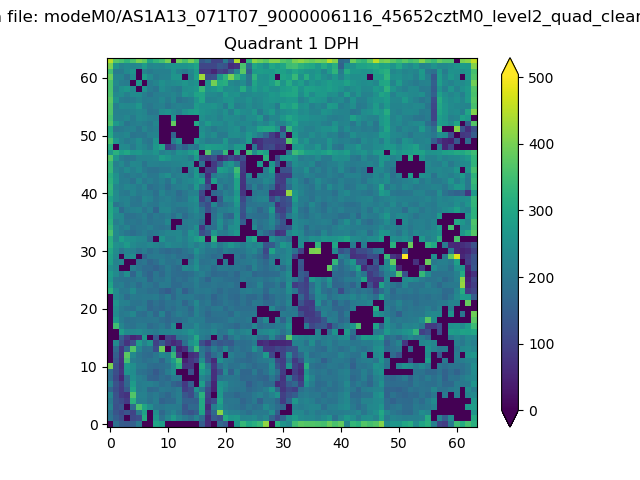 |
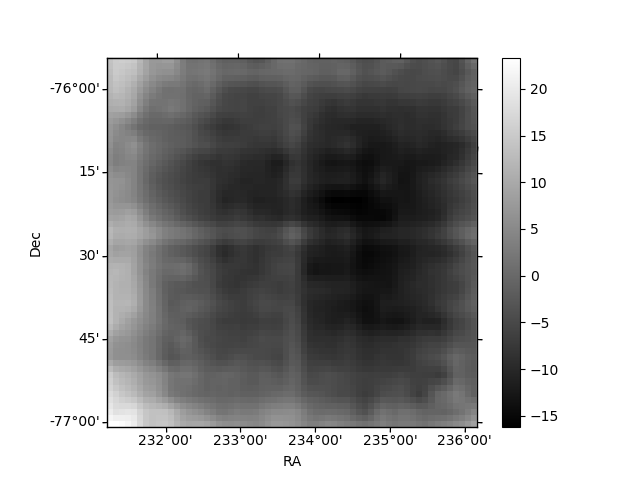
Quadrant B |
|---|---|---|---|
| Quadrant D | 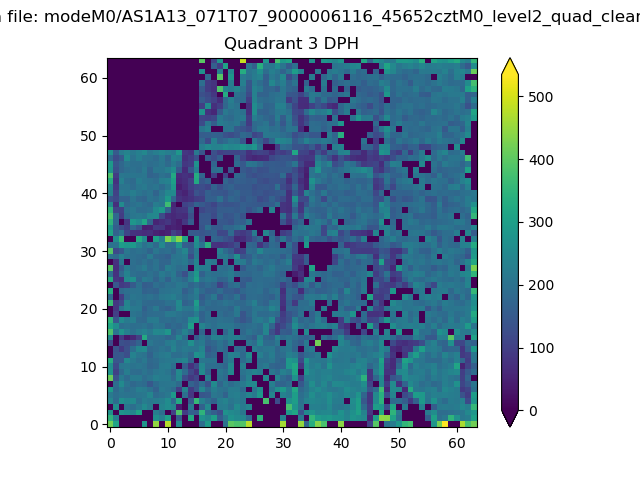 |
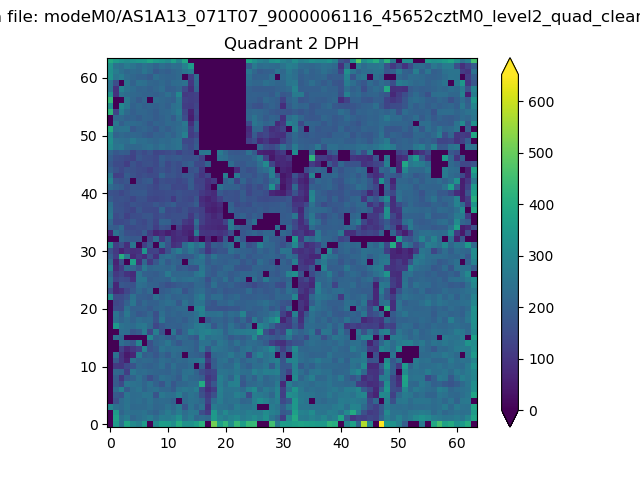 |
Quadrant C |
| Plot type | Count rate plots | Images |
|---|---|---|
| Comparison with Poisson distribution Blue bars denote a histogram of data divided into 1 sec bins. Red curve is a Poisson curve with rate = median count rate of data. |
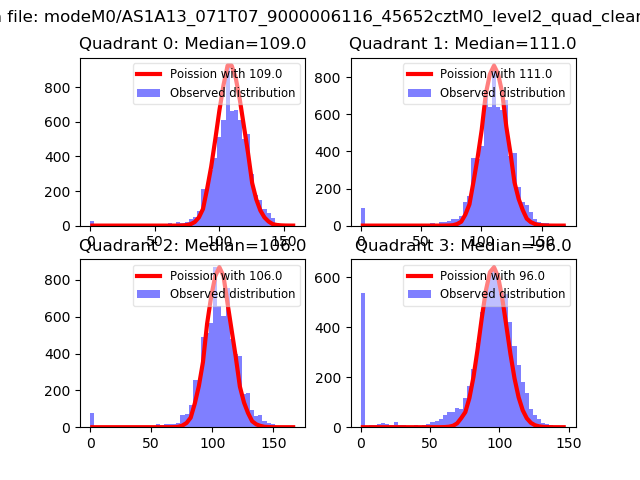 |
 |
| Quadrant-wise count rates Data is divided into 100 sec bins |
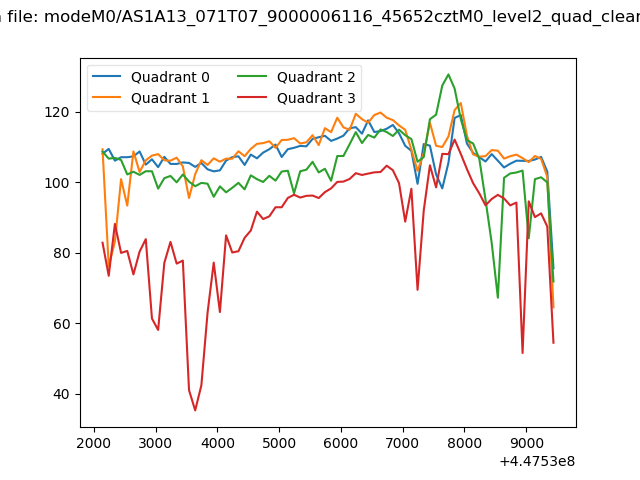 |
|
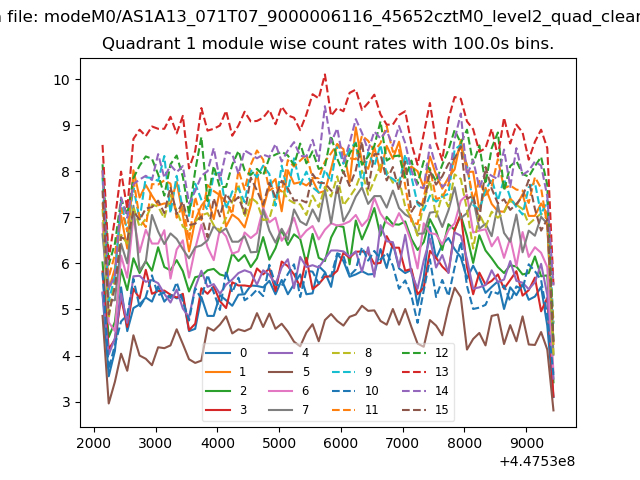
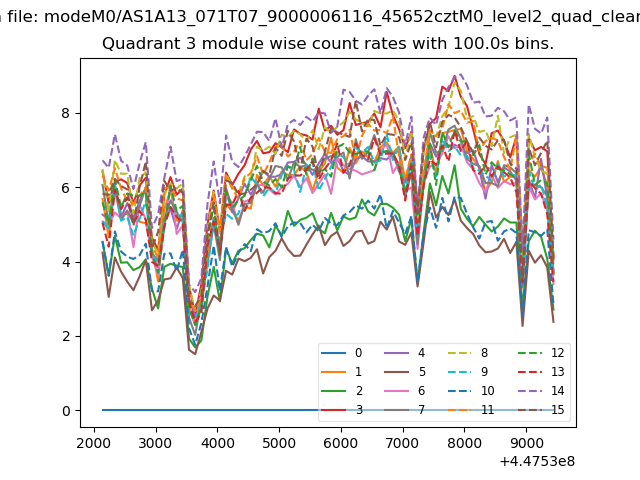
| Module-wise count rates for Quadrant A Data is divided into 100 sec bins |
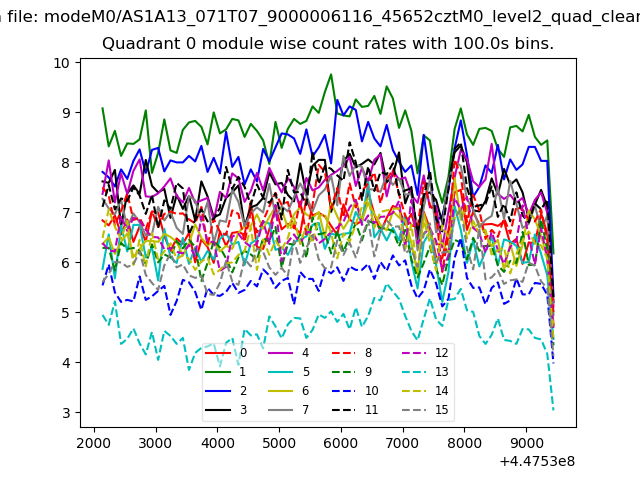 |
 |
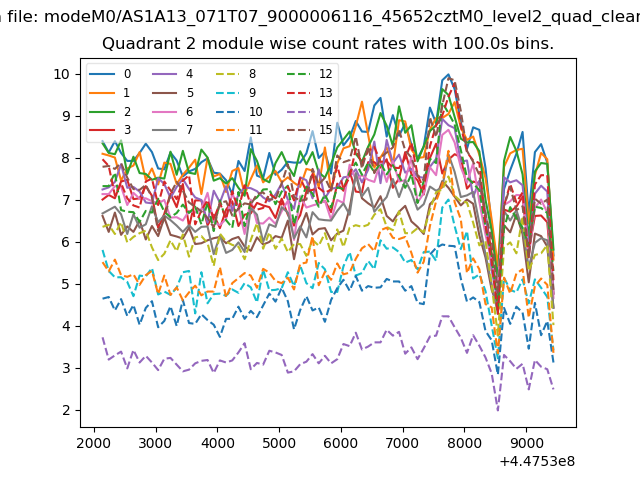
| Module-wise count rates for Quadrant B Data is divided into 100 sec bins |
 |
 |
| Module-wise count rates for Quadrant C Data is divided into 100 sec bins |
 |
 |
| Module-wise count rates for Quadrant D Data is divided into 100 sec bins |
 |
 |
| Parameter | Plot |
|---|---|
| CZT HV Monitor |  |
| D_VDD | 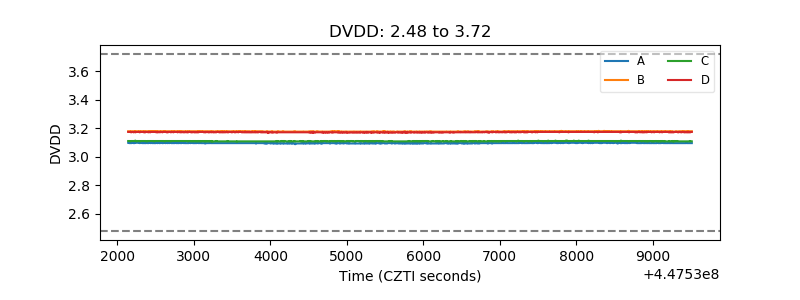 |
| Temperature 1 | 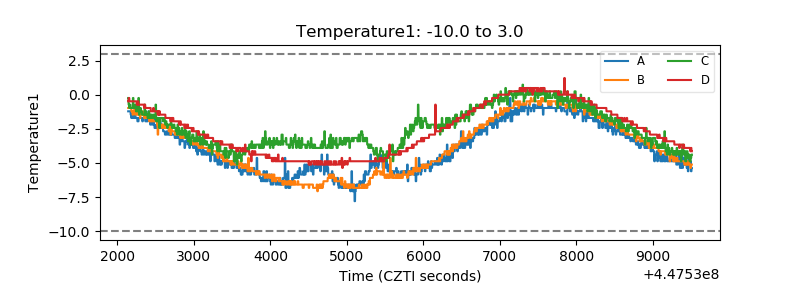 |
| Veto HV Monitor | 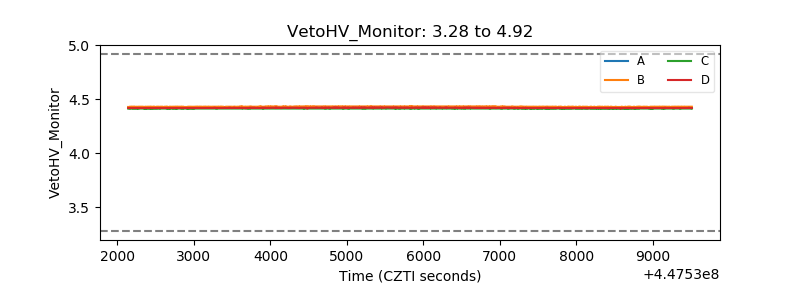 |
| Veto LLD | 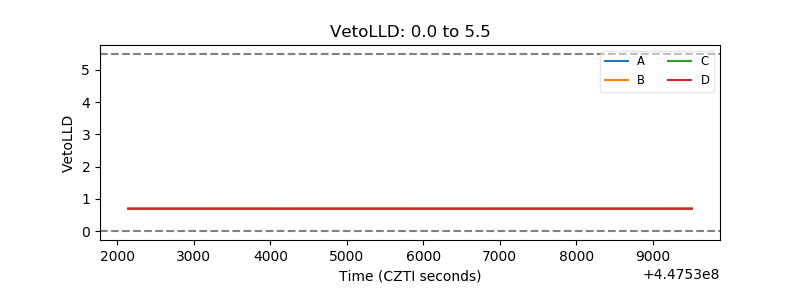 |
| Alpha Counter | 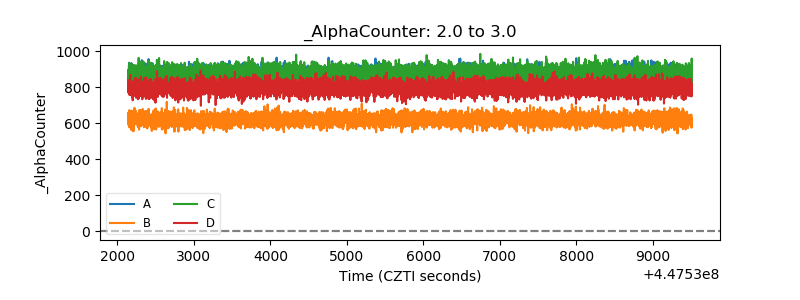 |
| _CPM_Rate | 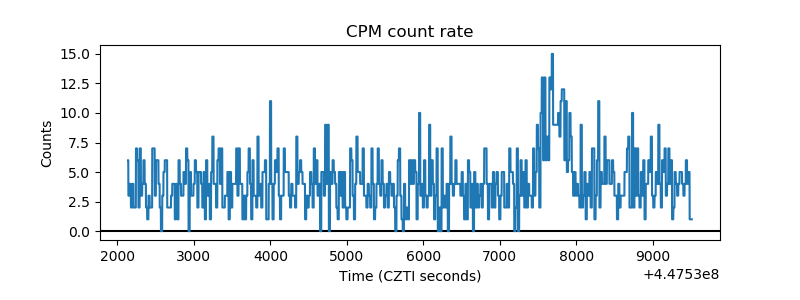 |
| CZT Counter | 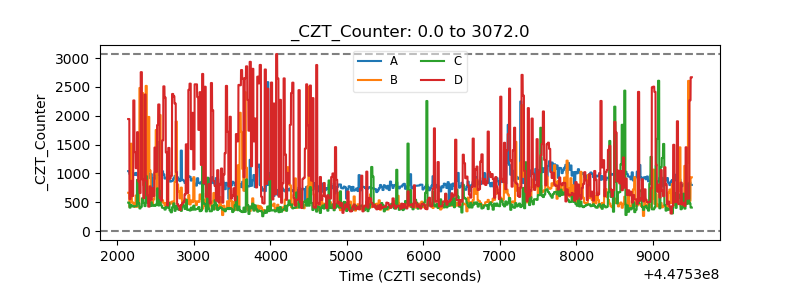 |
| +2.5 Volts monitor | 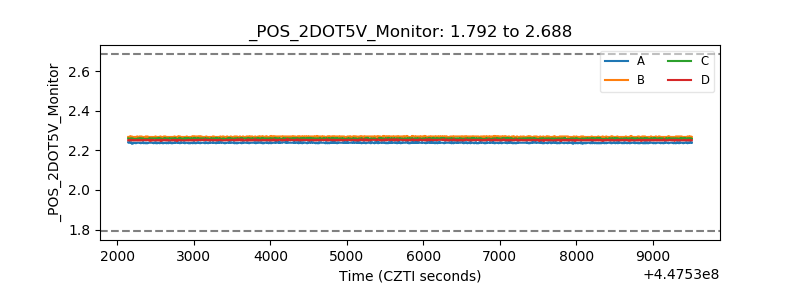 |
| +5 Volts monitor | 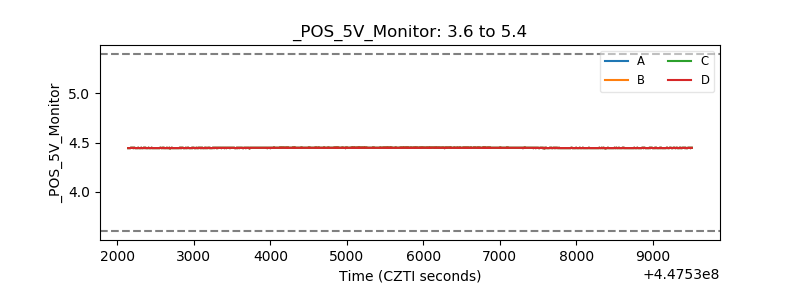 |
| _ROLL_ROT | 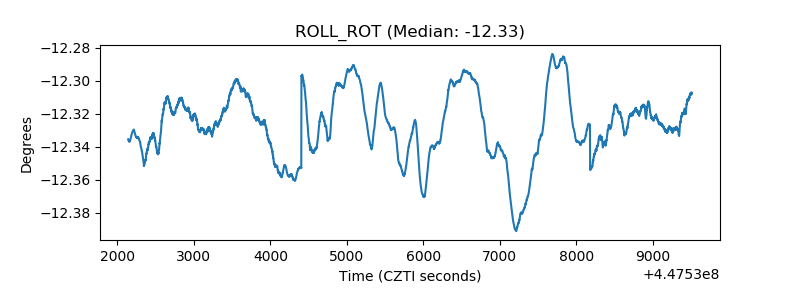 |
| _Roll_DEC | 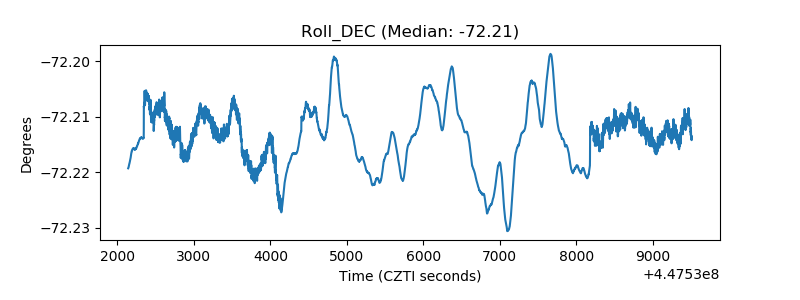 |
| _Roll_RA | 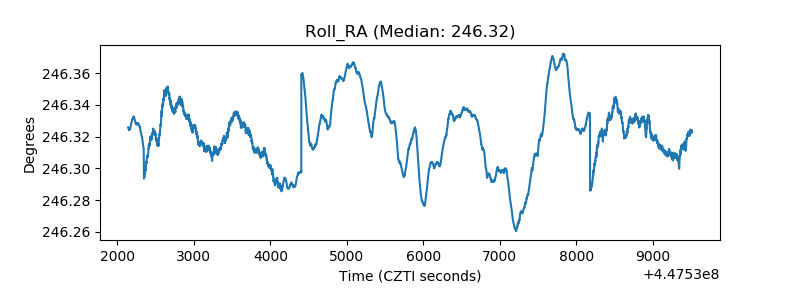 |
| Veto Counter | 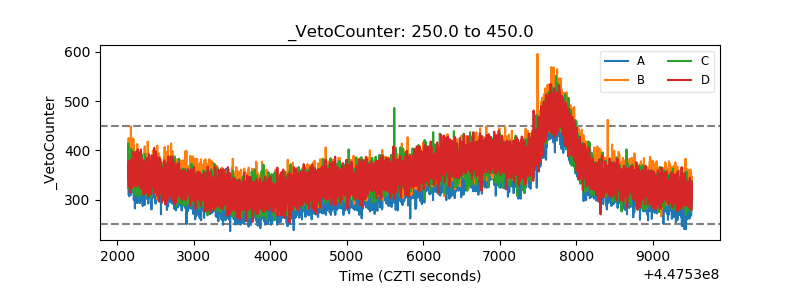 |