| Param | Original file | Final file |
|---|---|---|
| Filename | modeM0/AS1A13_071T07_9000006116_45653cztM0_level2.fits | modeM0/AS1A13_071T07_9000006116_45653cztM0_level2_quad_clean.evt |
| Size (bytes) | 619,372,800 | 129,525,120 |
| Size | 590.7 MB | 123.5 MB |
| Events in quadrant A | 6,940,198 | 875,417 |
| Events in quadrant B | 4,763,648 | 877,370 |
| Events in quadrant C | 4,126,067 | 851,698 |
| Events in quadrant D | 6,469,021 | 753,573 |
| Mode M0 | |||
|---|---|---|---|
| Quadrant | BADHDUFLAG | Total packets | Discarded packets |
| A | 0 | 26218 | 0 |
| B | 0 | 19718 | 0 |
| C | 0 | 18294 | 0 |
| D | 0 | 24832 | 0 |
| Mode SS | |||
|---|---|---|---|
| Quadrant | BADHDUFLAG | Total packets | Discarded packets |
| A | 0 | 162 | 0 |
| B | 0 | 162 | 0 |
| C | 0 | 162 | 0 |
| D | 0 | 162 | 0 |
| Quadrant | Total seconds | Saturated seconds | Saturation percentage |
|---|---|---|---|
| A | 8106 | 170 | 2.097212% |
| B | 8107 | 320 | 3.947206% |
| C | 8107 | 147 | 1.813248% |
| D | 8107 | 470 | 5.797459% |
Noise dominated data is calculated using 1-second bins in cleaned event files. If a bin has >2000 counts, and if more than 50% of those come from <1% of pixels, then it is considered to be noise-dominated and hence unusable.
| Quadrant | # 1 sec bins | Bins with >0 counts | Bins with >2000 counts | High rate bins dominated by noise | Noise dominated (total time) | Noise dominated (detector-on time) | Marked lightcurve |
|---|---|---|---|---|---|---|---|
| A | 8106 | 8106 | 5 | 5 | 0.06% | 0.06% | 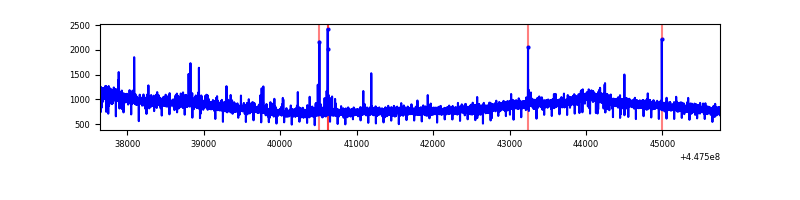 |
| B | 8107 | 8107 | 178 | 178 | 2.20% | 2.20% | 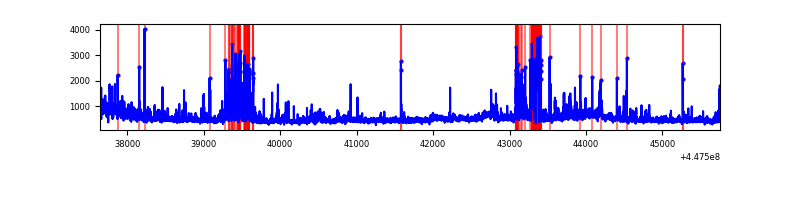 |
| C | 8107 | 8107 | 115 | 115 | 1.42% | 1.42% | 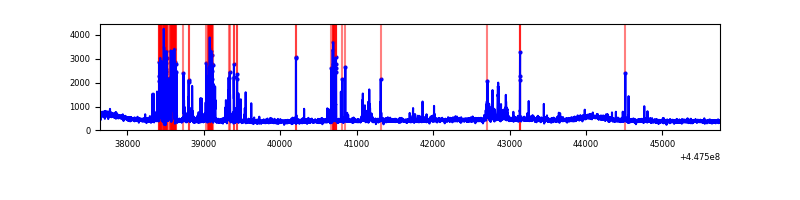 |
| D | 8107 | 8107 | 386 | 386 | 4.76% | 4.76% | 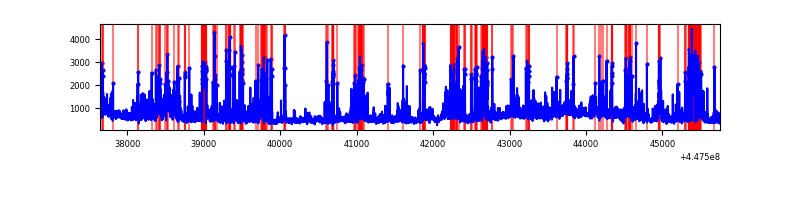 |
Top three noisy pixels from each quadrant. If the there are fewer than three noisy pixels in the level2.evt file, extra rows are filled as -1
| Pixel properties | Quadrant properties | ||||||
|---|---|---|---|---|---|---|---|
| Quadrant | DetID | PixID | Counts | Sigma | Mean | Median | Sigma |
| A | 10 | 83 | 3348640 | 17837.23 | 903 | 882 | 187.7 |
| A | 0 | 243 | 24205 | 124.27 | 903 | 882 | 187.7 |
| A | 13 | 210 | 19316 | 98.22 | 903 | 882 | 187.7 |
| B | 5 | 172 | 368984 | 2125.82 | 890 | 863 | 173.2 |
| B | 3 | 112 | 279980 | 1611.84 | 890 | 863 | 173.2 |
| B | 0 | 183 | 116277 | 666.49 | 890 | 863 | 173.2 |
| C | 14 | 254 | 553320 | 2712.01 | 872 | 874 | 203.7 |
| C | 2 | 14 | 93400 | 454.22 | 872 | 874 | 203.7 |
| C | 3 | 233 | 21276 | 100.16 | 872 | 874 | 203.7 |
| D | 1 | 52 | 1026373 | 4709.84 | 861 | 830 | 217.7 |
| D | 11 | 241 | 735687 | 3374.85 | 861 | 830 | 217.7 |
| D | 13 | 249 | 707521 | 3245.5 | 861 | 830 | 217.7 |
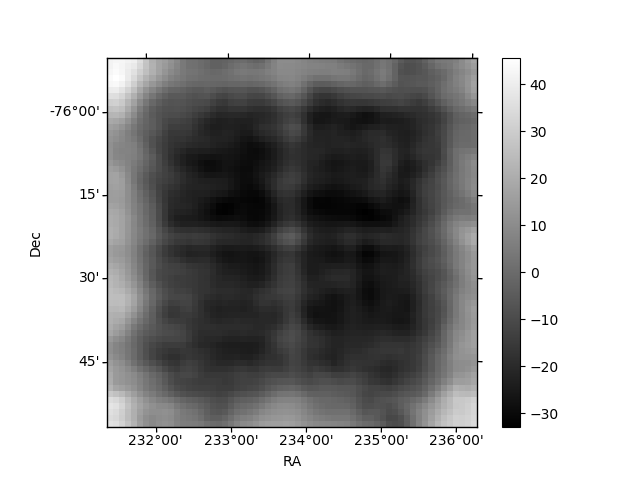
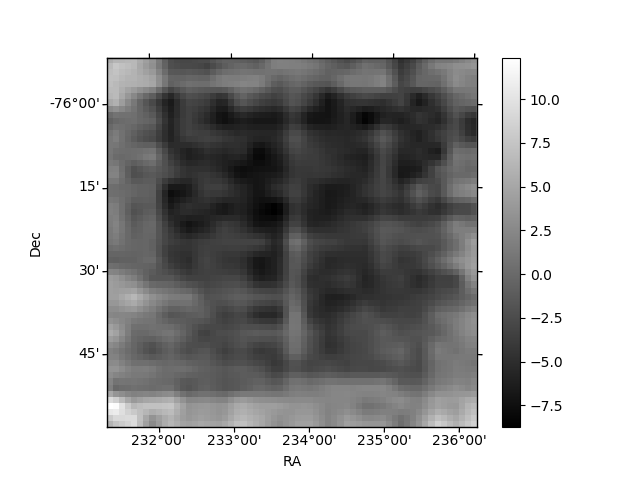
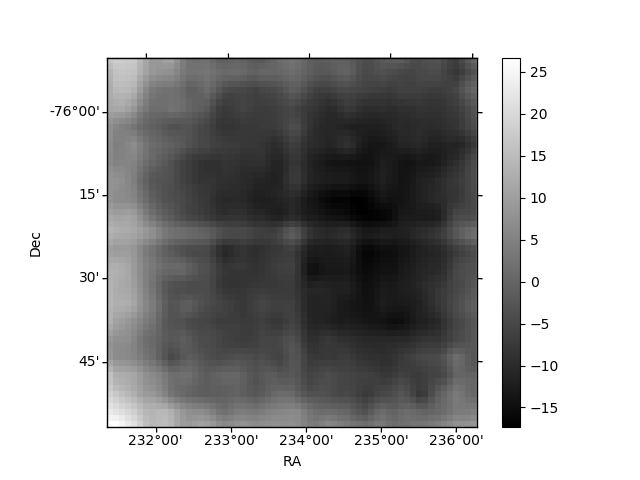
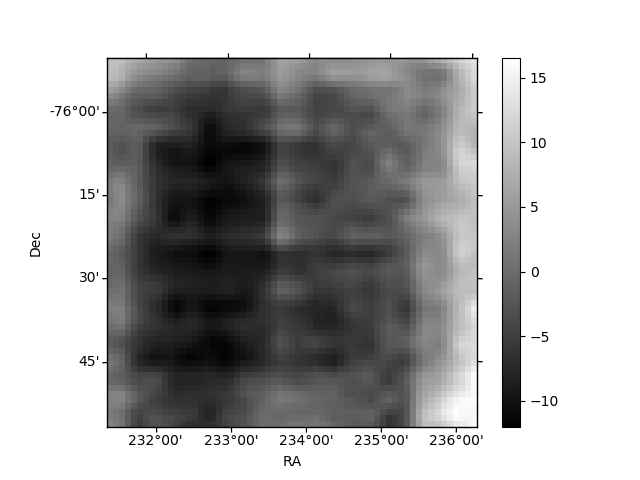
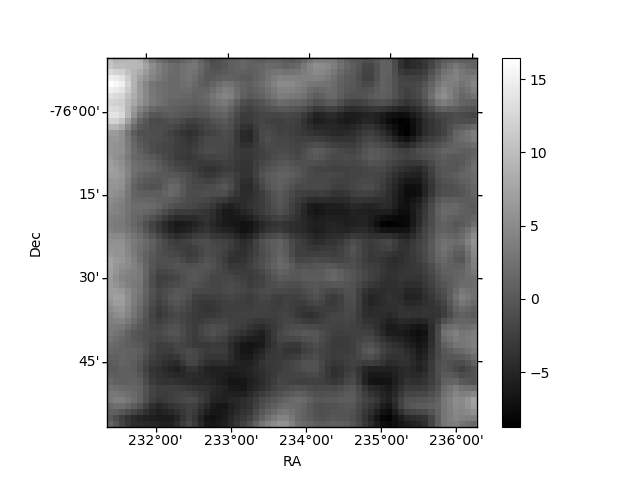
Histogram calculated using DETX and DETY for each event in the final _common_clean file
| Quadrant A | 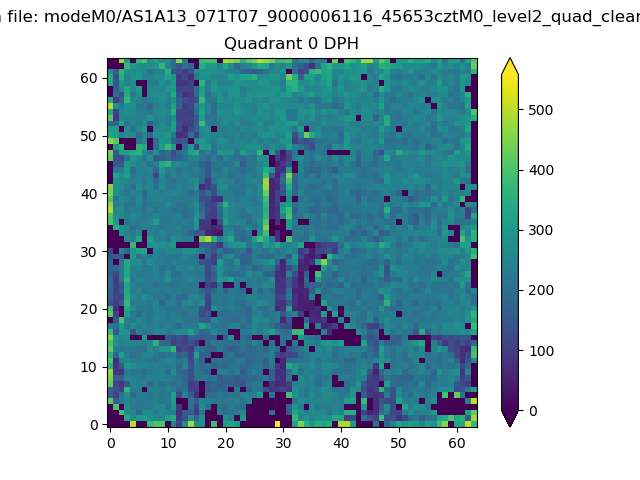 |
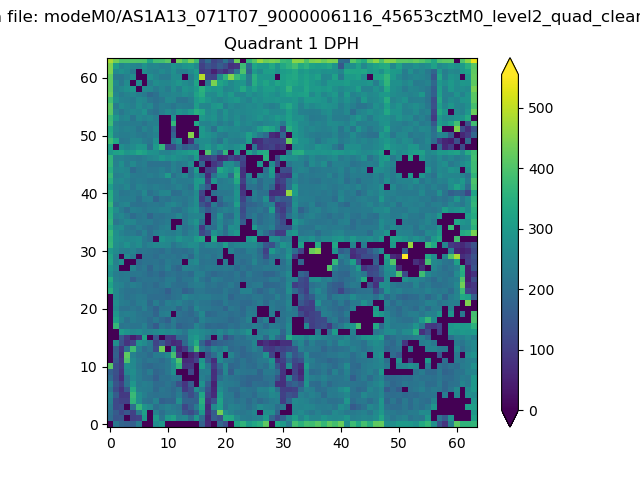 |
Quadrant B |
|---|---|---|---|
| Quadrant D | 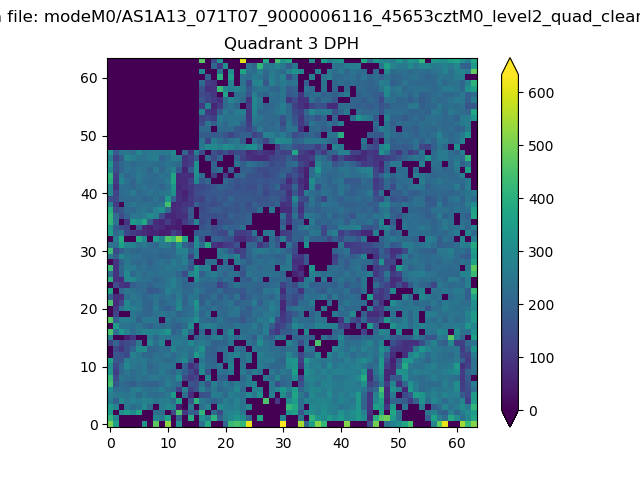 |
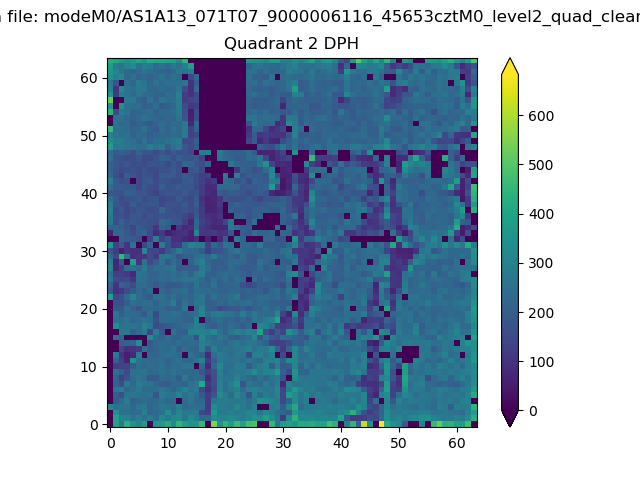 |
Quadrant C |
| Plot type | Count rate plots | Images |
|---|---|---|
| Comparison with Poisson distribution Blue bars denote a histogram of data divided into 1 sec bins. Red curve is a Poisson curve with rate = median count rate of data. |
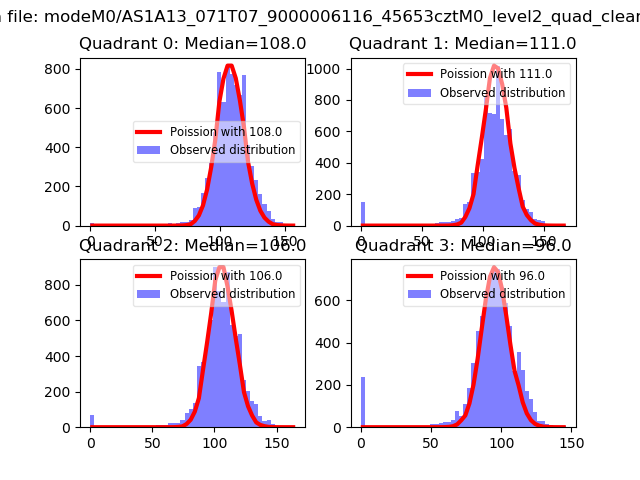 |
 |
| Quadrant-wise count rates Data is divided into 100 sec bins |
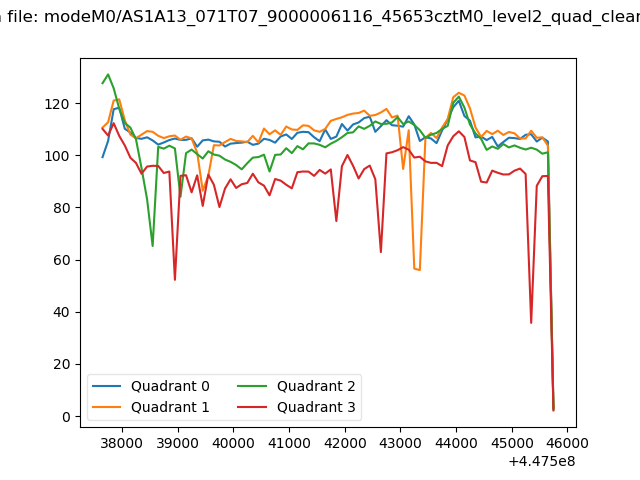 |
|
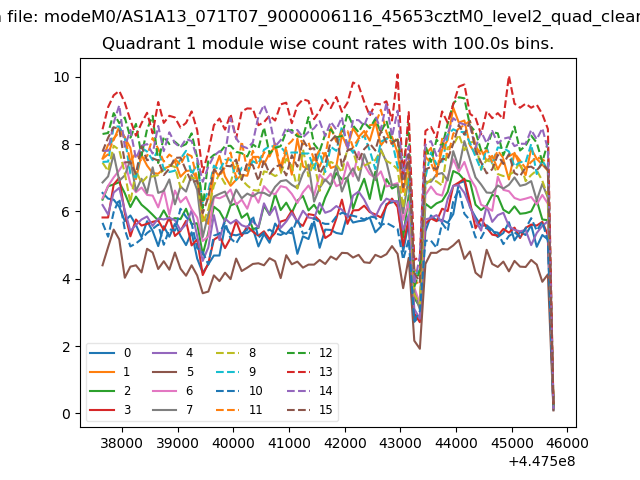
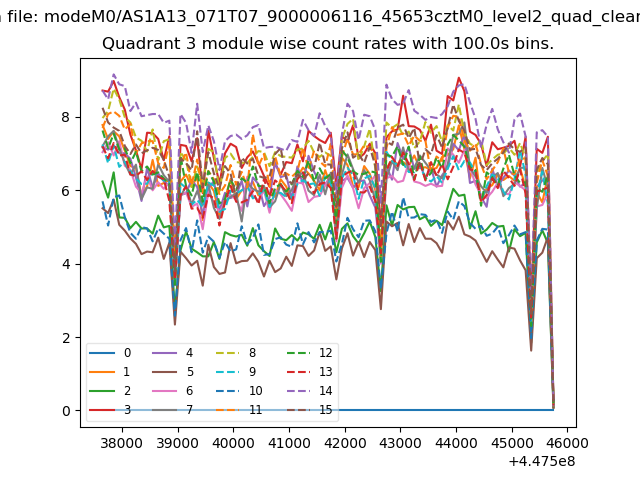
| Module-wise count rates for Quadrant A Data is divided into 100 sec bins |
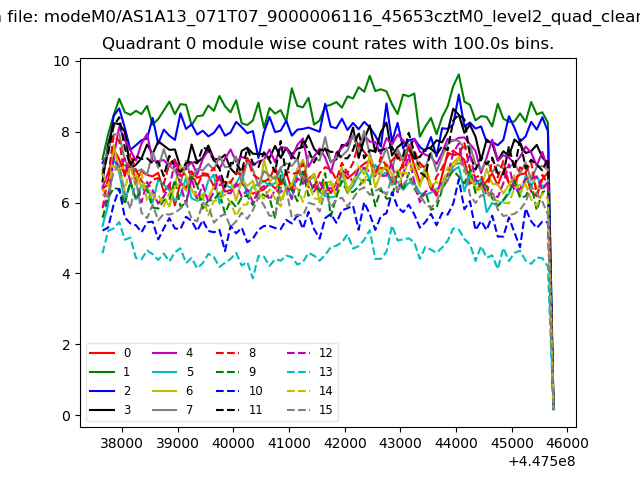 |
 |
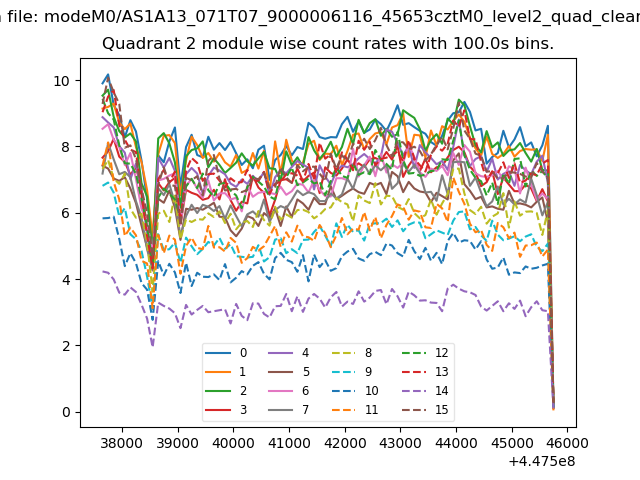
| Module-wise count rates for Quadrant B Data is divided into 100 sec bins |
 |
 |
| Module-wise count rates for Quadrant C Data is divided into 100 sec bins |
 |
 |
| Module-wise count rates for Quadrant D Data is divided into 100 sec bins |
 |
 |
| Parameter | Plot |
|---|---|
| CZT HV Monitor | 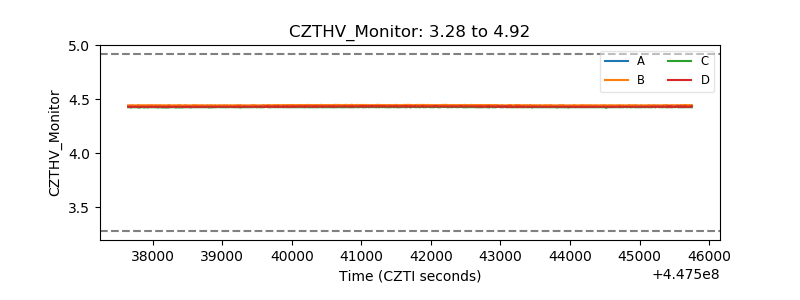 |
| D_VDD | 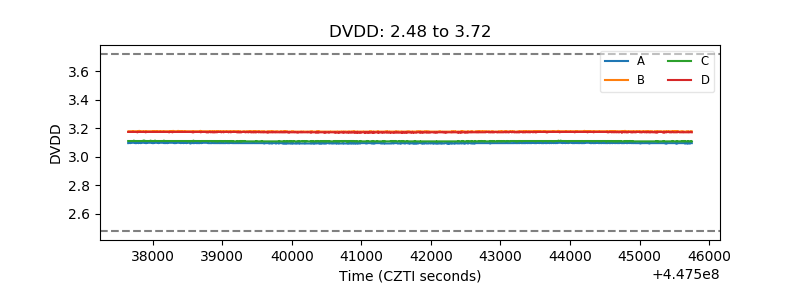 |
| Temperature 1 | 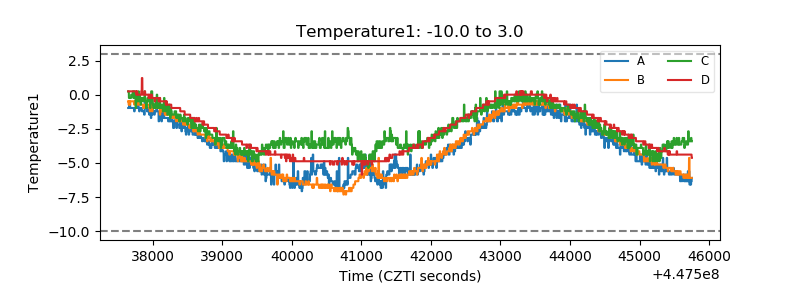 |
| Veto HV Monitor | 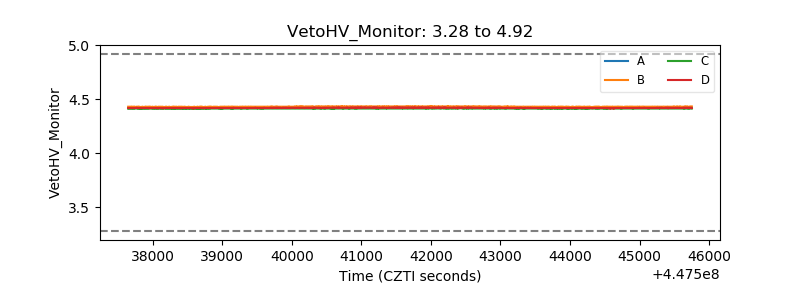 |
| Veto LLD | 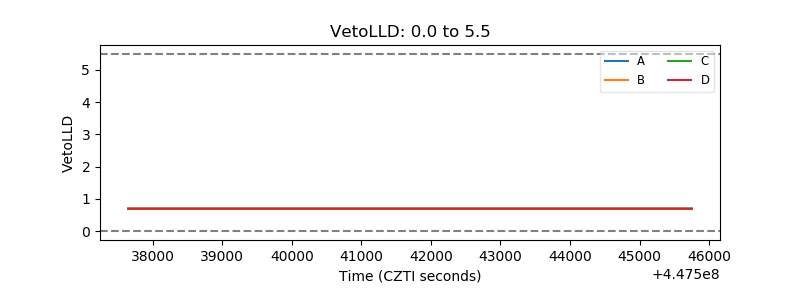 |
| Alpha Counter | 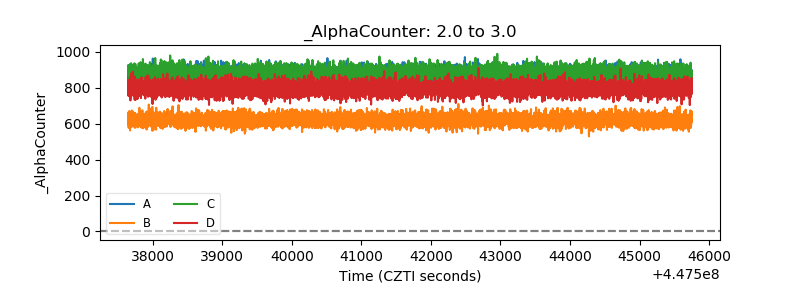 |
| _CPM_Rate | 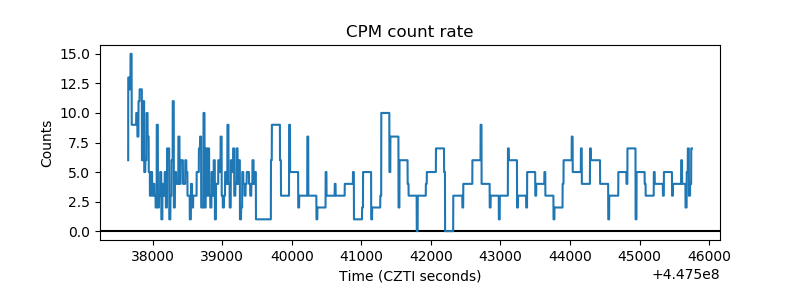 |
| CZT Counter | 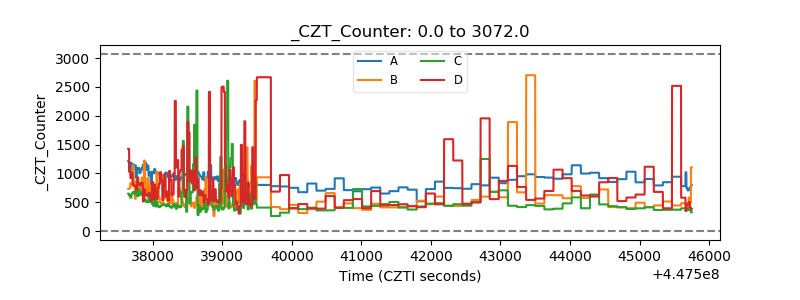 |
| +2.5 Volts monitor | 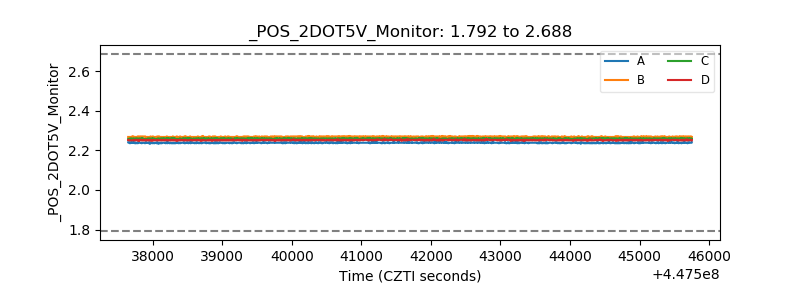 |
| +5 Volts monitor | 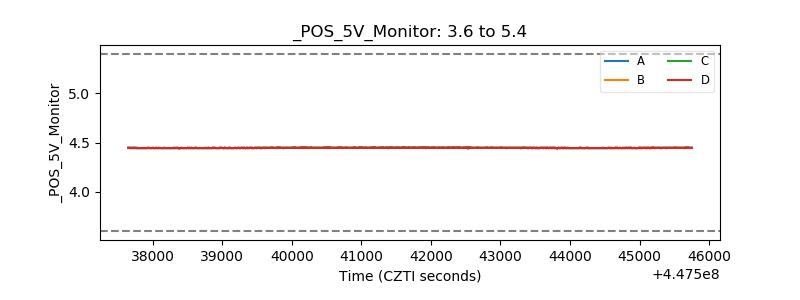 |
| _ROLL_ROT | 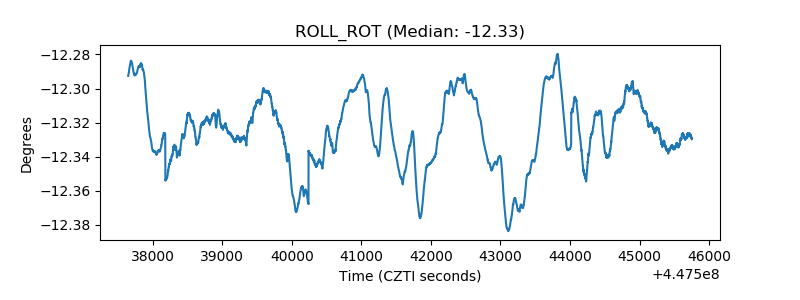 |
| _Roll_DEC | 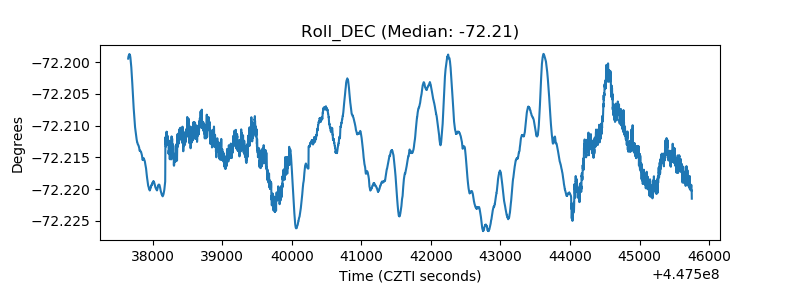 |
| _Roll_RA | 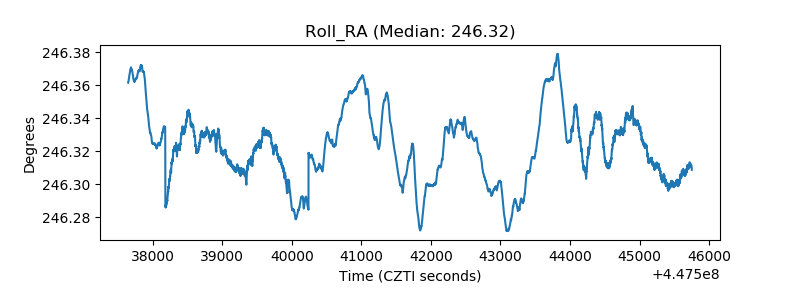 |
| Veto Counter | 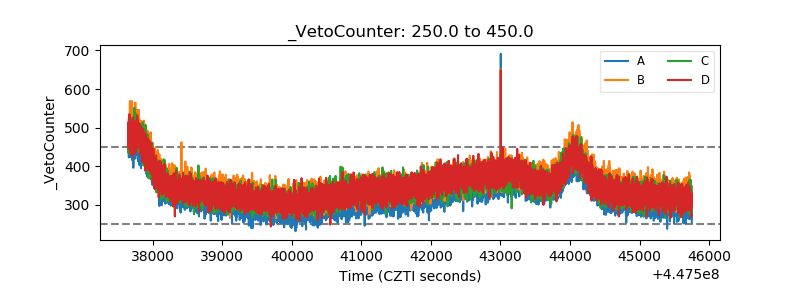 |