| Param | Original file | Final file |
|---|---|---|
| Filename | modeM0/AS1A13_071T07_9000006116_45654cztM0_level2.fits | modeM0/AS1A13_071T07_9000006116_45654cztM0_level2_quad_clean.evt |
| Size (bytes) | 583,018,560 | 128,203,200 |
| Size | 556.0 MB | 122.3 MB |
| Events in quadrant A | 6,767,737 | 861,976 |
| Events in quadrant B | 4,171,931 | 884,879 |
| Events in quadrant C | 3,462,412 | 843,443 |
| Events in quadrant D | 6,556,056 | 732,472 |
| Mode M9 | |||
|---|---|---|---|
| Quadrant | BADHDUFLAG | Total packets | Discarded packets |
| A | 0 | 1 | 0 |
| B | 0 | 1 | 0 |
| C | 0 | 1 | 0 |
| D | 0 | 1 | 0 |
| Mode M0 | |||
|---|---|---|---|
| Quadrant | BADHDUFLAG | Total packets | Discarded packets |
| A | 0 | 25633 | 1 |
| B | 0 | 17929 | 1 |
| C | 0 | 16410 | 2 |
| D | 0 | 24945 | 1 |
| Mode SS | |||
|---|---|---|---|
| Quadrant | BADHDUFLAG | Total packets | Discarded packets |
| A | 0 | 162 | 0 |
| B | 0 | 162 | 0 |
| C | 0 | 162 | 0 |
| D | 0 | 162 | 0 |
| Quadrant | Total seconds | Saturated seconds | Saturation percentage |
|---|---|---|---|
| A | 8042 | 115 | 1.429993% |
| B | 8043 | 81 | 1.007087% |
| C | 8042 | 21 | 0.261129% |
| D | 8042 | 568 | 7.062920% |
Noise dominated data is calculated using 1-second bins in cleaned event files. If a bin has >2000 counts, and if more than 50% of those come from <1% of pixels, then it is considered to be noise-dominated and hence unusable.
| Quadrant | # 1 sec bins | Bins with >0 counts | Bins with >2000 counts | High rate bins dominated by noise | Noise dominated (total time) | Noise dominated (detector-on time) | Marked lightcurve |
|---|---|---|---|---|---|---|---|
| A | 8072 | 8043 | 4 | 4 | 0.05% | 0.05% | 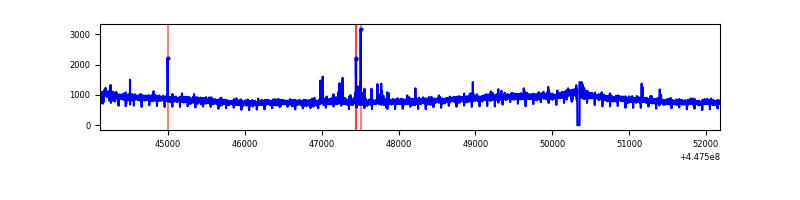 |
| B | 8073 | 8044 | 24 | 24 | 0.30% | 0.30% | 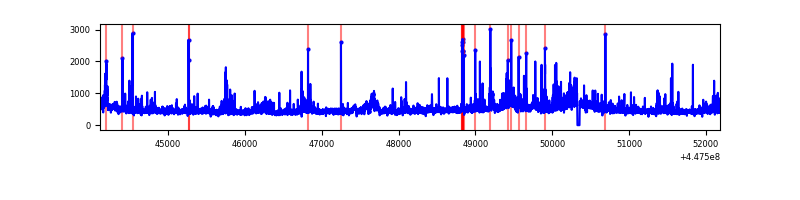 |
| C | 8072 | 8043 | 11 | 11 | 0.14% | 0.14% | 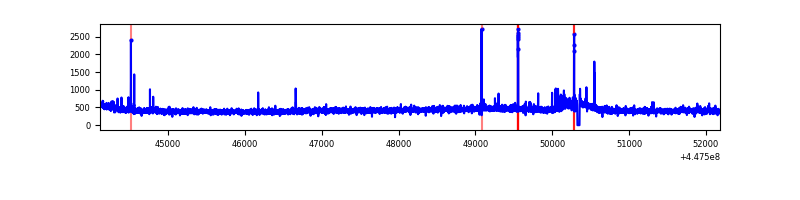 |
| D | 8072 | 8043 | 479 | 479 | 5.93% | 5.96% | 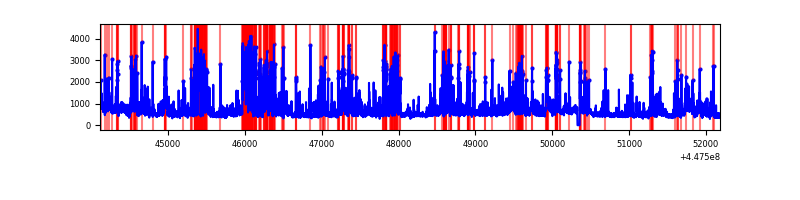 |
Top three noisy pixels from each quadrant. If the there are fewer than three noisy pixels in the level2.evt file, extra rows are filled as -1
| Pixel properties | Quadrant properties | ||||||
|---|---|---|---|---|---|---|---|
| Quadrant | DetID | PixID | Counts | Sigma | Mean | Median | Sigma |
| A | 10 | 83 | 3247290 | 17623.46 | 882 | 862 | 184.2 |
| A | 14 | 235 | 53792 | 287.33 | 882 | 862 | 184.2 |
| A | 0 | 243 | 17342 | 89.46 | 882 | 862 | 184.2 |
| B | 4 | 171 | 124991 | 713.97 | 886 | 859 | 173.9 |
| B | 0 | 183 | 99045 | 564.74 | 886 | 859 | 173.9 |
| B | 0 | 190 | 80197 | 456.33 | 886 | 859 | 173.9 |
| C | 14 | 254 | 40484 | 195.12 | 863 | 867 | 203.0 |
| C | 3 | 233 | 20853 | 98.44 | 863 | 867 | 203.0 |
| C | 12 | 2 | 18342 | 86.07 | 863 | 867 | 203.0 |
| D | 1 | 52 | 1158613 | 5431.37 | 837 | 808 | 213.2 |
| D | 13 | 249 | 881582 | 4131.79 | 837 | 808 | 213.2 |
| D | 11 | 224 | 506972 | 2374.46 | 837 | 808 | 213.2 |
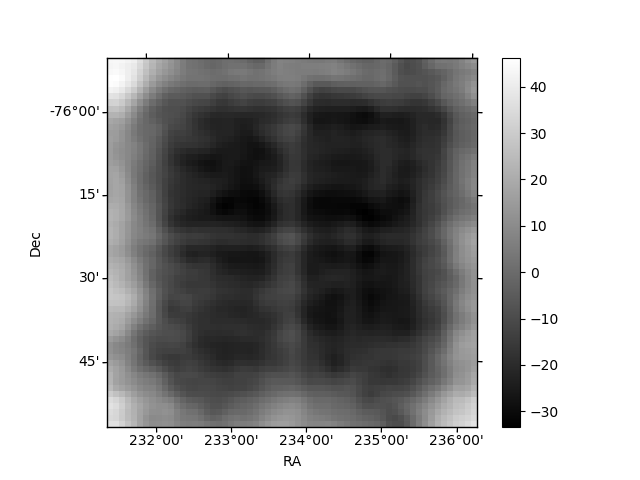
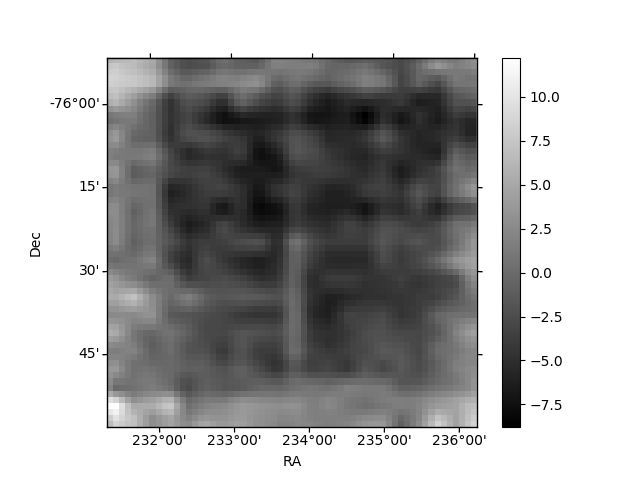
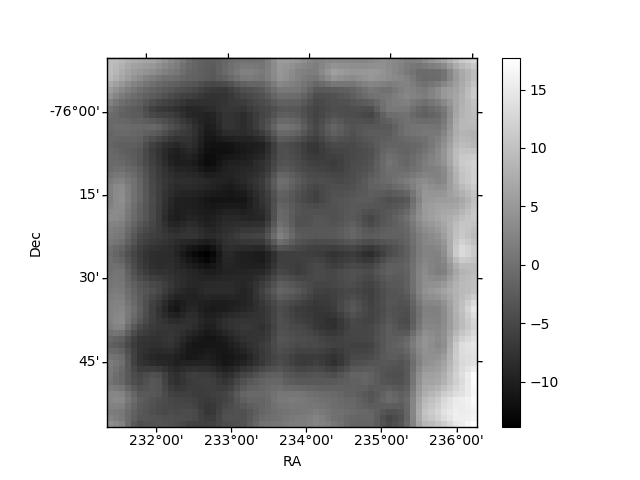
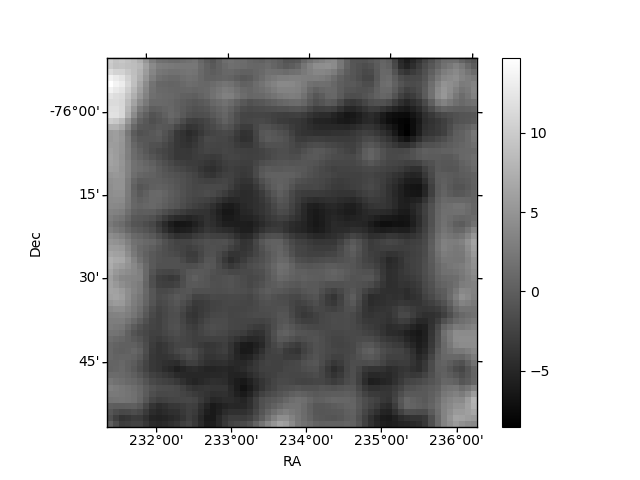
Histogram calculated using DETX and DETY for each event in the final _common_clean file
| Quadrant A | 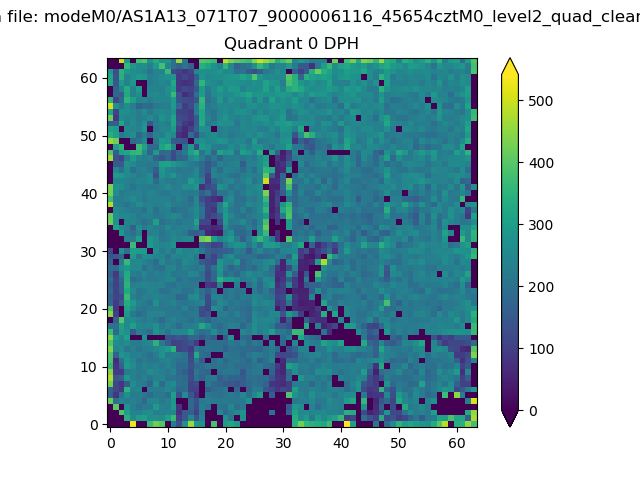 |
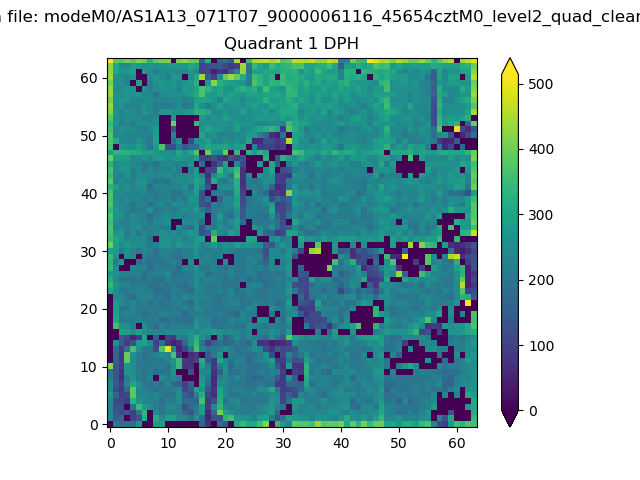 |
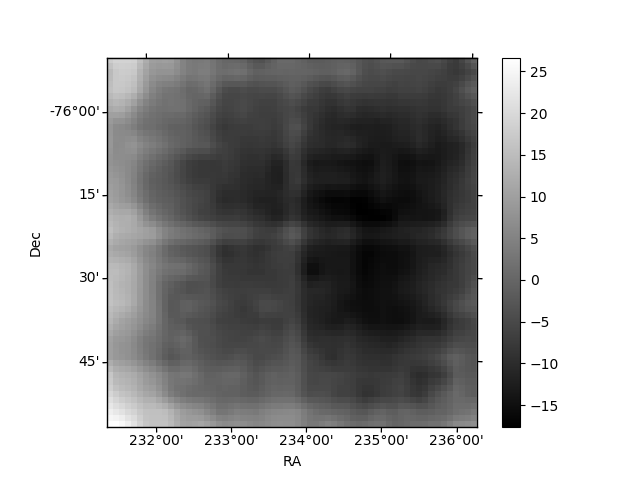
Quadrant B |
|---|---|---|---|
| Quadrant D | 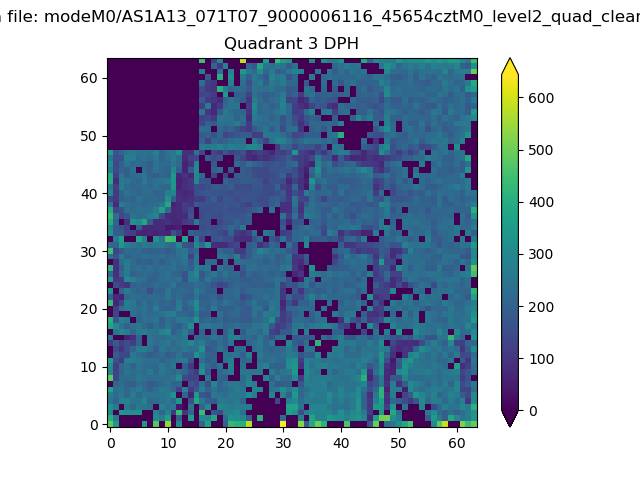 |
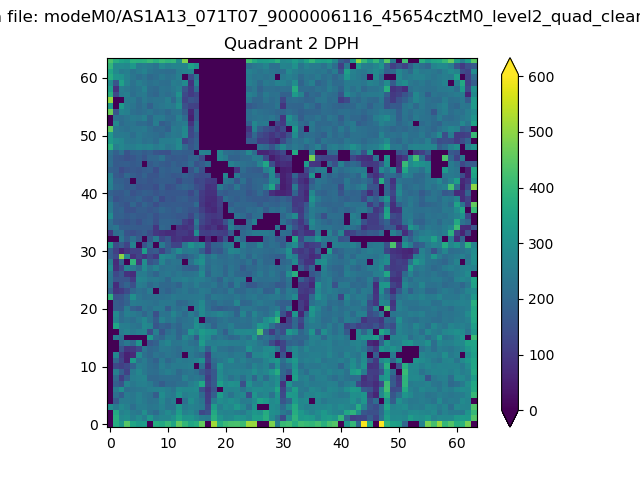 |
Quadrant C |
| Plot type | Count rate plots | Images |
|---|---|---|
| Comparison with Poisson distribution Blue bars denote a histogram of data divided into 1 sec bins. Red curve is a Poisson curve with rate = median count rate of data. |
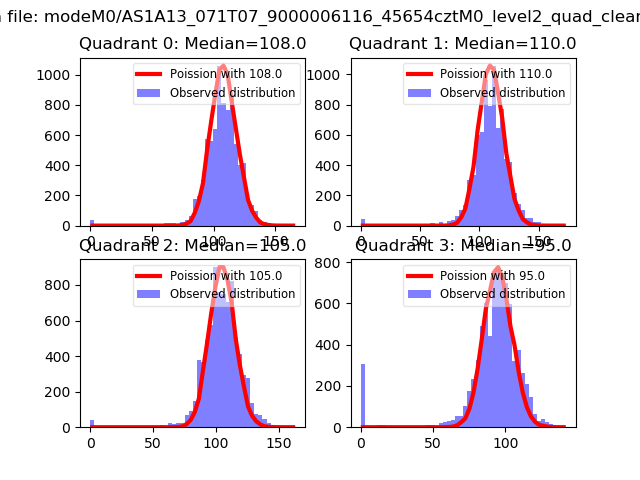 |
 |
| Quadrant-wise count rates Data is divided into 100 sec bins |
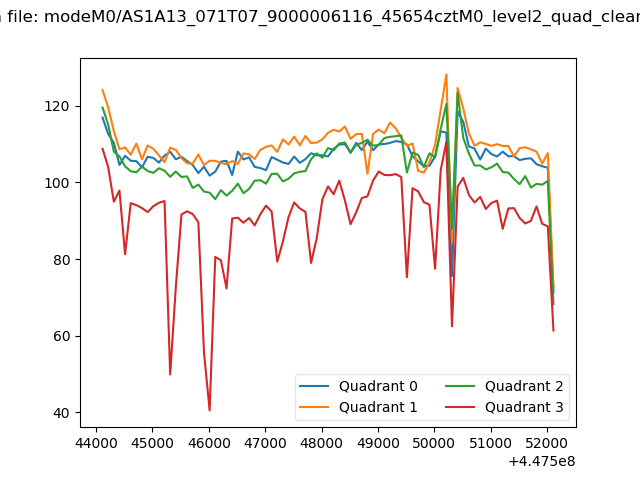 |
|
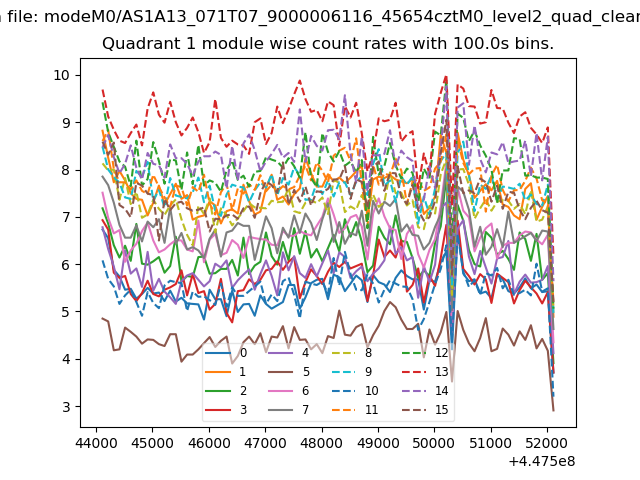
| Module-wise count rates for Quadrant A Data is divided into 100 sec bins |
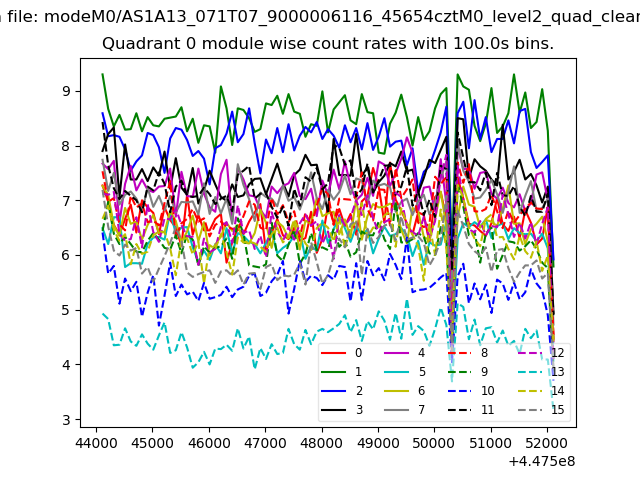 |
 |
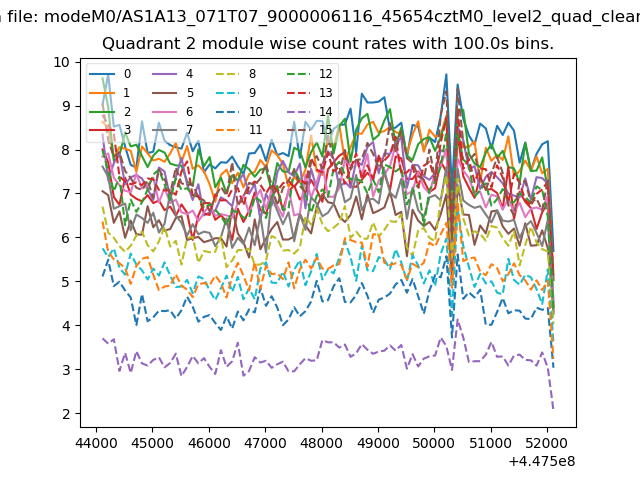
| Module-wise count rates for Quadrant B Data is divided into 100 sec bins |
 |
 |
| Module-wise count rates for Quadrant C Data is divided into 100 sec bins |
 |
 |
| Module-wise count rates for Quadrant D Data is divided into 100 sec bins |
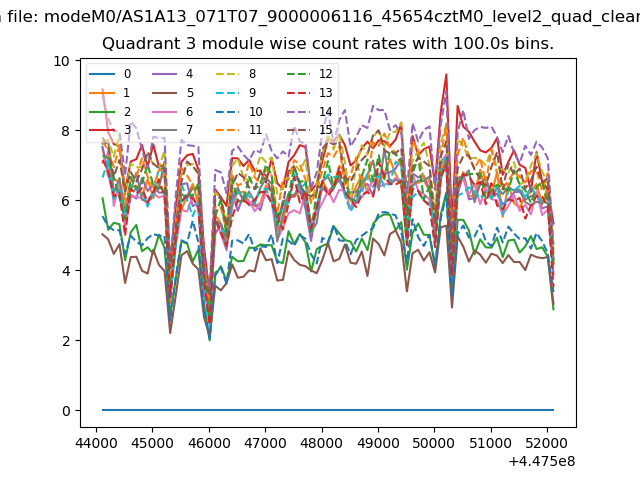 |
 |
| Parameter | Plot |
|---|---|
| CZT HV Monitor | 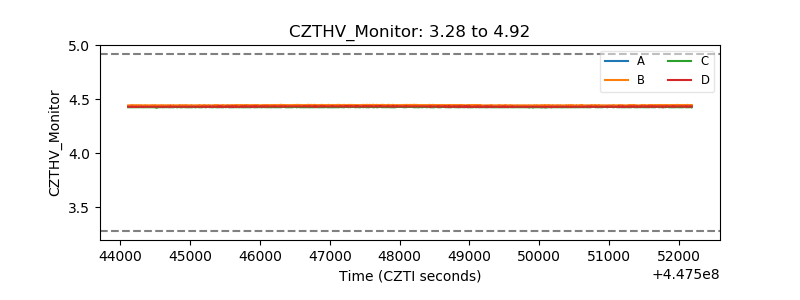 |
| D_VDD | 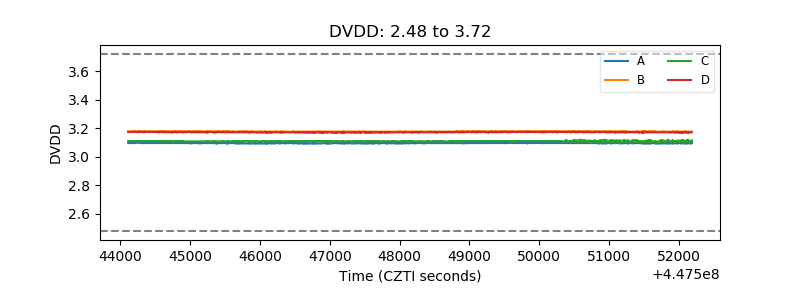 |
| Temperature 1 | 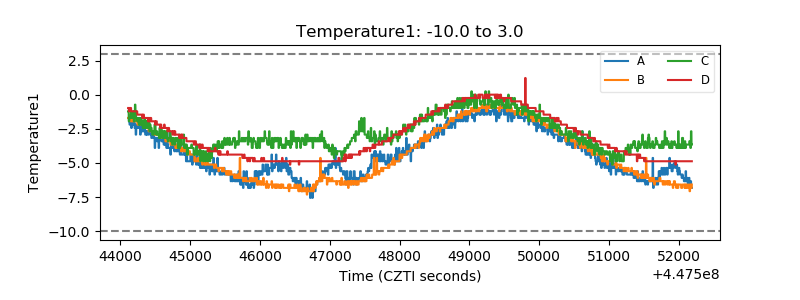 |
| Veto HV Monitor | 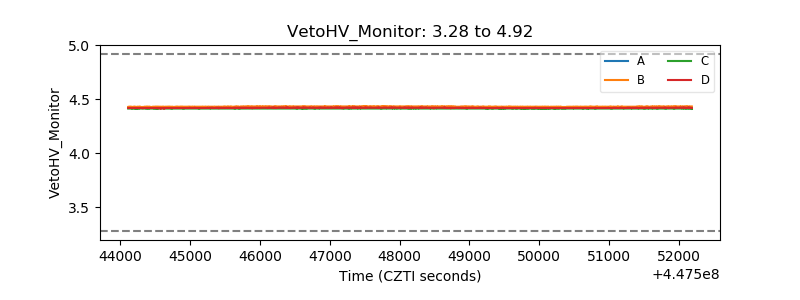 |
| Veto LLD | 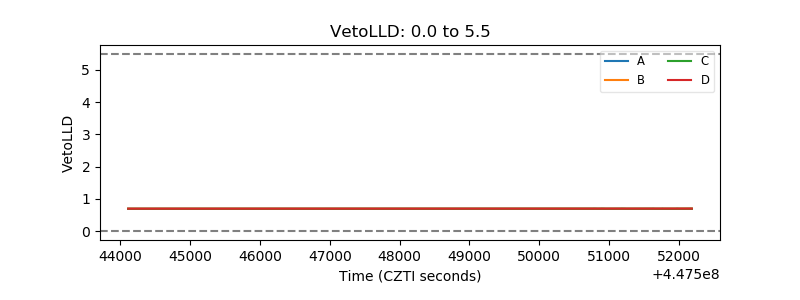 |
| Alpha Counter | 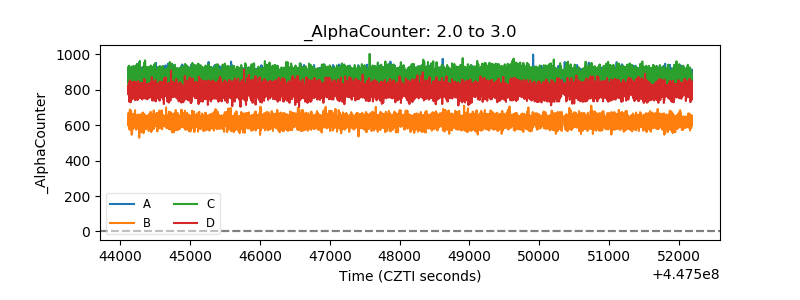 |
| _CPM_Rate | 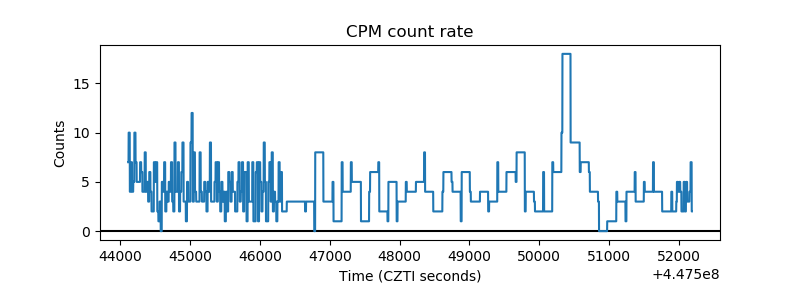 |
| CZT Counter | 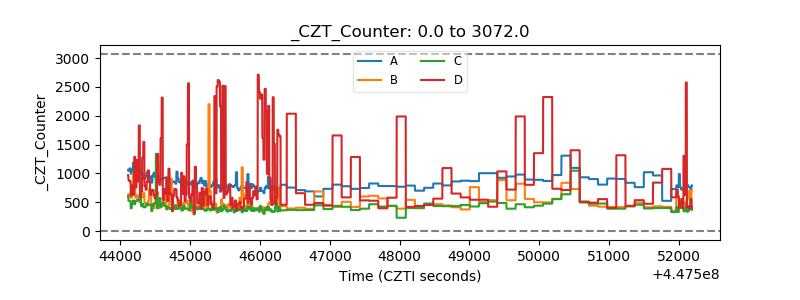 |
| +2.5 Volts monitor | 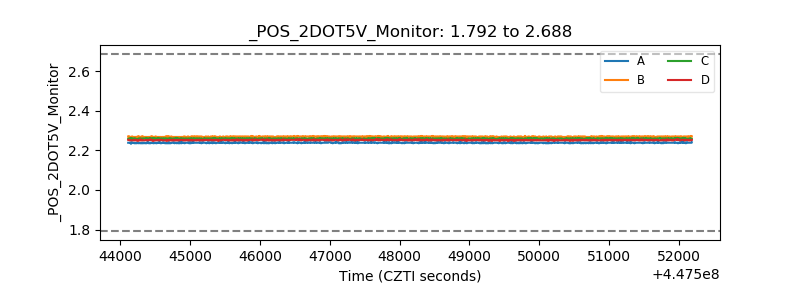 |
| +5 Volts monitor | 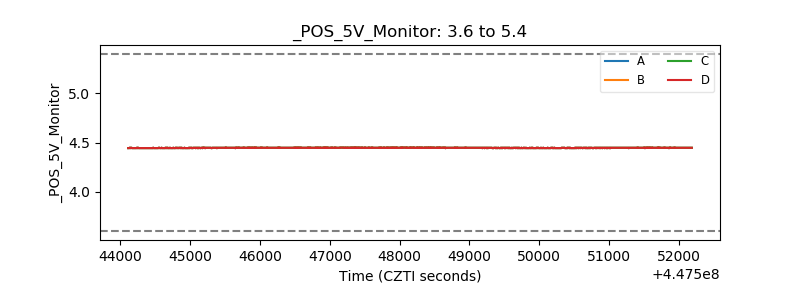 |
| _ROLL_ROT | 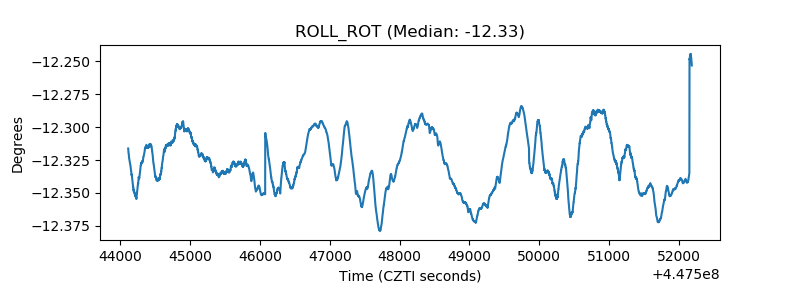 |
| _Roll_DEC | 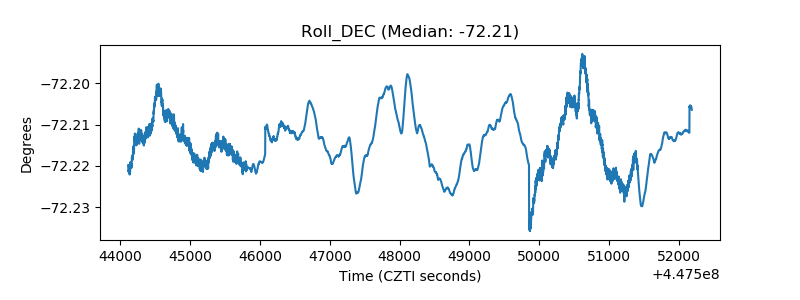 |
| _Roll_RA | 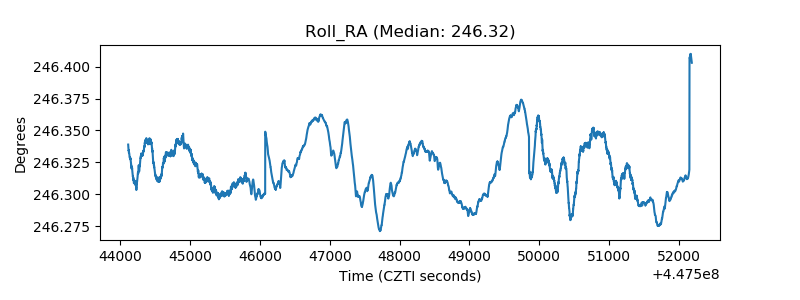 |
| Veto Counter | 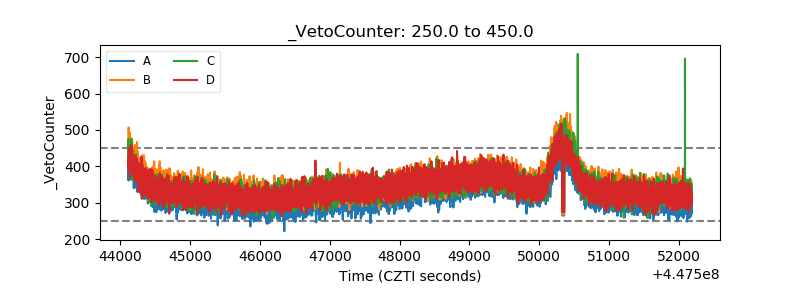 |