| Param | Original file | Final file |
|---|---|---|
| Filename | modeM0/AS1A13_071T07_9000006116_45657cztM0_level2.fits | modeM0/AS1A13_071T07_9000006116_45657cztM0_level2_quad_clean.evt |
| Size (bytes) | 641,652,480 | 151,188,480 |
| Size | 611.9 MB | 144.2 MB |
| Events in quadrant A | 7,893,234 | 1,001,831 |
| Events in quadrant B | 4,829,084 | 1,038,219 |
| Events in quadrant C | 4,154,675 | 989,372 |
| Events in quadrant D | 6,137,739 | 888,511 |
| Mode M9 | |||
|---|---|---|---|
| Quadrant | BADHDUFLAG | Total packets | Discarded packets |
| A | 0 | 4 | 0 |
| B | 0 | 4 | 0 |
| C | 0 | 4 | 0 |
| D | 0 | 4 | 0 |
| Mode M0 | |||
|---|---|---|---|
| Quadrant | BADHDUFLAG | Total packets | Discarded packets |
| A | 0 | 30327 | 2 |
| B | 0 | 21027 | 2 |
| C | 0 | 19589 | 2 |
| D | 0 | 24923 | 3 |
| Mode SS | |||
|---|---|---|---|
| Quadrant | BADHDUFLAG | Total packets | Discarded packets |
| A | 0 | 194 | 0 |
| B | 0 | 194 | 0 |
| C | 0 | 194 | 0 |
| D | 0 | 194 | 0 |
| Quadrant | Total seconds | Saturated seconds | Saturation percentage |
|---|---|---|---|
| A | 9511 | 189 | 1.987173% |
| B | 9512 | 129 | 1.356182% |
| C | 9512 | 38 | 0.399495% |
| D | 9511 | 216 | 2.271055% |
Noise dominated data is calculated using 1-second bins in cleaned event files. If a bin has >2000 counts, and if more than 50% of those come from <1% of pixels, then it is considered to be noise-dominated and hence unusable.
| Quadrant | # 1 sec bins | Bins with >0 counts | Bins with >2000 counts | High rate bins dominated by noise | Noise dominated (total time) | Noise dominated (detector-on time) | Marked lightcurve |
|---|---|---|---|---|---|---|---|
| A | 9906 | 9513 | 15 | 15 | 0.15% | 0.16% | 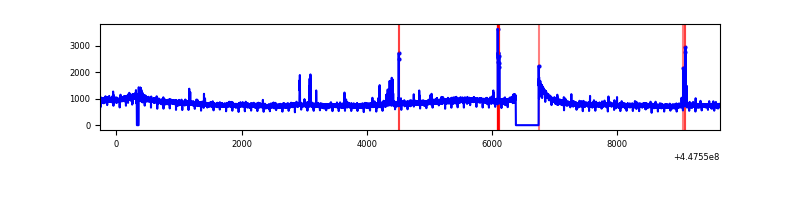 |
| B | 9907 | 9514 | 34 | 34 | 0.34% | 0.36% | 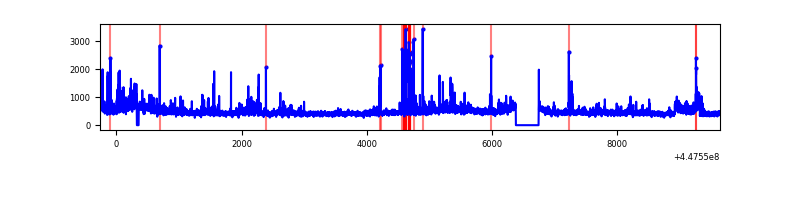 |
| C | 9907 | 9514 | 15 | 15 | 0.15% | 0.16% | 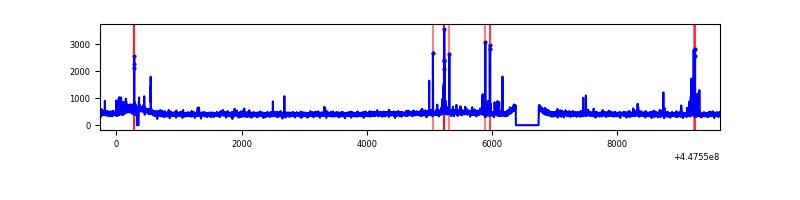 |
| D | 9906 | 9513 | 140 | 140 | 1.41% | 1.47% | 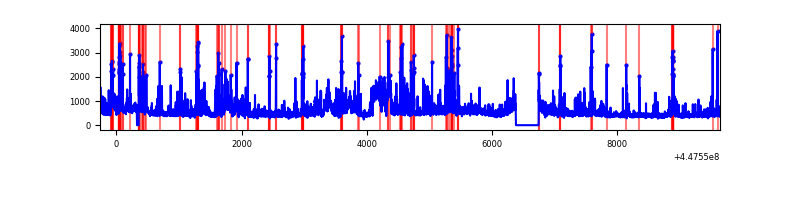 |
Top three noisy pixels from each quadrant. If the there are fewer than three noisy pixels in the level2.evt file, extra rows are filled as -1
| Pixel properties | Quadrant properties | ||||||
|---|---|---|---|---|---|---|---|
| Quadrant | DetID | PixID | Counts | Sigma | Mean | Median | Sigma |
| A | 10 | 83 | 3735191 | 17359.17 | 1035 | 1014 | 215.1 |
| A | 13 | 248 | 49211 | 224.05 | 1035 | 1014 | 215.1 |
| A | 14 | 235 | 48114 | 218.96 | 1035 | 1014 | 215.1 |
| B | 0 | 190 | 191575 | 933.19 | 1040 | 1008 | 204.2 |
| B | 5 | 172 | 122486 | 594.87 | 1040 | 1008 | 204.2 |
| B | 4 | 171 | 111071 | 538.97 | 1040 | 1008 | 204.2 |
| C | 14 | 254 | 108830 | 446.48 | 1023 | 1026 | 241.5 |
| C | 2 | 14 | 27286 | 108.76 | 1023 | 1026 | 241.5 |
| C | 3 | 233 | 24977 | 99.2 | 1023 | 1026 | 241.5 |
| D | 1 | 52 | 1392394 | 5507.67 | 1008 | 974 | 252.6 |
| D | 13 | 249 | 281953 | 1112.2 | 1008 | 974 | 252.6 |
| D | 13 | 171 | 115361 | 452.78 | 1008 | 974 | 252.6 |
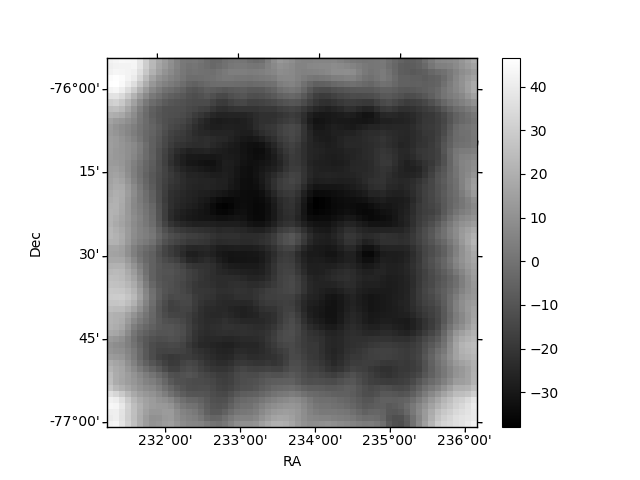
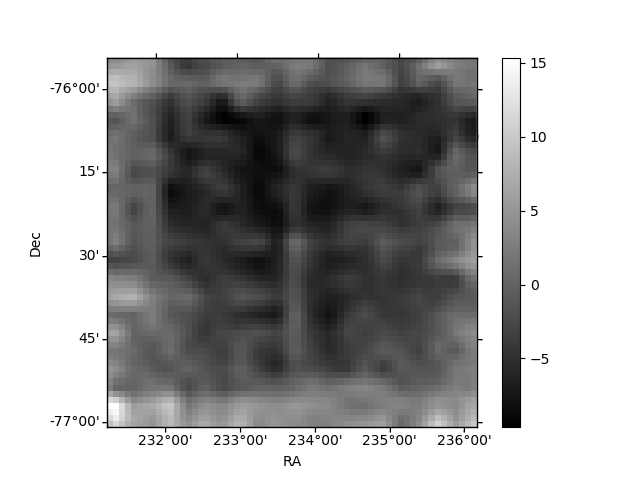
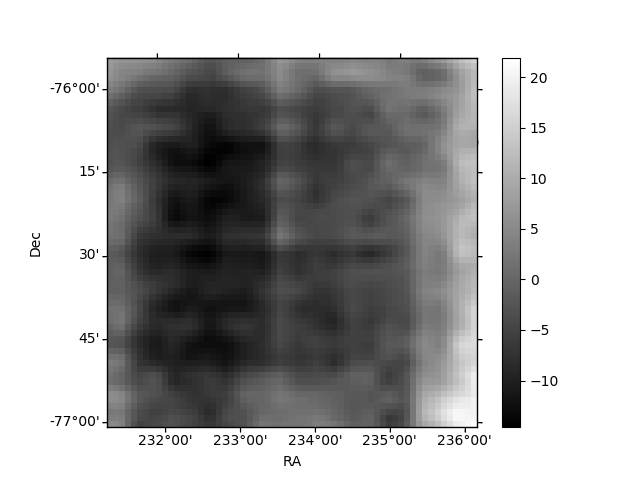
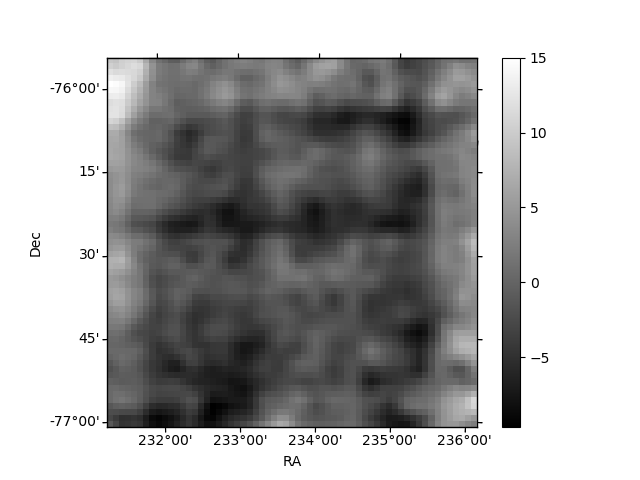
Histogram calculated using DETX and DETY for each event in the final _common_clean file
| Quadrant A | 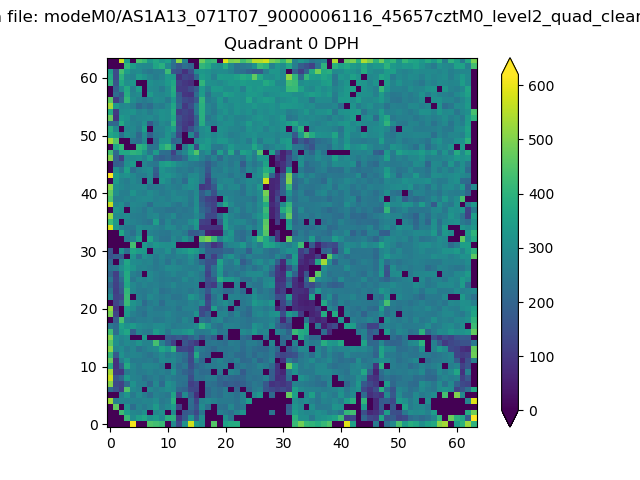 |
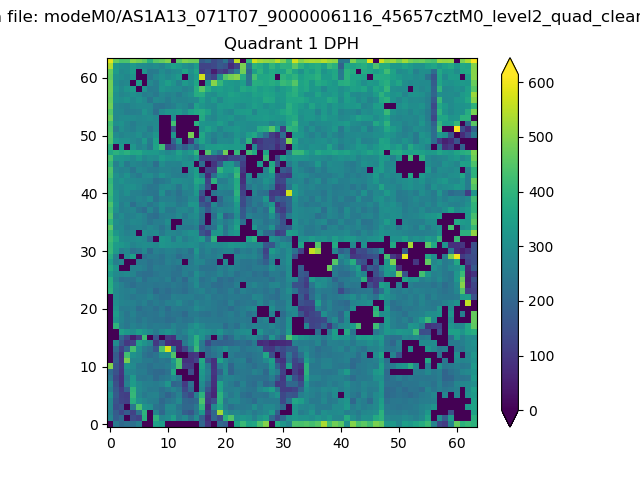 |
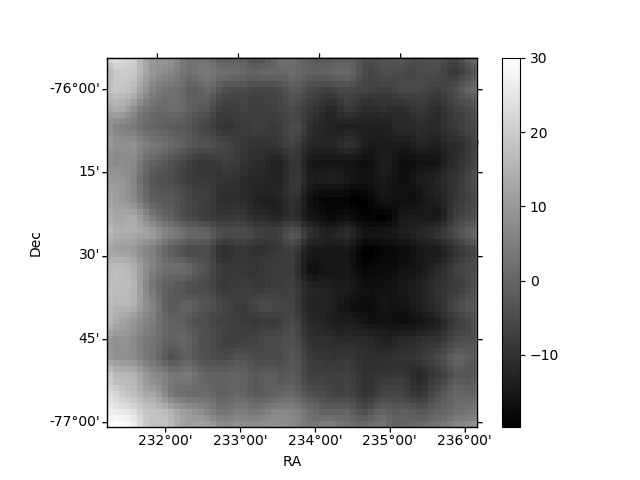
Quadrant B |
|---|---|---|---|
| Quadrant D | 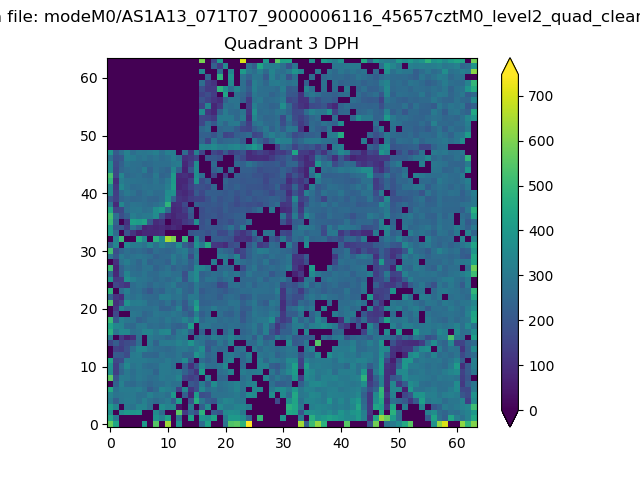 |
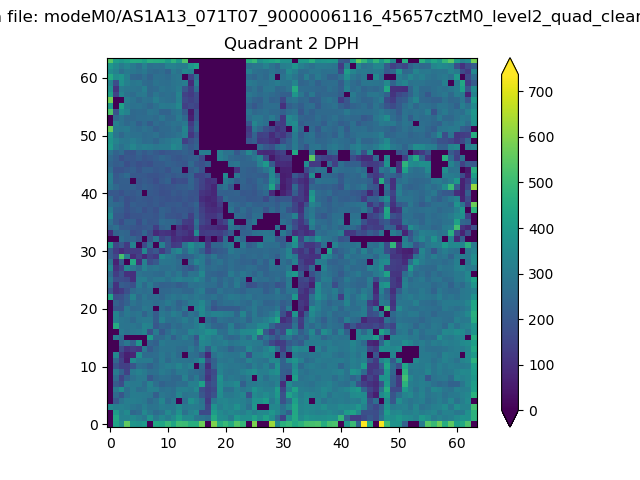 |
Quadrant C |
| Plot type | Count rate plots | Images |
|---|---|---|
| Comparison with Poisson distribution Blue bars denote a histogram of data divided into 1 sec bins. Red curve is a Poisson curve with rate = median count rate of data. |
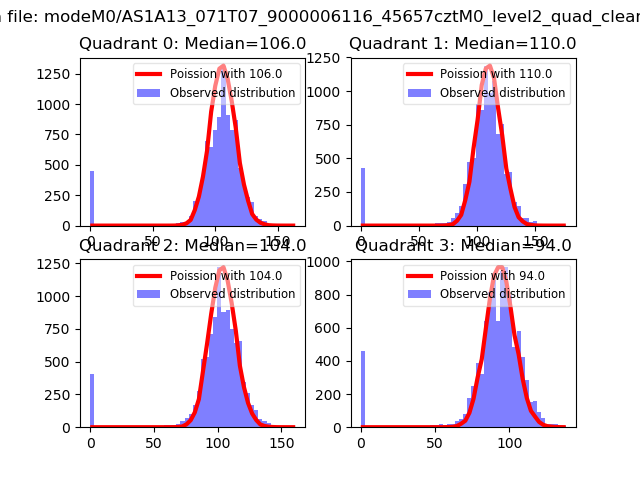 |
 |
| Quadrant-wise count rates Data is divided into 100 sec bins |
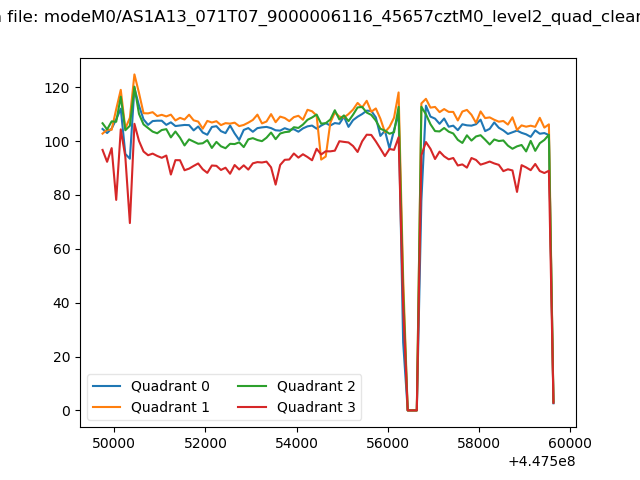 |
|
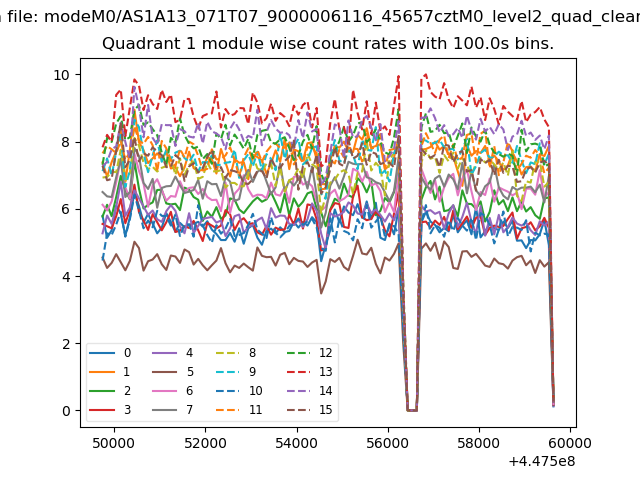
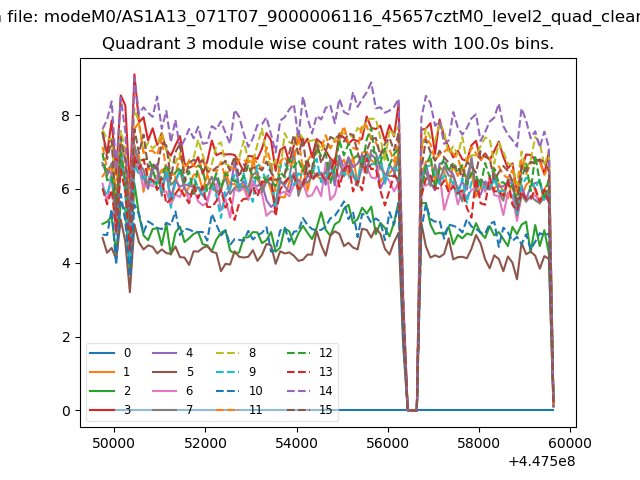
| Module-wise count rates for Quadrant A Data is divided into 100 sec bins |
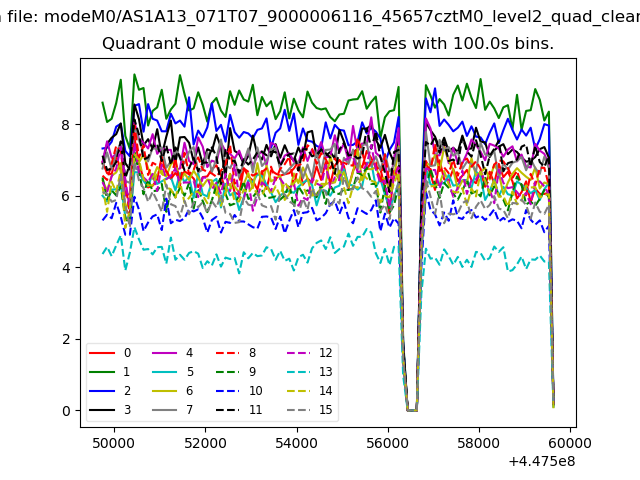 |
 |
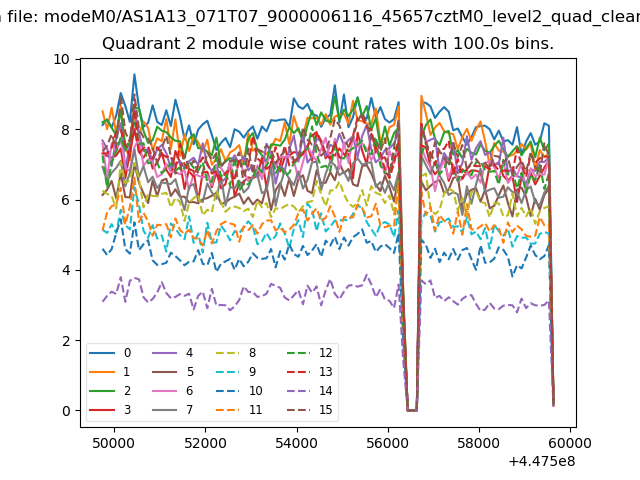
| Module-wise count rates for Quadrant B Data is divided into 100 sec bins |
 |
 |
| Module-wise count rates for Quadrant C Data is divided into 100 sec bins |
 |
 |
| Module-wise count rates for Quadrant D Data is divided into 100 sec bins |
 |
 |
| Parameter | Plot |
|---|---|
| CZT HV Monitor | 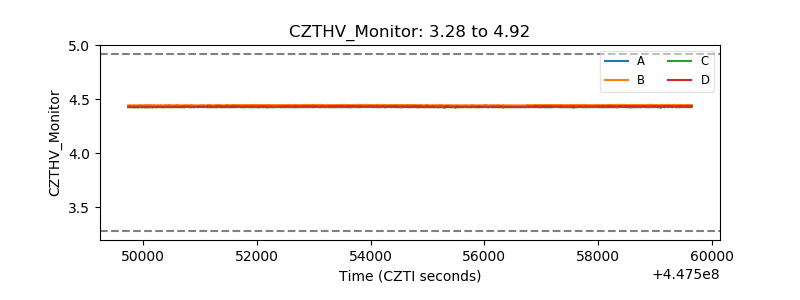 |
| D_VDD | 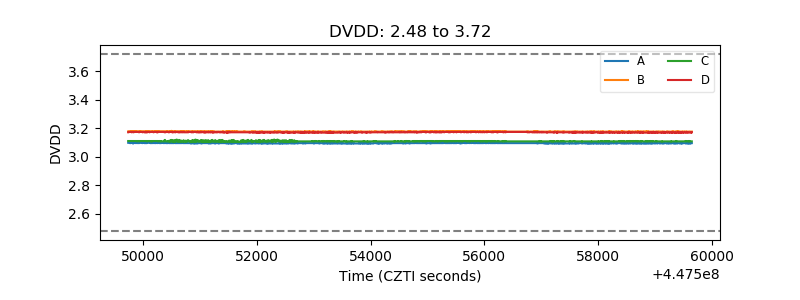 |
| Temperature 1 | 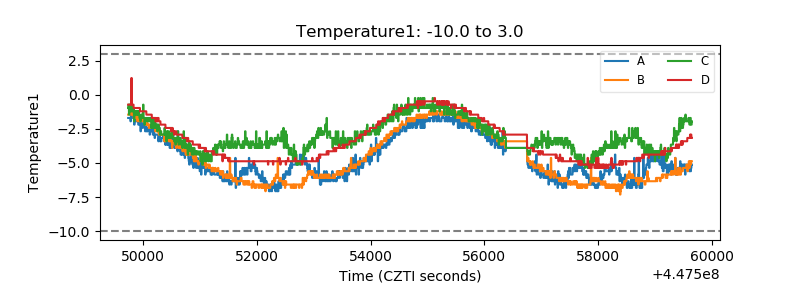 |
| Veto HV Monitor | 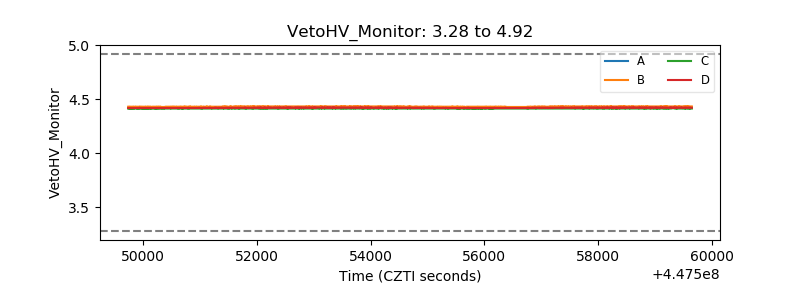 |
| Veto LLD | 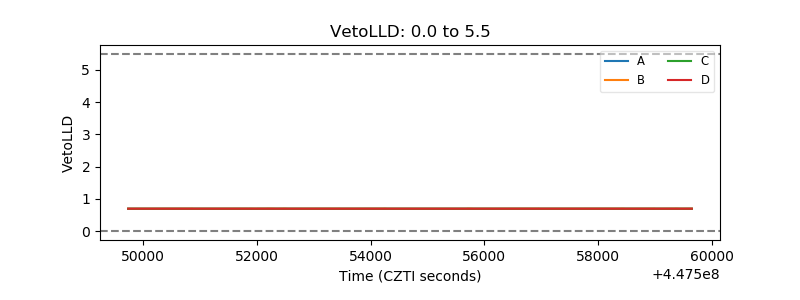 |
| Alpha Counter | 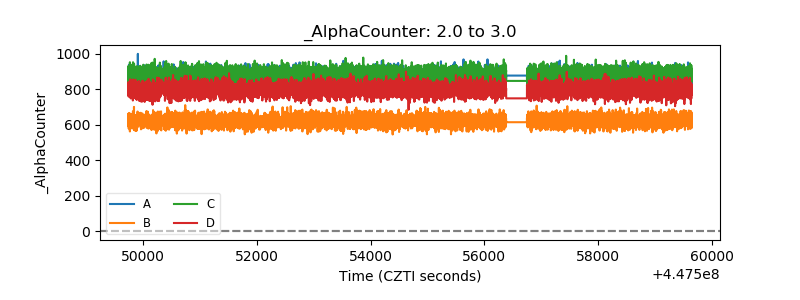 |
| _CPM_Rate | 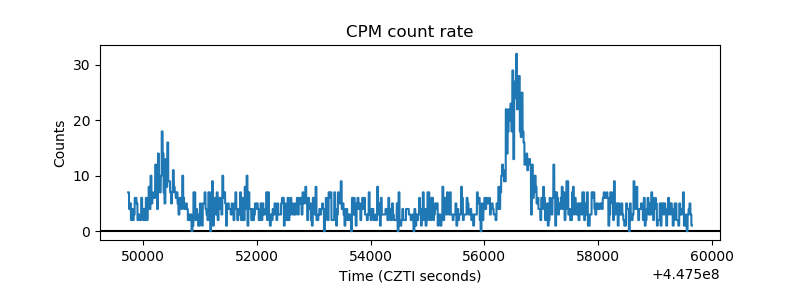 |
| CZT Counter | 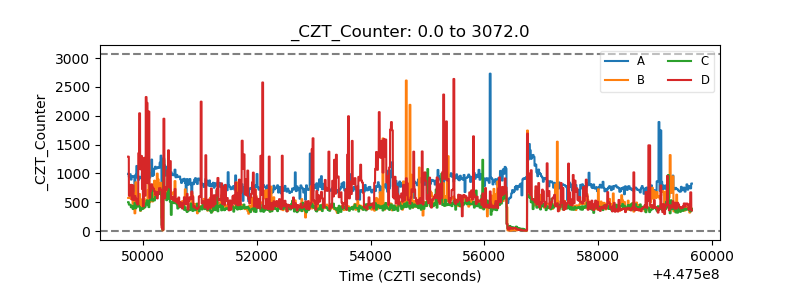 |
| +2.5 Volts monitor | 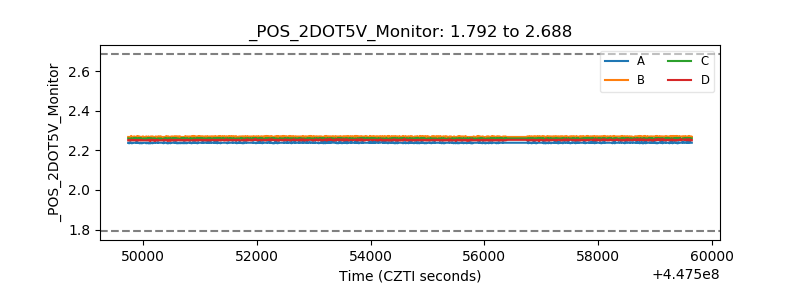 |
| +5 Volts monitor | 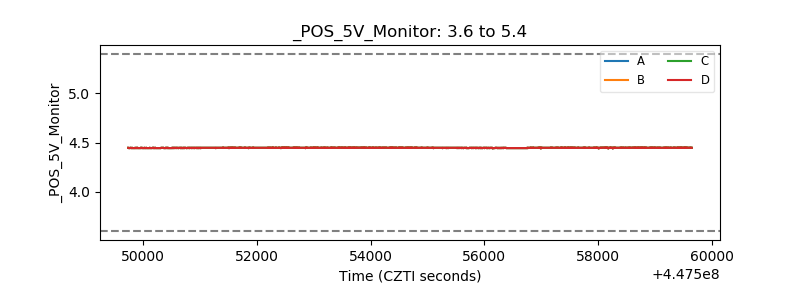 |
| _ROLL_ROT | 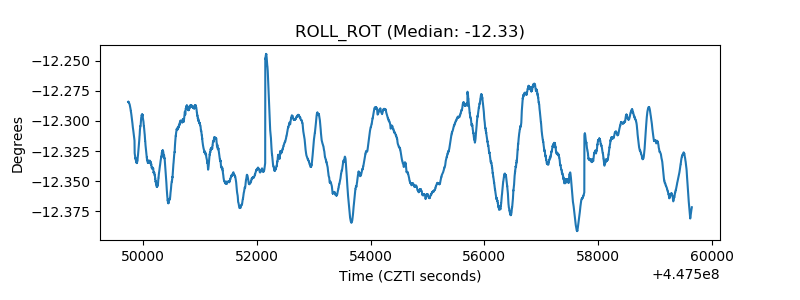 |
| _Roll_DEC | 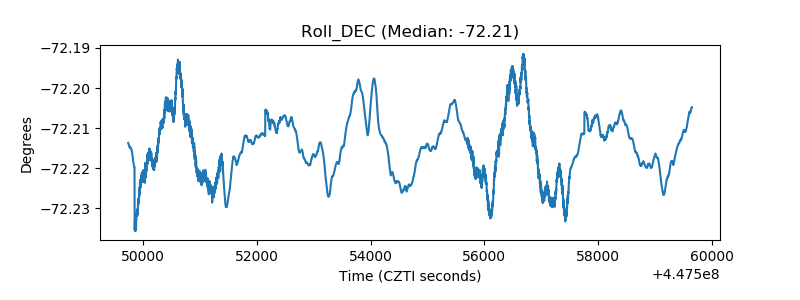 |
| _Roll_RA | 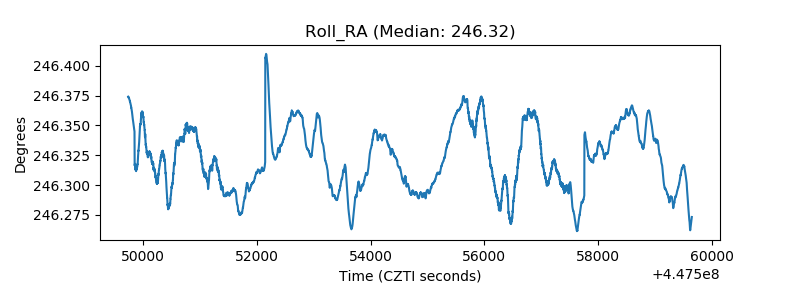 |
| Veto Counter | 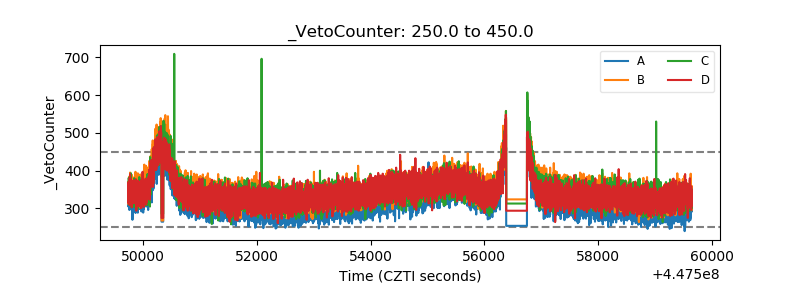 |