| Param | Original file | Final file |
|---|---|---|
| Filename | modeM0/AS1A13_071T07_9000006116_45658cztM0_level2.fits | modeM0/AS1A13_071T07_9000006116_45658cztM0_level2_quad_clean.evt |
| Size (bytes) | 1,022,976,000 | 227,707,200 |
| Size | 975.6 MB | 217.2 MB |
| Events in quadrant A | 12,303,592 | 1,513,942 |
| Events in quadrant B | 7,138,344 | 1,562,622 |
| Events in quadrant C | 6,782,924 | 1,507,583 |
| Events in quadrant D | 10,523,709 | 1,311,313 |
| Mode M9 | |||
|---|---|---|---|
| Quadrant | BADHDUFLAG | Total packets | Discarded packets |
| A | 0 | 24 | 0 |
| B | 0 | 24 | 0 |
| C | 0 | 24 | 0 |
| D | 0 | 24 | 0 |
| Mode M0 | |||
|---|---|---|---|
| Quadrant | BADHDUFLAG | Total packets | Discarded packets |
| A | 0 | 45979 | 3 |
| B | 0 | 31086 | 3 |
| C | 0 | 30551 | 3 |
| D | 0 | 41122 | 3 |
| Mode SS | |||
|---|---|---|---|
| Quadrant | BADHDUFLAG | Total packets | Discarded packets |
| A | 0 | 294 | 0 |
| B | 0 | 294 | 0 |
| C | 0 | 294 | 0 |
| D | 0 | 294 | 0 |
| Quadrant | Total seconds | Saturated seconds | Saturation percentage |
|---|---|---|---|
| A | 14467 | 307 | 2.122071% |
| B | 14468 | 180 | 1.244125% |
| C | 14468 | 99 | 0.684269% |
| D | 14468 | 853 | 5.895770% |
Noise dominated data is calculated using 1-second bins in cleaned event files. If a bin has >2000 counts, and if more than 50% of those come from <1% of pixels, then it is considered to be noise-dominated and hence unusable.
| Quadrant | # 1 sec bins | Bins with >0 counts | Bins with >2000 counts | High rate bins dominated by noise | Noise dominated (total time) | Noise dominated (detector-on time) | Marked lightcurve |
|---|---|---|---|---|---|---|---|
| A | 16782 | 14470 | 32 | 32 | 0.19% | 0.22% | 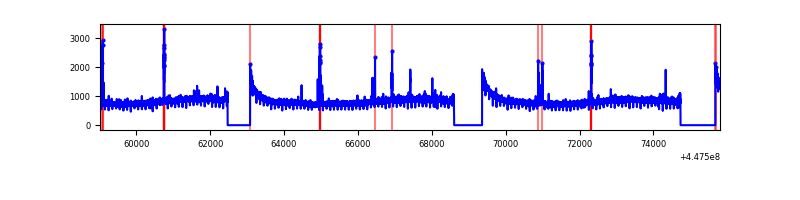 |
| B | 16783 | 14471 | 73 | 73 | 0.43% | 0.50% | 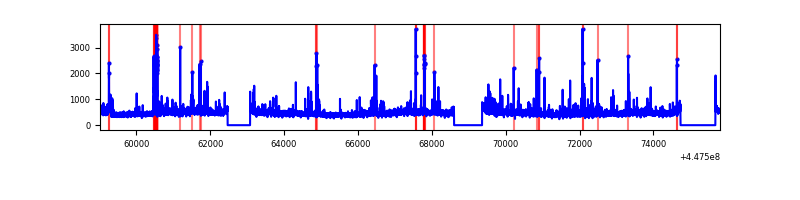 |
| C | 16783 | 14470 | 19 | 19 | 0.11% | 0.13% | 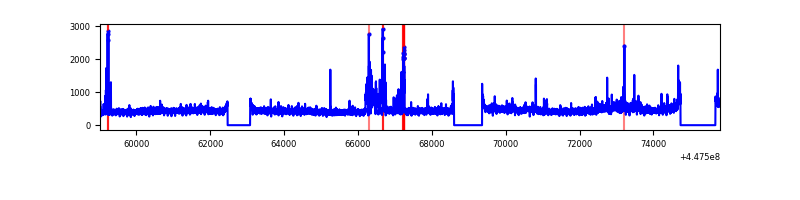 |
| D | 16783 | 14471 | 662 | 662 | 3.94% | 4.57% | 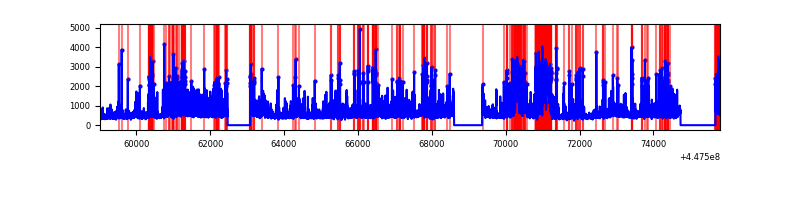 |
Top three noisy pixels from each quadrant. If the there are fewer than three noisy pixels in the level2.evt file, extra rows are filled as -1
| Pixel properties | Quadrant properties | ||||||
|---|---|---|---|---|---|---|---|
| Quadrant | DetID | PixID | Counts | Sigma | Mean | Median | Sigma |
| A | 10 | 83 | 5965909 | 18336.34 | 1580 | 1546 | 325.3 |
| A | 13 | 248 | 97205 | 294.09 | 1580 | 1546 | 325.3 |
| A | 2 | 79 | 70710 | 212.63 | 1580 | 1546 | 325.3 |
| B | 5 | 172 | 212707 | 683.76 | 1577 | 1531 | 308.8 |
| B | 0 | 190 | 203093 | 652.63 | 1577 | 1531 | 308.8 |
| B | 0 | 183 | 156921 | 503.13 | 1577 | 1531 | 308.8 |
| C | 9 | 54 | 584698 | 1598.97 | 1558 | 1567 | 364.7 |
| C | 14 | 254 | 48129 | 127.67 | 1558 | 1567 | 364.7 |
| C | 3 | 233 | 30409 | 79.09 | 1558 | 1567 | 364.7 |
| D | 13 | 249 | 1925389 | 5051.62 | 1526 | 1480 | 380.9 |
| D | 1 | 52 | 1507142 | 3953.42 | 1526 | 1480 | 380.9 |
| D | 8 | 129 | 403788 | 1056.34 | 1526 | 1480 | 380.9 |
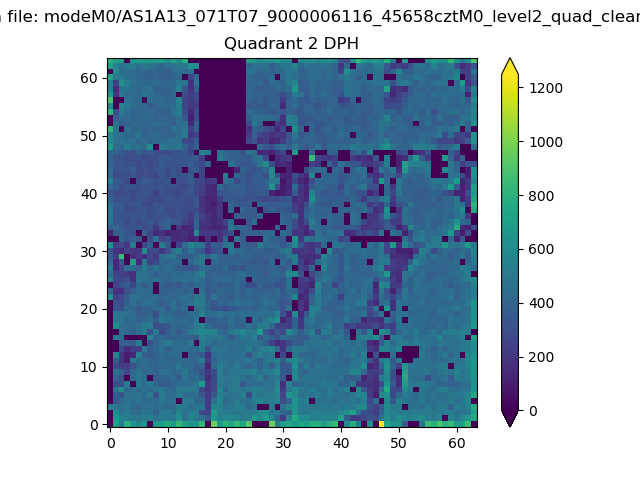
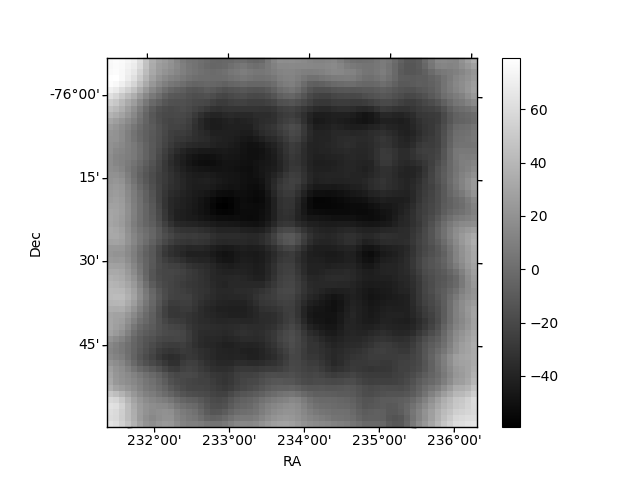
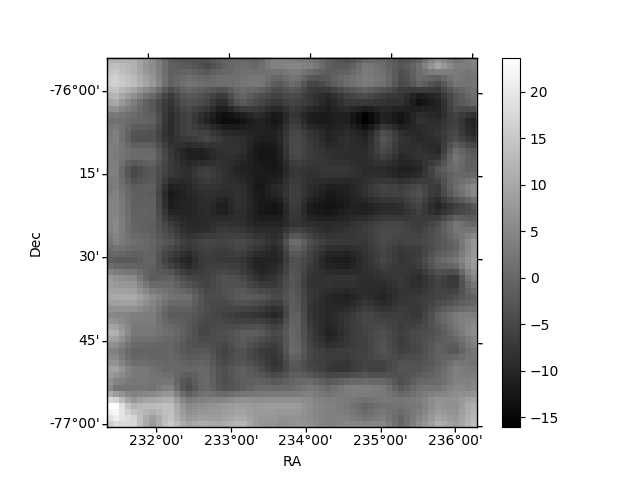
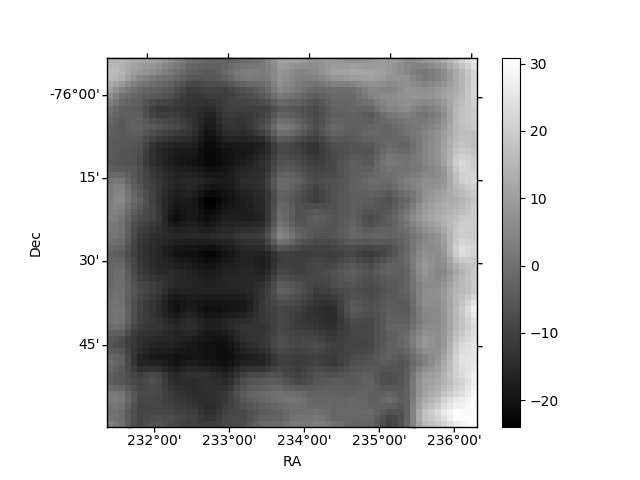
Histogram calculated using DETX and DETY for each event in the final _common_clean file
| Quadrant A | 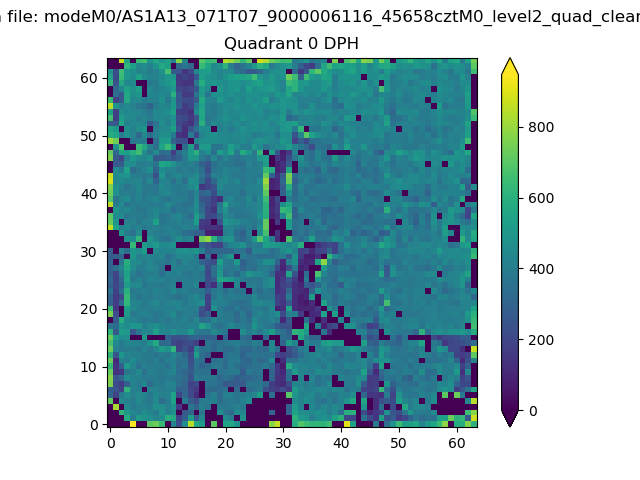 |
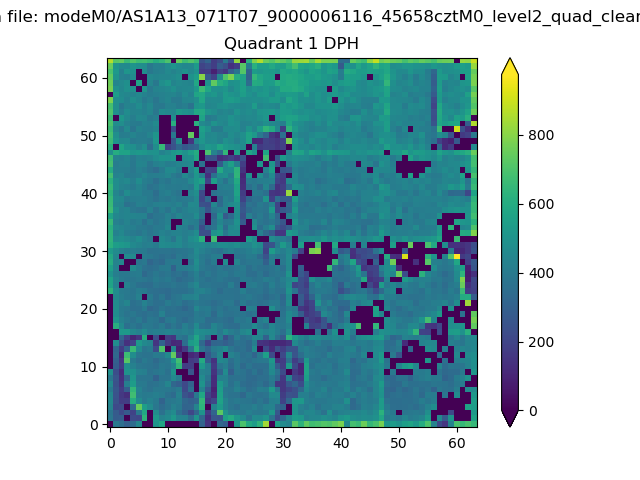 |
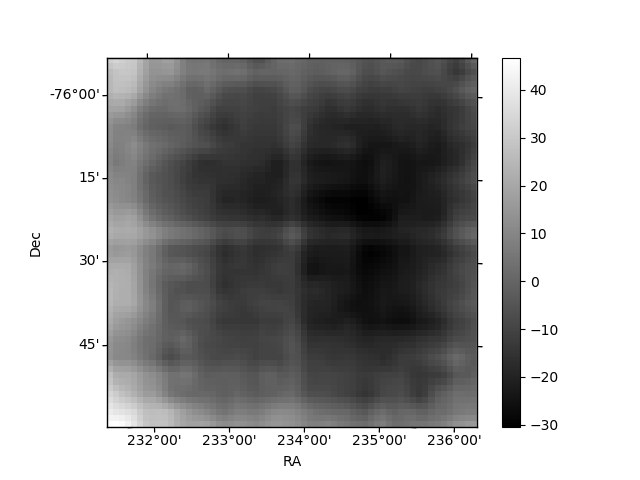
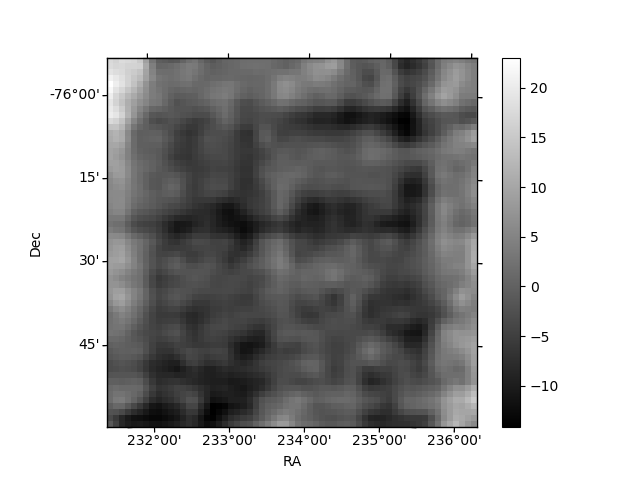
Quadrant B |
|---|---|---|---|
| Quadrant D | 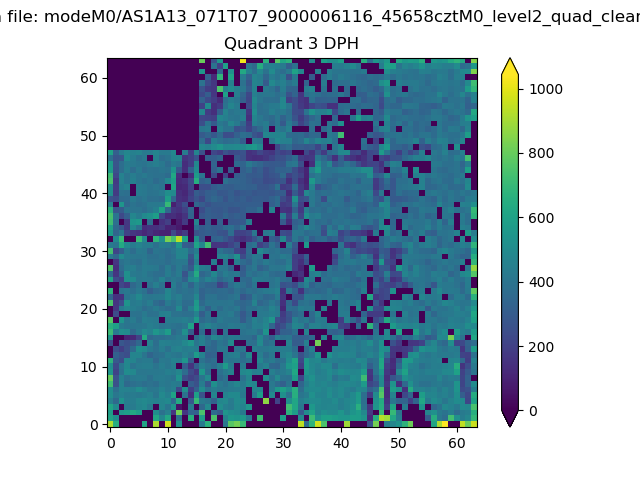 |
 |
Quadrant C |
| Plot type | Count rate plots | Images |
|---|---|---|
| Comparison with Poisson distribution Blue bars denote a histogram of data divided into 1 sec bins. Red curve is a Poisson curve with rate = median count rate of data. |
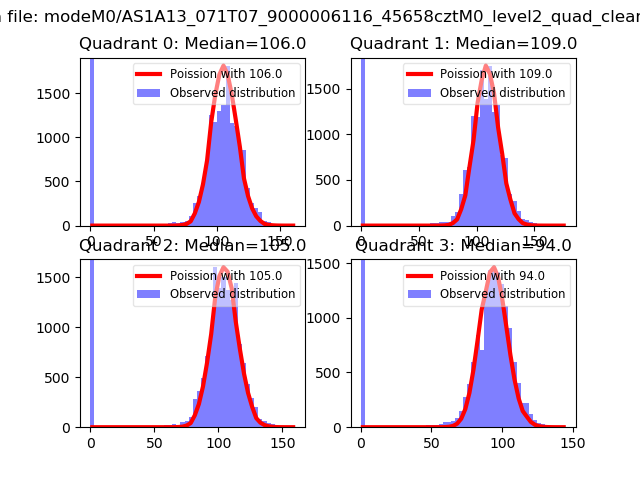 |
 |
| Quadrant-wise count rates Data is divided into 100 sec bins |
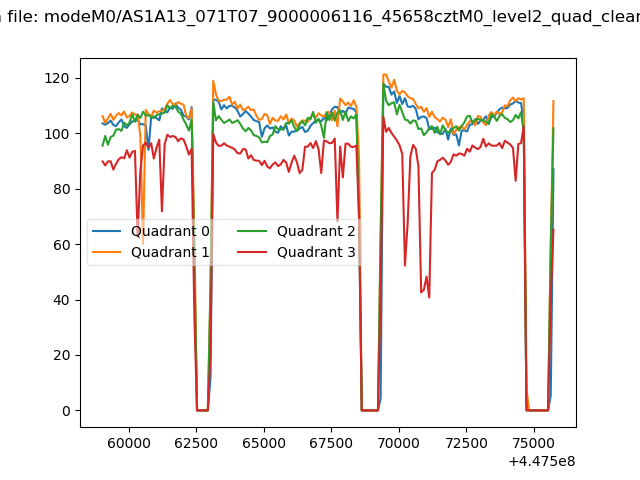 |
|
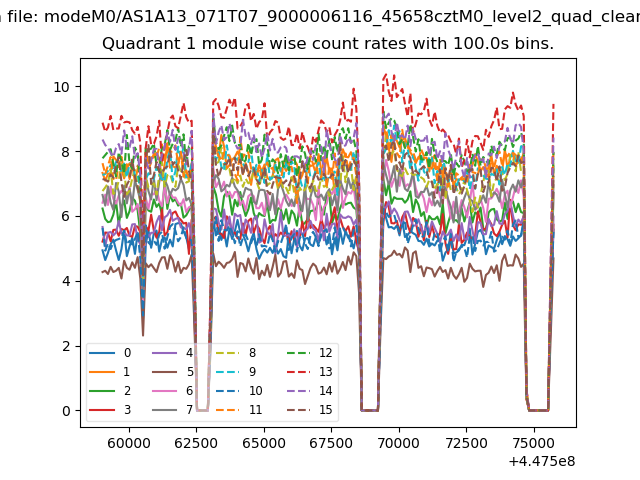
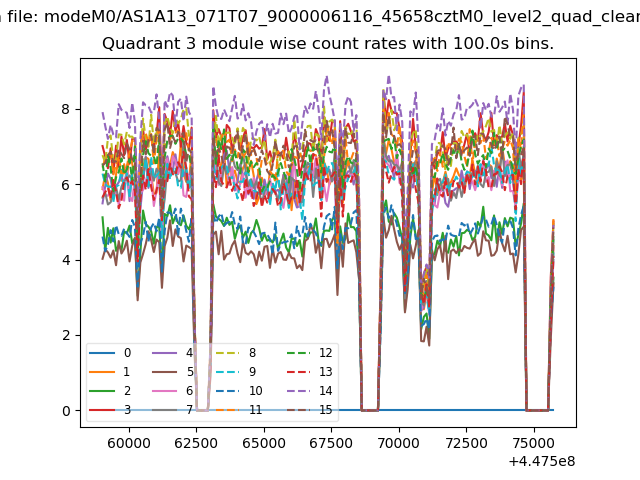
| Module-wise count rates for Quadrant A Data is divided into 100 sec bins |
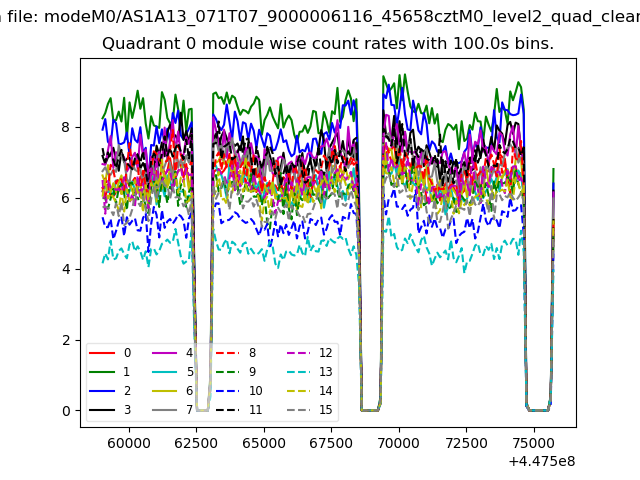 |
 |
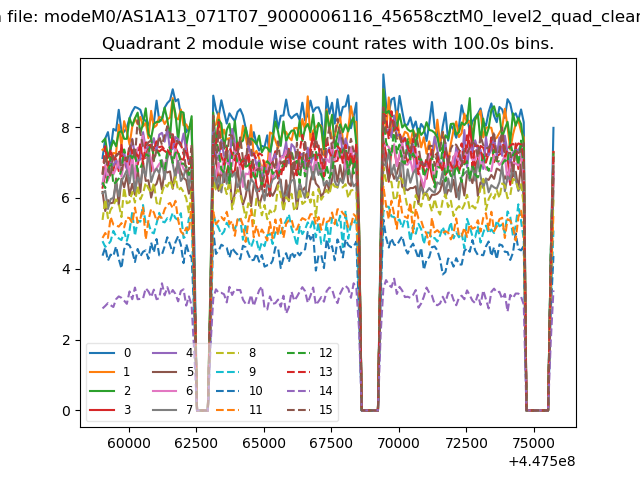
| Module-wise count rates for Quadrant B Data is divided into 100 sec bins |
 |
 |
| Module-wise count rates for Quadrant C Data is divided into 100 sec bins |
 |
 |
| Module-wise count rates for Quadrant D Data is divided into 100 sec bins |
 |
 |
| Parameter | Plot |
|---|---|
| CZT HV Monitor | 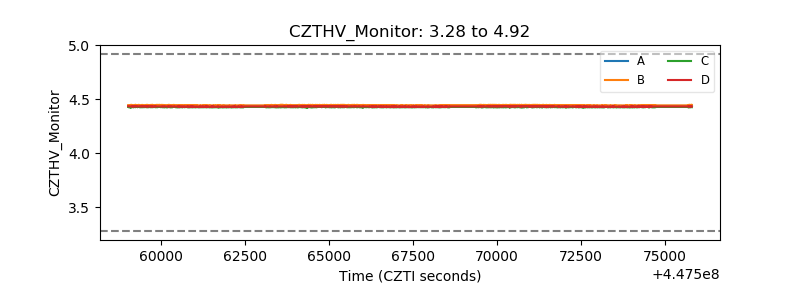 |
| D_VDD | 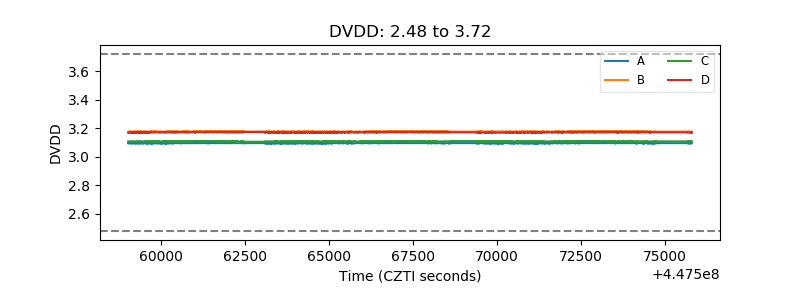 |
| Temperature 1 | 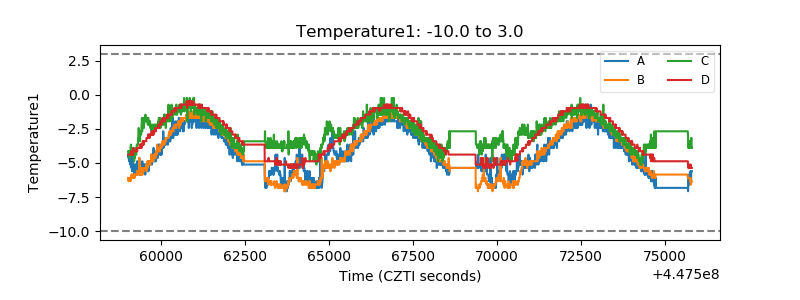 |
| Veto HV Monitor | 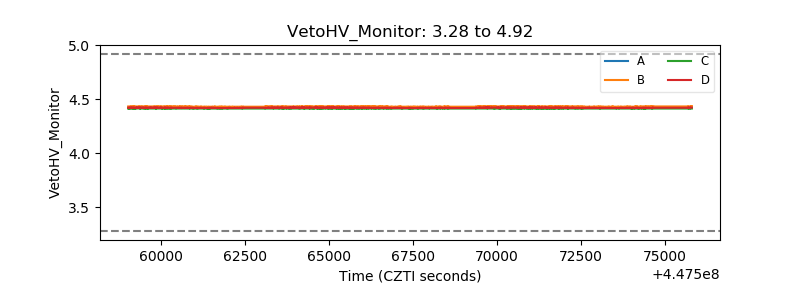 |
| Veto LLD | 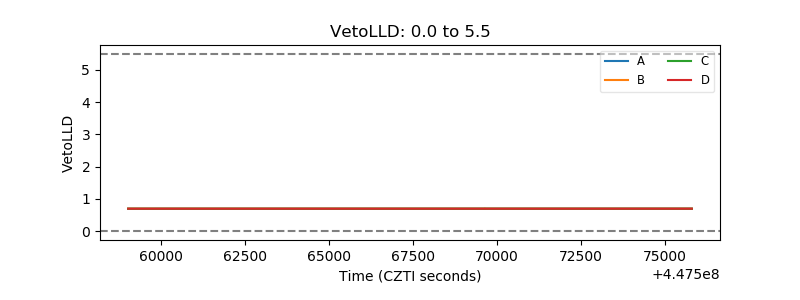 |
| Alpha Counter | 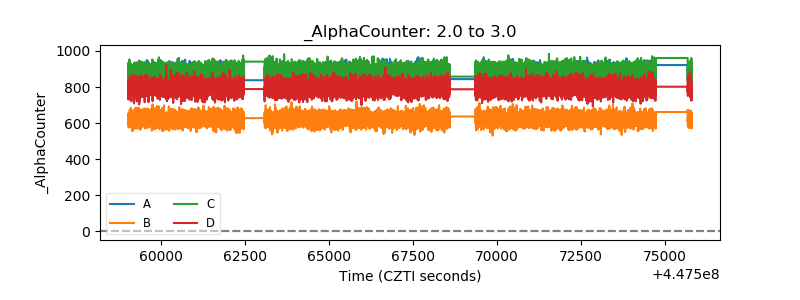 |
| _CPM_Rate | 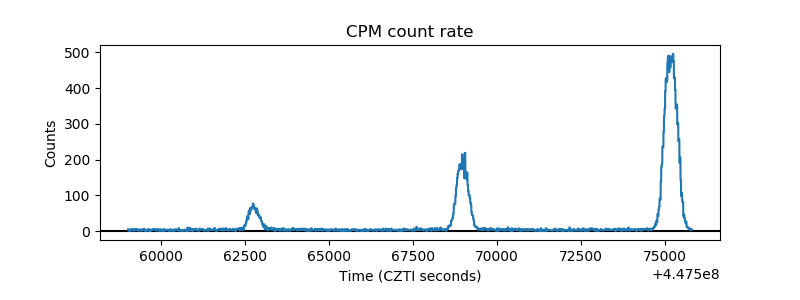 |
| CZT Counter | 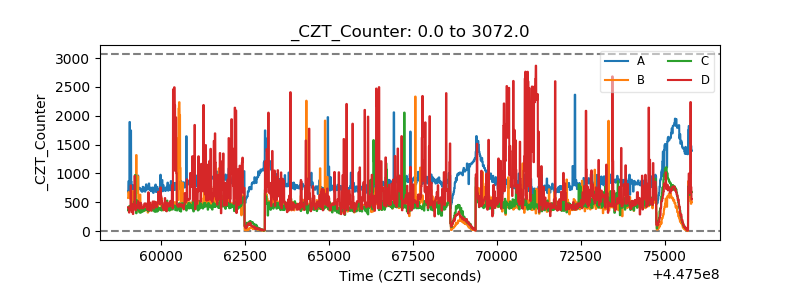 |
| +2.5 Volts monitor | 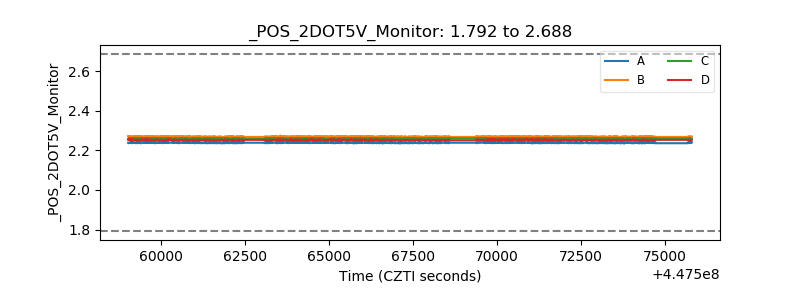 |
| +5 Volts monitor | 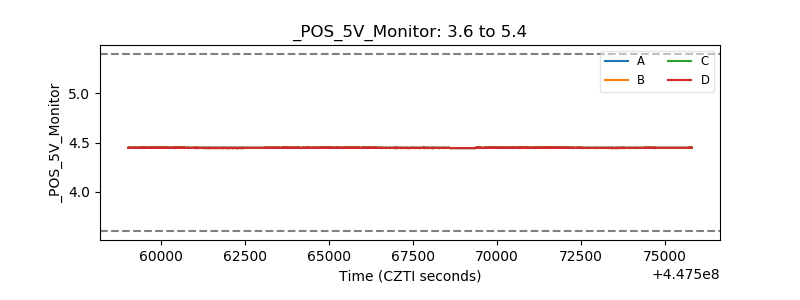 |
| _ROLL_ROT | 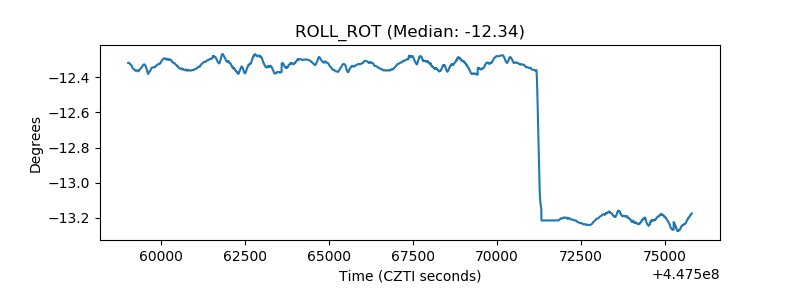 |
| _Roll_DEC | 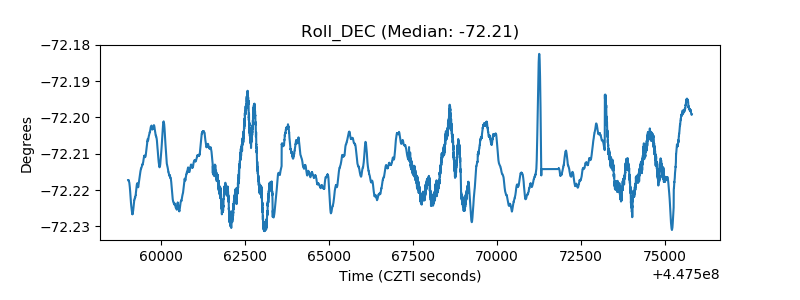 |
| _Roll_RA | 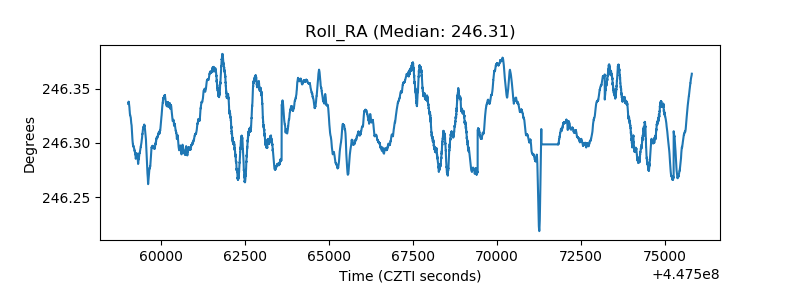 |
| Veto Counter | 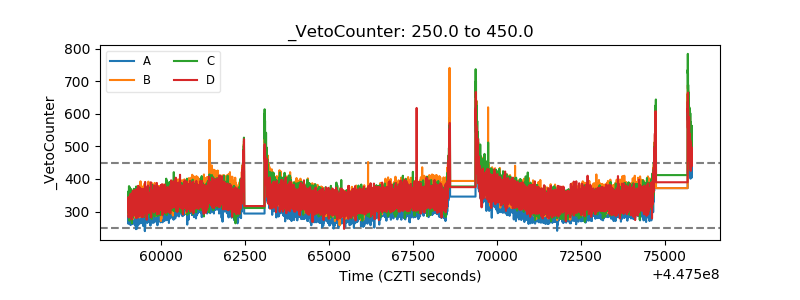 |