| Param | Original file | Final file |
|---|---|---|
| Filename | modeM0/AS1A13_071T07_9000006116_45660cztM0_level2.fits | modeM0/AS1A13_071T07_9000006116_45660cztM0_level2_quad_clean.evt |
| Size (bytes) | 522,221,760 | 110,404,800 |
| Size | 498.0 MB | 105.3 MB |
| Events in quadrant A | 5,934,572 | 735,888 |
| Events in quadrant B | 3,419,471 | 771,051 |
| Events in quadrant C | 4,386,934 | 721,802 |
| Events in quadrant D | 5,077,816 | 653,578 |
| Mode M9 | |||
|---|---|---|---|
| Quadrant | BADHDUFLAG | Total packets | Discarded packets |
| A | 0 | 17 | 0 |
| B | 0 | 18 | 0 |
| C | 0 | 18 | 0 |
| D | 0 | 18 | 0 |
| Mode M0 | |||
|---|---|---|---|
| Quadrant | BADHDUFLAG | Total packets | Discarded packets |
| A | 0 | 21769 | 2 |
| B | 0 | 14499 | 3 |
| C | 0 | 17423 | 2 |
| D | 0 | 19501 | 2 |
| Mode SS | |||
|---|---|---|---|
| Quadrant | BADHDUFLAG | Total packets | Discarded packets |
| A | 0 | 134 | 0 |
| B | 0 | 134 | 0 |
| C | 0 | 134 | 0 |
| D | 0 | 134 | 0 |
| Quadrant | Total seconds | Saturated seconds | Saturation percentage |
|---|---|---|---|
| A | 6608 | 208 | 3.147700% |
| B | 6607 | 132 | 1.997881% |
| C | 6607 | 272 | 4.116846% |
| D | 6607 | 372 | 5.630392% |
Noise dominated data is calculated using 1-second bins in cleaned event files. If a bin has >2000 counts, and if more than 50% of those come from <1% of pixels, then it is considered to be noise-dominated and hence unusable.
| Quadrant | # 1 sec bins | Bins with >0 counts | Bins with >2000 counts | High rate bins dominated by noise | Noise dominated (total time) | Noise dominated (detector-on time) | Marked lightcurve |
|---|---|---|---|---|---|---|---|
| A | 7658 | 6609 | 15 | 15 | 0.20% | 0.23% | 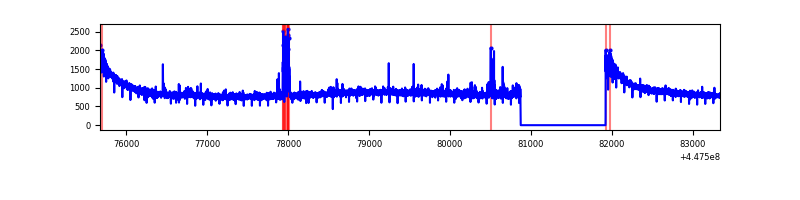 |
| B | 7657 | 6607 | 46 | 46 | 0.60% | 0.70% | 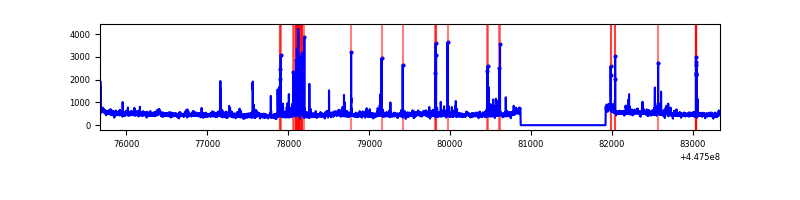 |
| C | 7657 | 6608 | 204 | 204 | 2.66% | 3.09% | 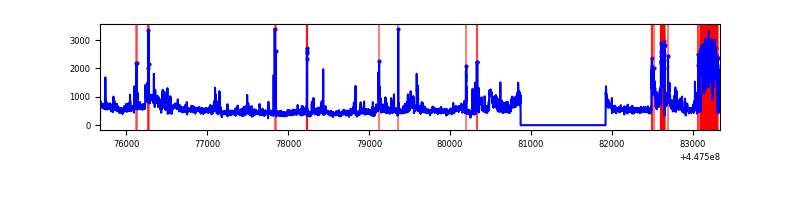 |
| D | 7657 | 6608 | 252 | 252 | 3.29% | 3.81% | 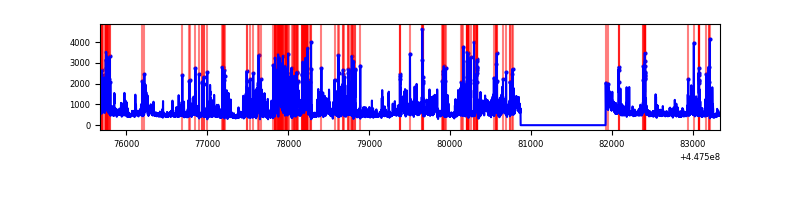 |
Top three noisy pixels from each quadrant. If the there are fewer than three noisy pixels in the level2.evt file, extra rows are filled as -1
| Pixel properties | Quadrant properties | ||||||
|---|---|---|---|---|---|---|---|
| Quadrant | DetID | PixID | Counts | Sigma | Mean | Median | Sigma |
| A | 10 | 83 | 2914242 | 18744.79 | 751 | 734 | 155.4 |
| A | 13 | 248 | 64563 | 410.66 | 751 | 734 | 155.4 |
| A | 14 | 235 | 26336 | 164.72 | 751 | 734 | 155.4 |
| B | 5 | 172 | 216787 | 1470.78 | 752 | 728 | 146.9 |
| B | 3 | 112 | 75023 | 505.75 | 752 | 728 | 146.9 |
| B | 0 | 183 | 55124 | 370.29 | 752 | 728 | 146.9 |
| C | 9 | 54 | 1412823 | 8130.19 | 742 | 746 | 173.7 |
| C | 14 | 254 | 43621 | 246.86 | 742 | 746 | 173.7 |
| C | 2 | 14 | 12926 | 70.13 | 742 | 746 | 173.7 |
| D | 1 | 52 | 1395828 | 7525.37 | 737 | 712 | 185.4 |
| D | 13 | 249 | 380957 | 2051.07 | 737 | 712 | 185.4 |
| D | 11 | 241 | 137413 | 737.38 | 737 | 712 | 185.4 |
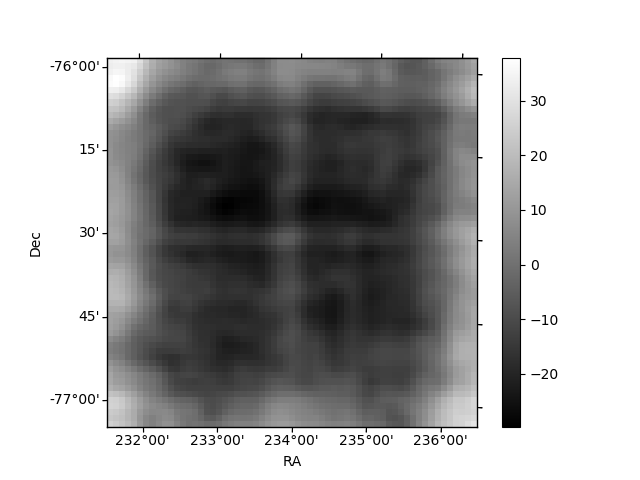
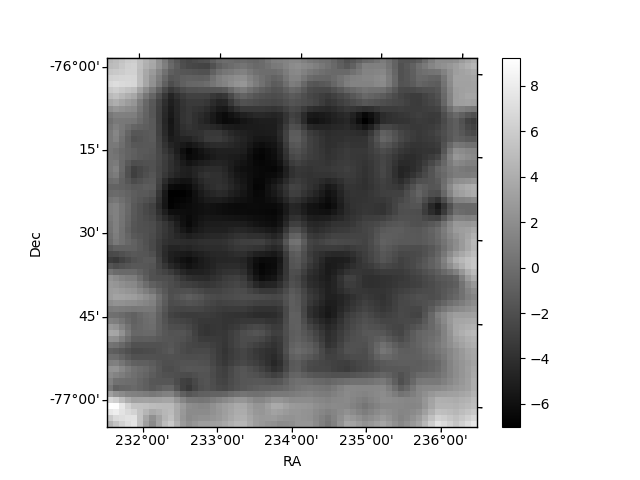
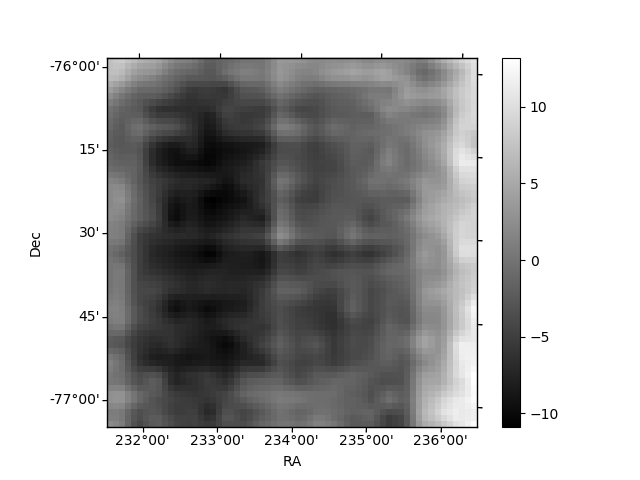
Histogram calculated using DETX and DETY for each event in the final _common_clean file
| Quadrant A | 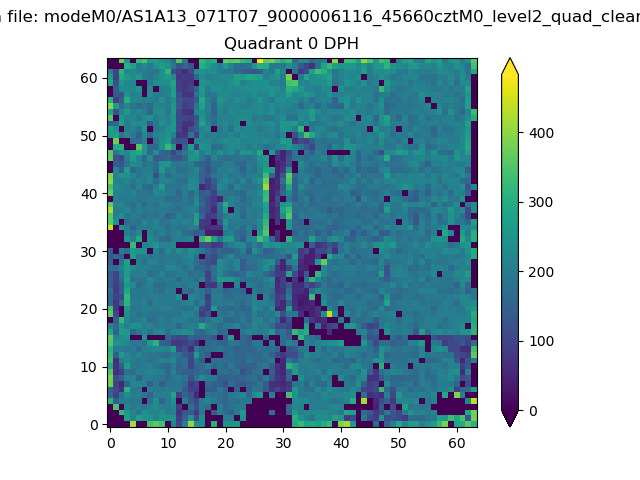 |
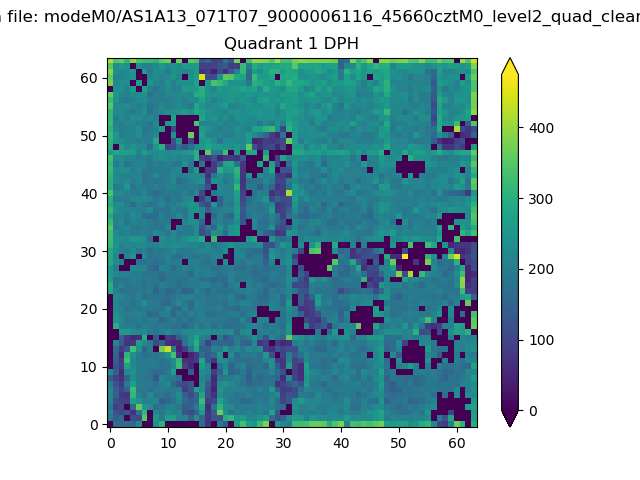 |
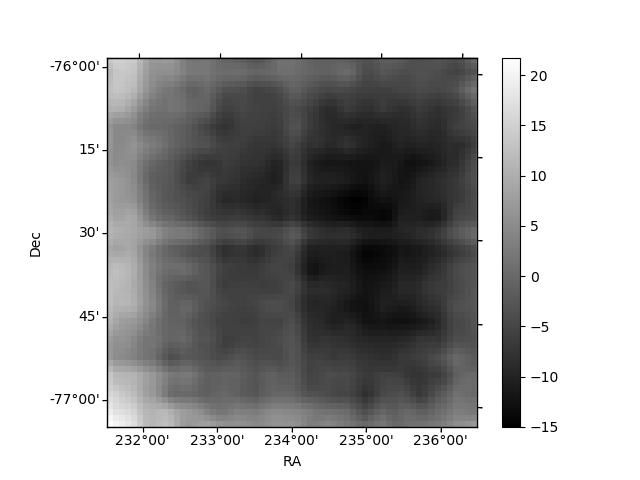
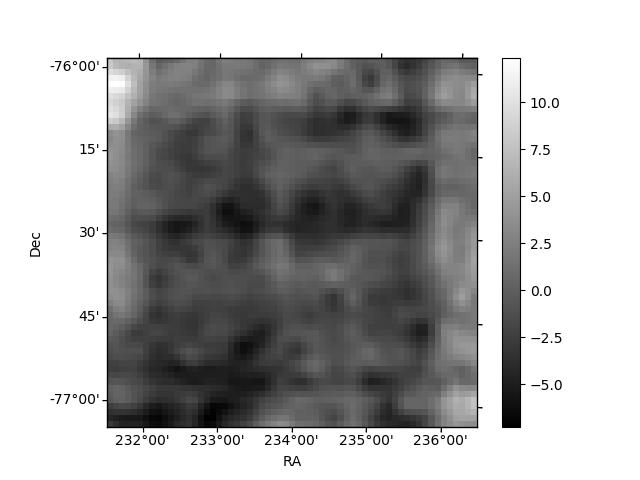
Quadrant B |
|---|---|---|---|
| Quadrant D | 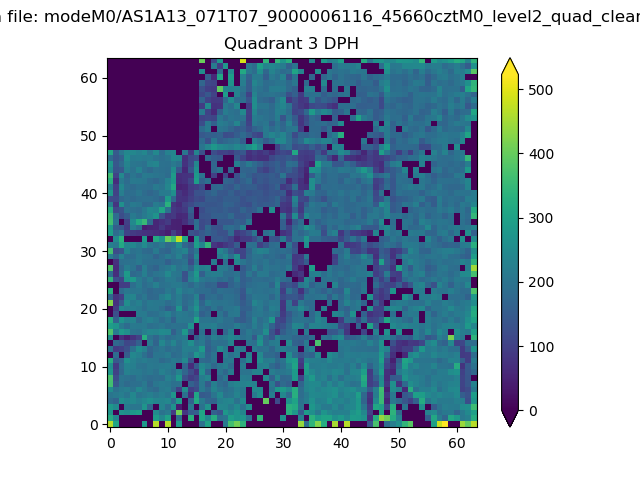 |
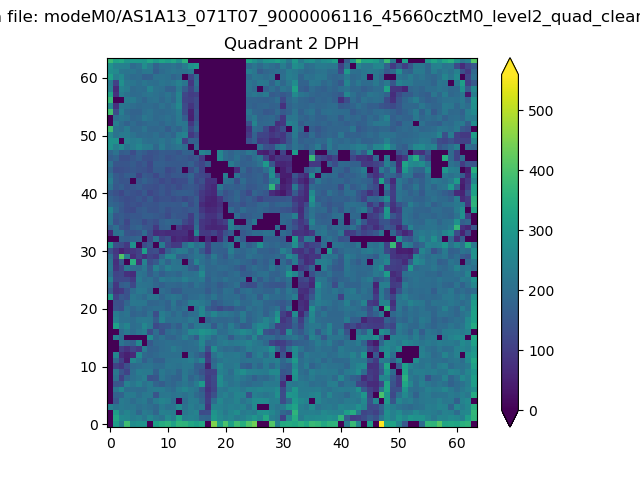 |
Quadrant C |
| Plot type | Count rate plots | Images |
|---|---|---|
| Comparison with Poisson distribution Blue bars denote a histogram of data divided into 1 sec bins. Red curve is a Poisson curve with rate = median count rate of data. |
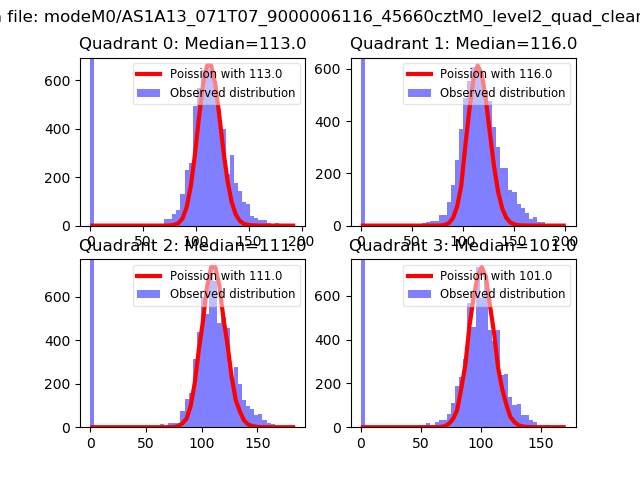 |
 |
| Quadrant-wise count rates Data is divided into 100 sec bins |
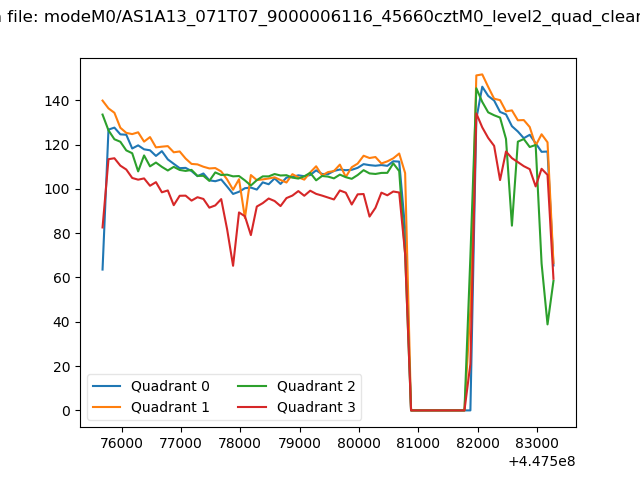 |
|
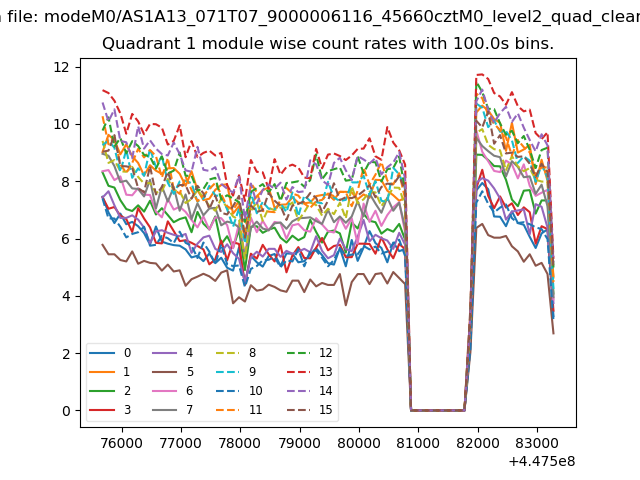
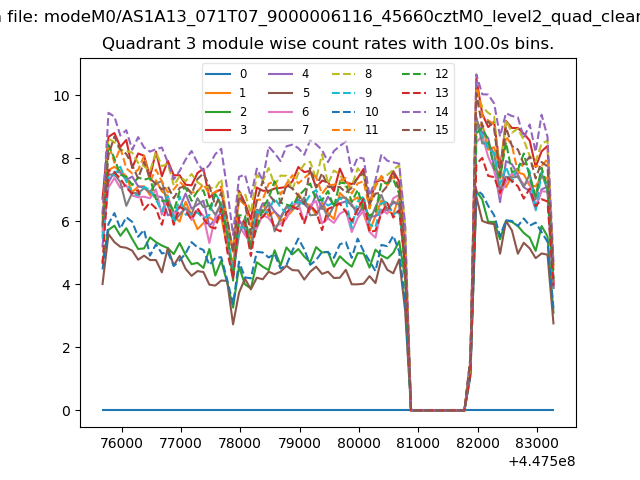
| Module-wise count rates for Quadrant A Data is divided into 100 sec bins |
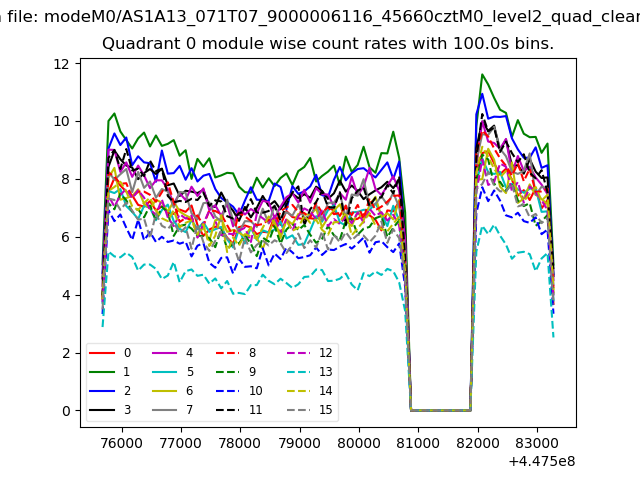 |
 |
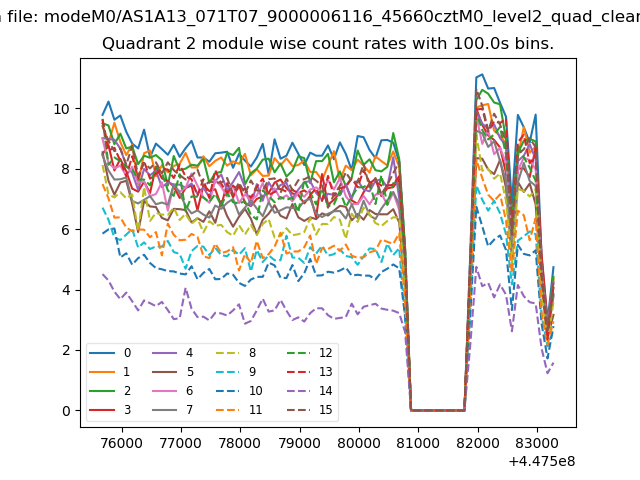
| Module-wise count rates for Quadrant B Data is divided into 100 sec bins |
 |
 |
| Module-wise count rates for Quadrant C Data is divided into 100 sec bins |
 |
 |
| Module-wise count rates for Quadrant D Data is divided into 100 sec bins |
 |
 |
| Parameter | Plot |
|---|---|
| CZT HV Monitor | 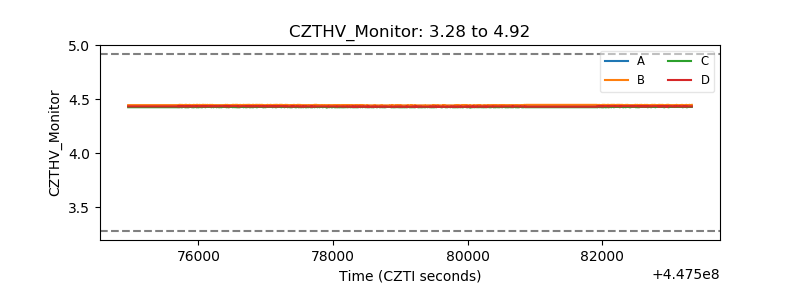 |
| D_VDD | 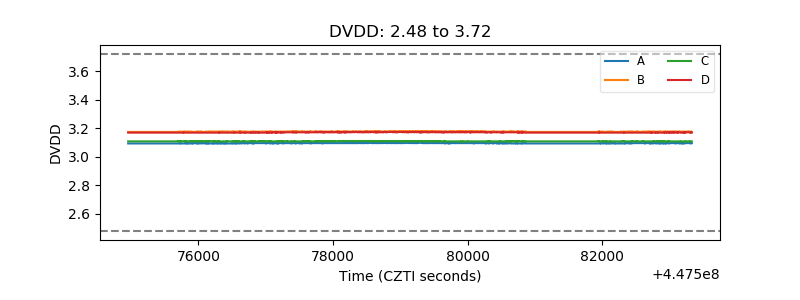 |
| Temperature 1 | 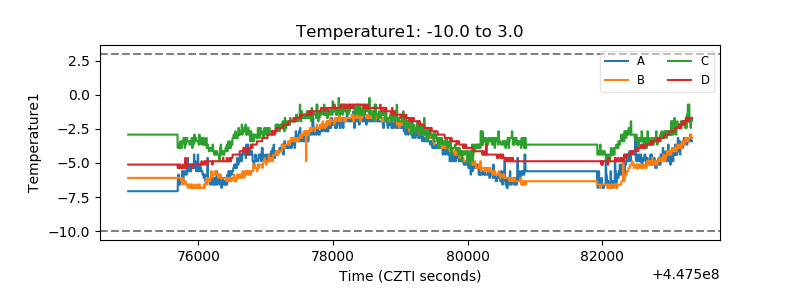 |
| Veto HV Monitor | 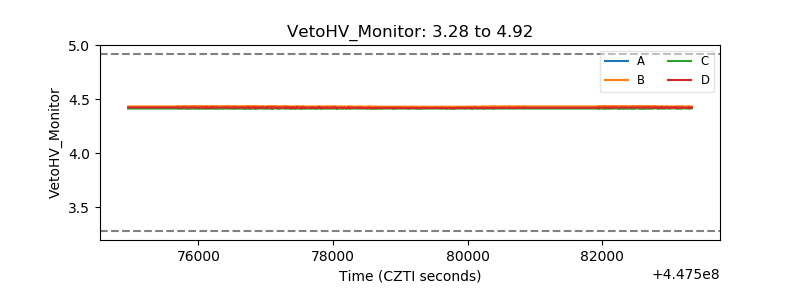 |
| Veto LLD | 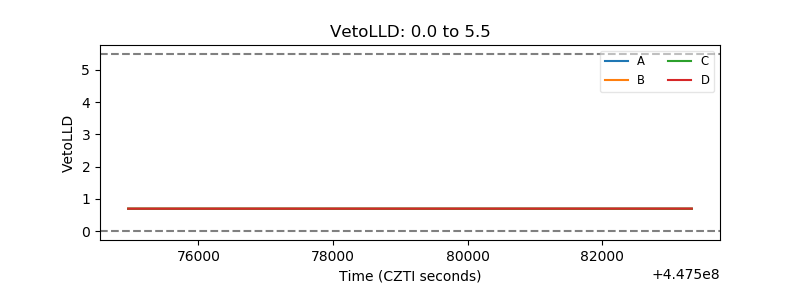 |
| Alpha Counter | 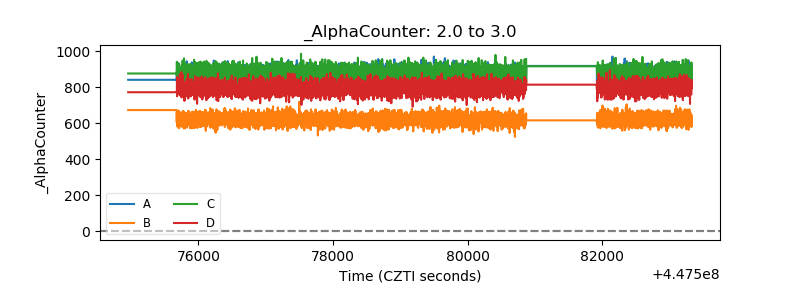 |
| _CPM_Rate | 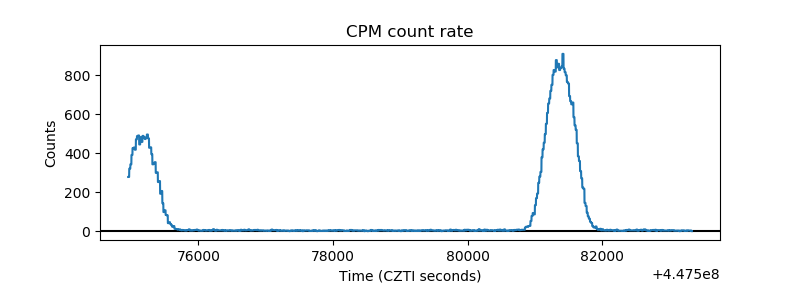 |
| CZT Counter | 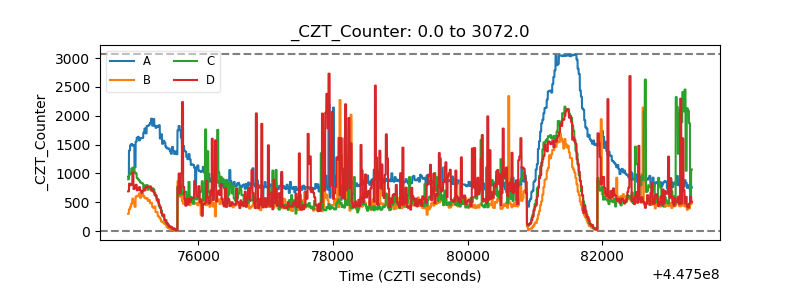 |
| +2.5 Volts monitor | 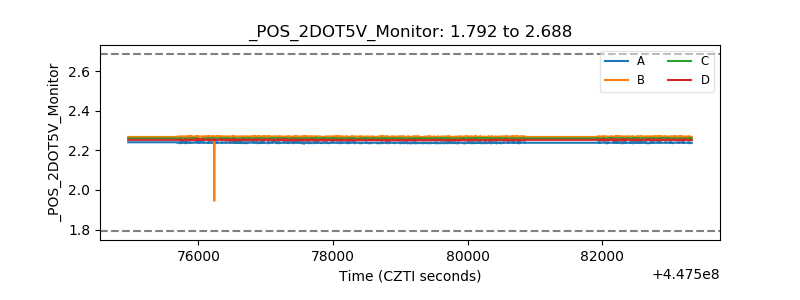 |
| +5 Volts monitor | 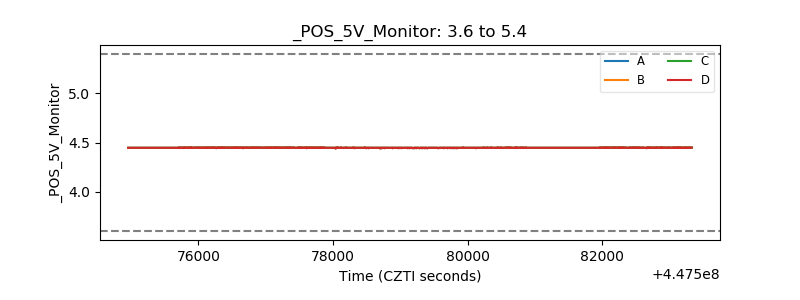 |
| _ROLL_ROT | 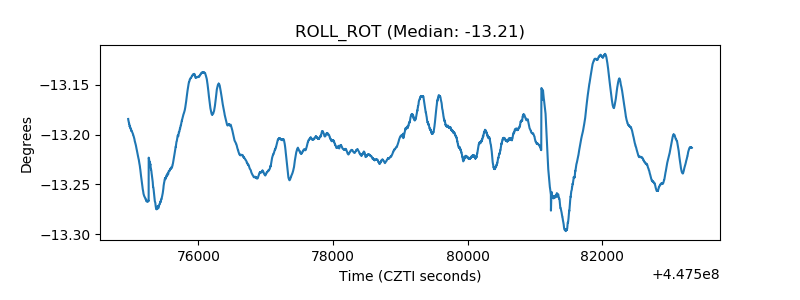 |
| _Roll_DEC | 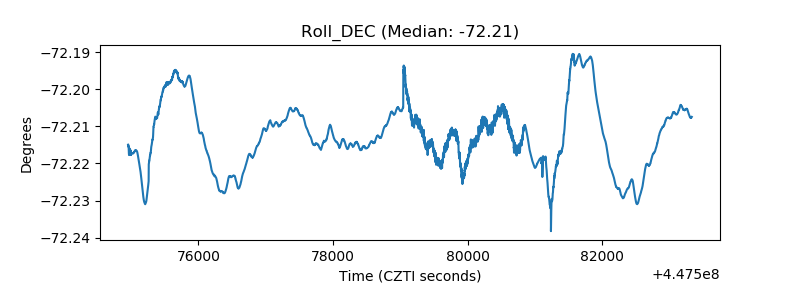 |
| _Roll_RA | 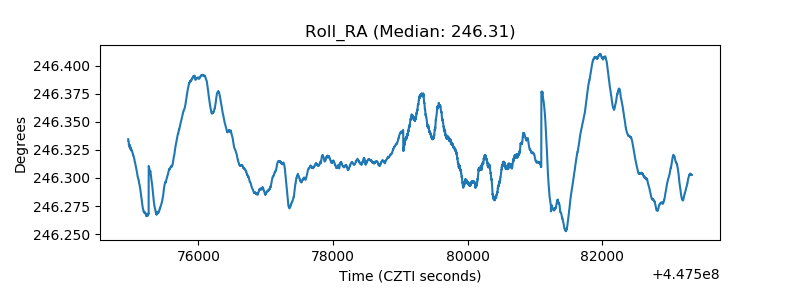 |
| Veto Counter | 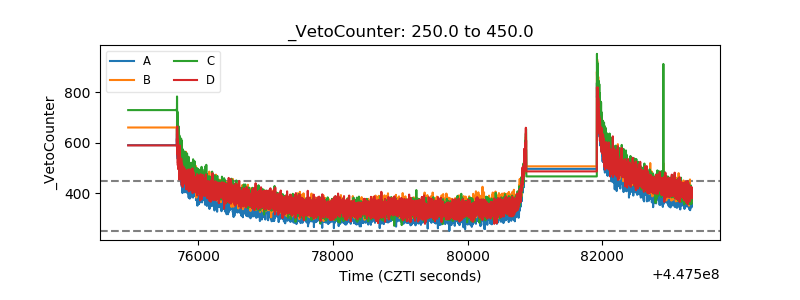 |