| Param | Original file | Final file |
|---|---|---|
| Filename | modeM0/AS1A13_071T07_9000006116_45661cztM0_level2.fits | modeM0/AS1A13_071T07_9000006116_45661cztM0_level2_quad_clean.evt |
| Size (bytes) | 754,407,360 | 109,825,920 |
| Size | 719.5 MB | 104.7 MB |
| Events in quadrant A | 6,158,595 | 808,507 |
| Events in quadrant B | 4,695,724 | 812,731 |
| Events in quadrant C | 11,775,536 | 507,958 |
| Events in quadrant D | 4,768,067 | 720,990 |
| Mode M9 | |||
|---|---|---|---|
| Quadrant | BADHDUFLAG | Total packets | Discarded packets |
| A | 0 | 12 | 0 |
| B | 0 | 12 | 0 |
| C | 0 | 12 | 0 |
| D | 0 | 12 | 0 |
| Mode M0 | |||
|---|---|---|---|
| Quadrant | BADHDUFLAG | Total packets | Discarded packets |
| A | 0 | 22390 | 3 |
| B | 0 | 18366 | 1 |
| C | 0 | 39610 | 1 |
| D | 0 | 18730 | 1 |
| Mode SS | |||
|---|---|---|---|
| Quadrant | BADHDUFLAG | Total packets | Discarded packets |
| A | 0 | 136 | 0 |
| B | 0 | 136 | 0 |
| C | 0 | 136 | 0 |
| D | 0 | 136 | 0 |
| Quadrant | Total seconds | Saturated seconds | Saturation percentage |
|---|---|---|---|
| A | 6825 | 193 | 2.827839% |
| B | 6826 | 461 | 6.753589% |
| C | 6826 | 2957 | 43.319660% |
| D | 6826 | 299 | 4.380311% |
Noise dominated data is calculated using 1-second bins in cleaned event files. If a bin has >2000 counts, and if more than 50% of those come from <1% of pixels, then it is considered to be noise-dominated and hence unusable.
| Quadrant | # 1 sec bins | Bins with >0 counts | Bins with >2000 counts | High rate bins dominated by noise | Noise dominated (total time) | Noise dominated (detector-on time) | Marked lightcurve |
|---|---|---|---|---|---|---|---|
| A | 7975 | 6825 | 9 | 9 | 0.11% | 0.13% | 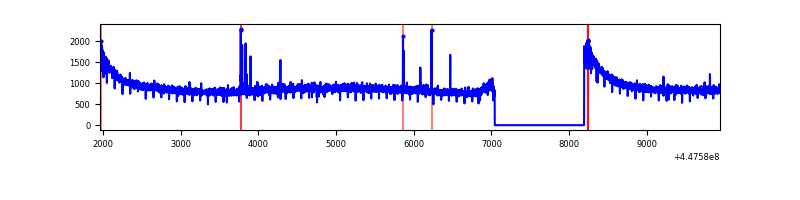 |
| B | 7976 | 6826 | 337 | 337 | 4.23% | 4.94% | 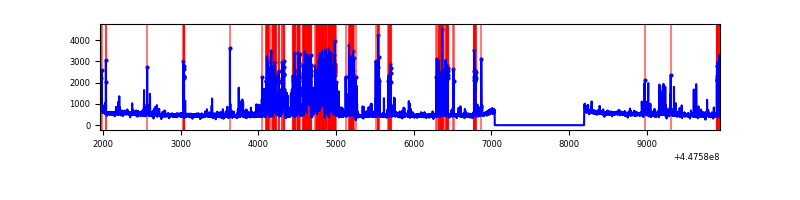 |
| C | 7976 | 6826 | 2818 | 2818 | 35.33% | 41.28% | 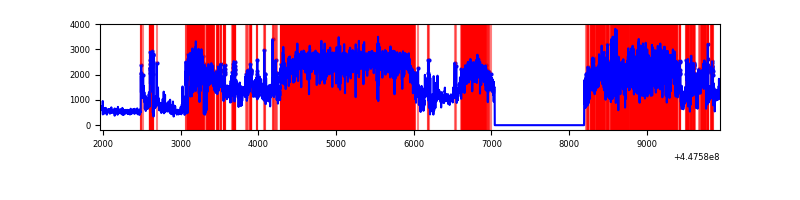 |
| D | 7976 | 6826 | 188 | 188 | 2.36% | 2.75% | 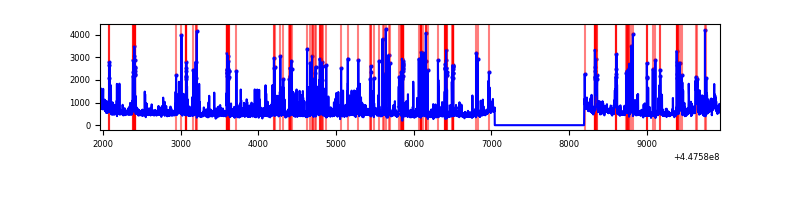 |
Top three noisy pixels from each quadrant. If the there are fewer than three noisy pixels in the level2.evt file, extra rows are filled as -1
| Pixel properties | Quadrant properties | ||||||
|---|---|---|---|---|---|---|---|
| Quadrant | DetID | PixID | Counts | Sigma | Mean | Median | Sigma |
| A | 10 | 83 | 3009418 | 18239.62 | 801 | 785 | 165.0 |
| A | 13 | 248 | 19428 | 113.02 | 801 | 785 | 165.0 |
| A | 0 | 243 | 14131 | 80.91 | 801 | 785 | 165.0 |
| B | 12 | 16 | 1064211 | 7059.57 | 784 | 761 | 150.6 |
| B | 5 | 172 | 273871 | 1813.01 | 784 | 761 | 150.6 |
| B | 3 | 112 | 71149 | 467.26 | 784 | 761 | 150.6 |
| C | 9 | 54 | 8944495 | 55615.6 | 694 | 698 | 160.8 |
| C | 0 | 64 | 60478 | 371.73 | 694 | 698 | 160.8 |
| C | 14 | 254 | 34172 | 208.15 | 694 | 698 | 160.8 |
| D | 1 | 52 | 807233 | 4086.98 | 786 | 763 | 197.3 |
| D | 13 | 249 | 381212 | 1928.02 | 786 | 763 | 197.3 |
| D | 5 | 222 | 139854 | 704.88 | 786 | 763 | 197.3 |
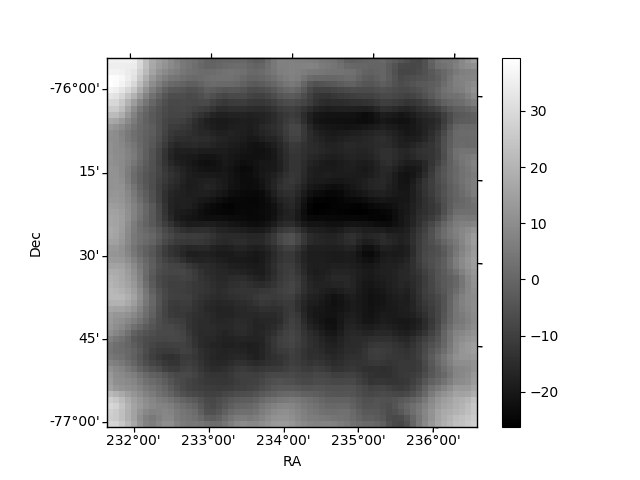
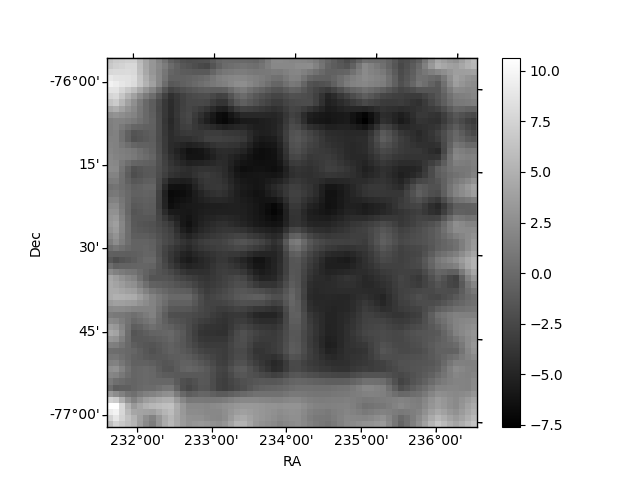
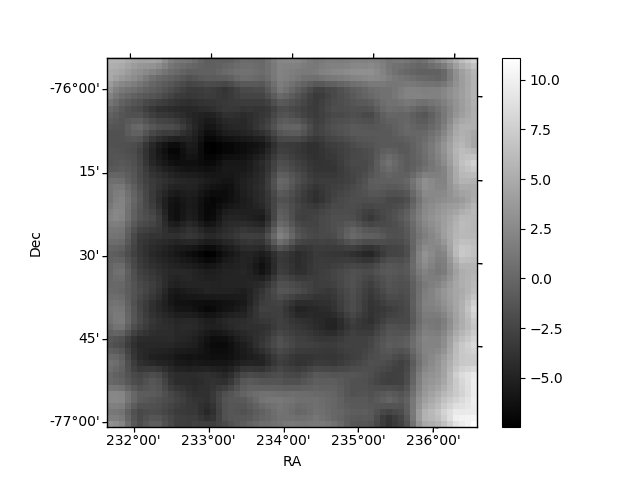
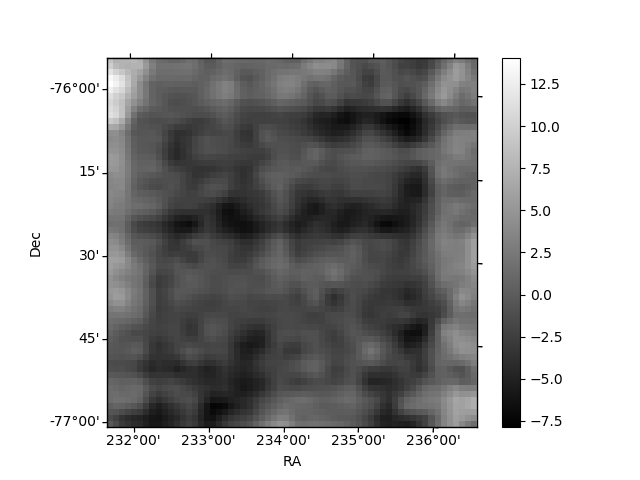
Histogram calculated using DETX and DETY for each event in the final _common_clean file
| Quadrant A | 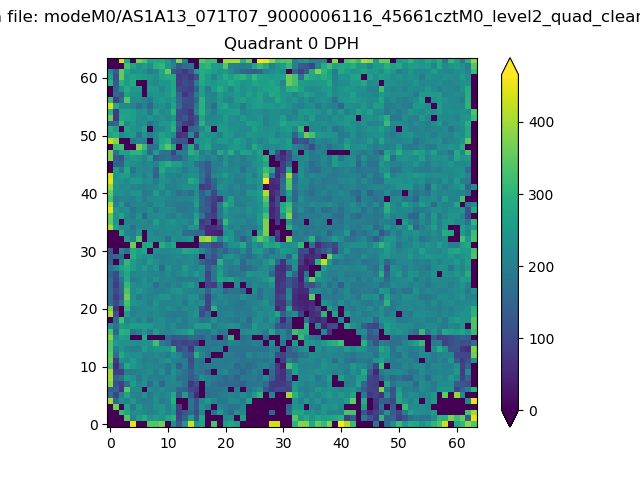 |
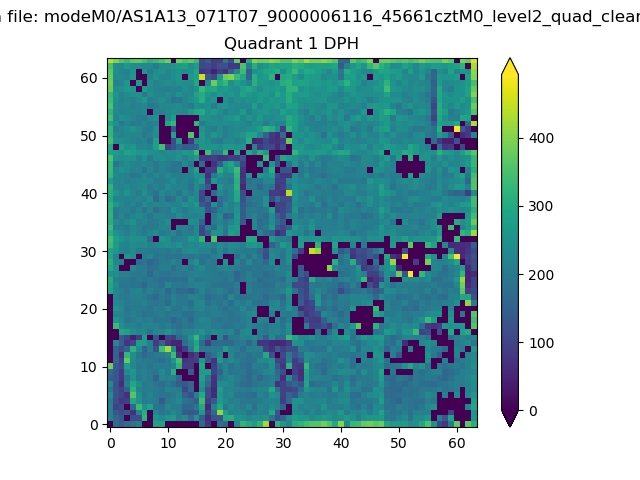 |
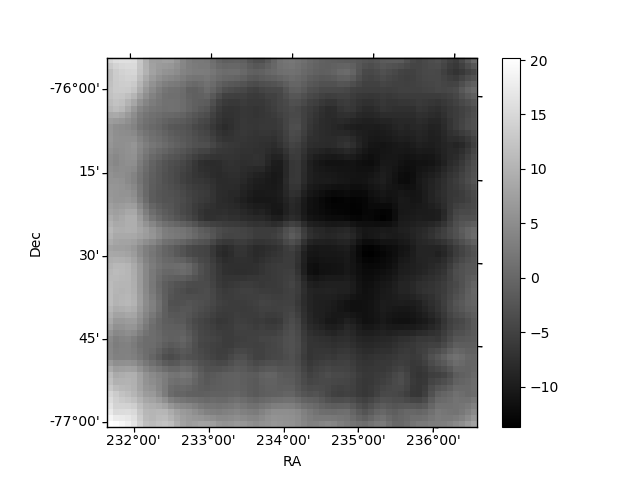
Quadrant B |
|---|---|---|---|
| Quadrant D | 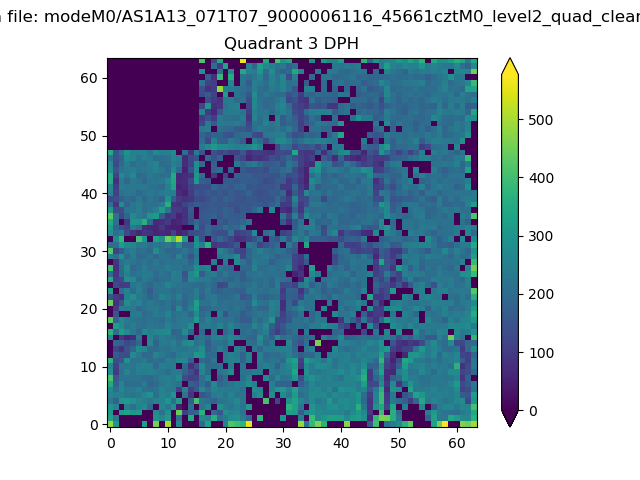 |
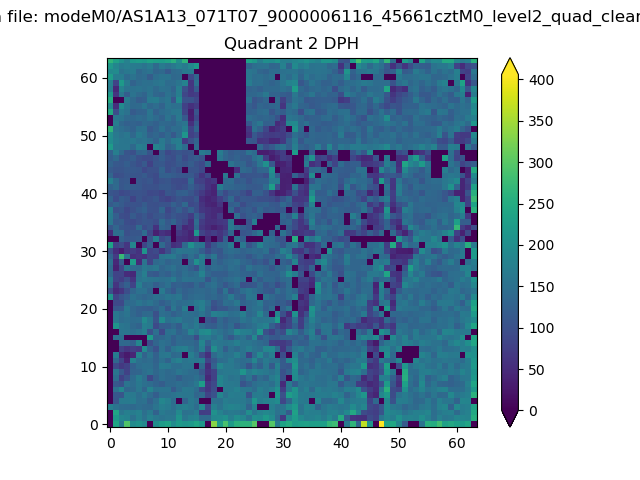 |
Quadrant C |
| Plot type | Count rate plots | Images |
|---|---|---|
| Comparison with Poisson distribution Blue bars denote a histogram of data divided into 1 sec bins. Red curve is a Poisson curve with rate = median count rate of data. |
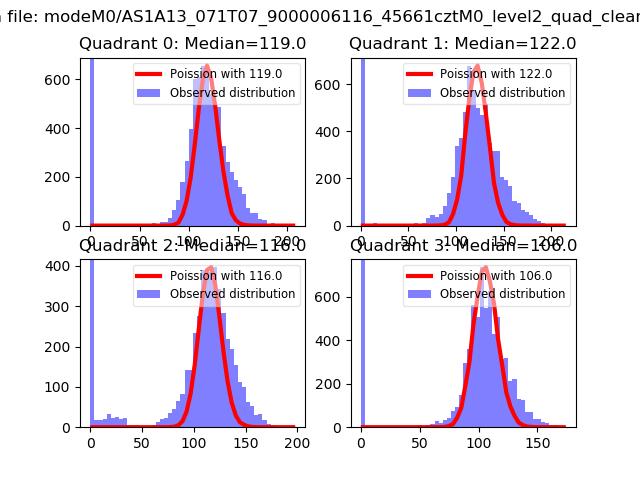 |
 |
| Quadrant-wise count rates Data is divided into 100 sec bins |
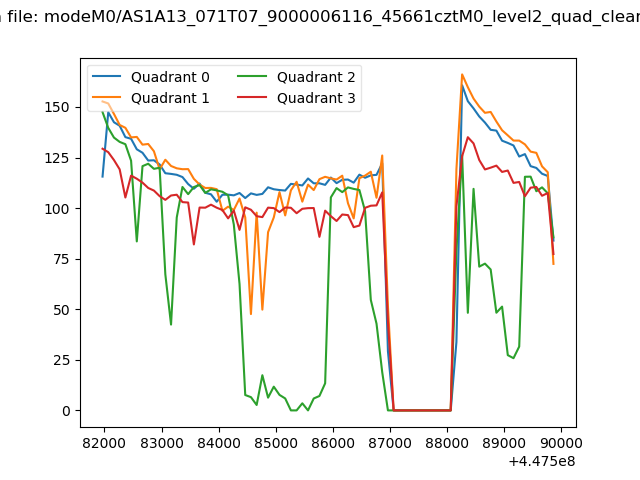 |
|
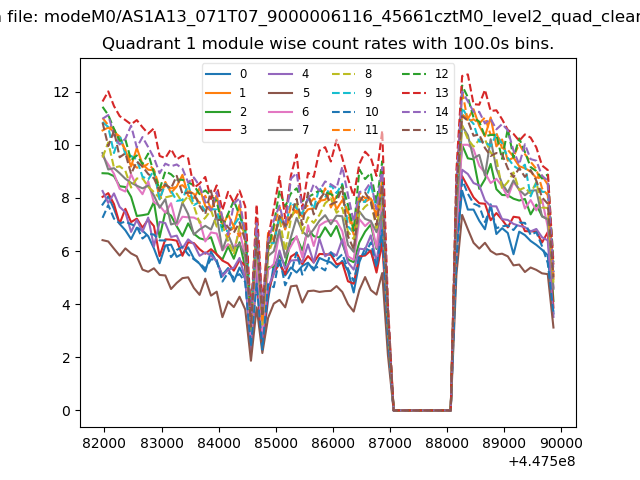
| Module-wise count rates for Quadrant A Data is divided into 100 sec bins |
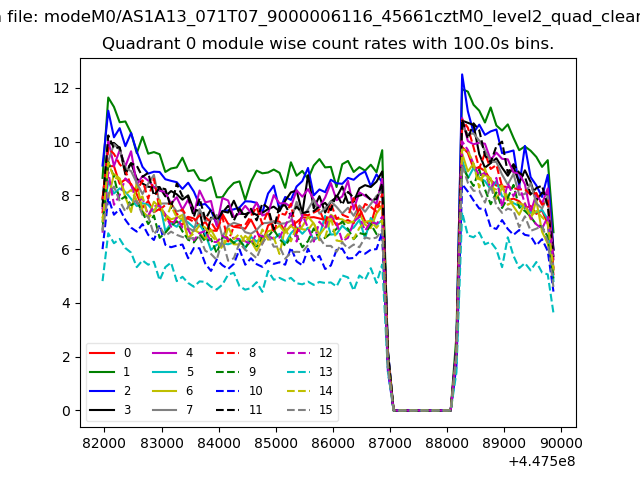 |
 |
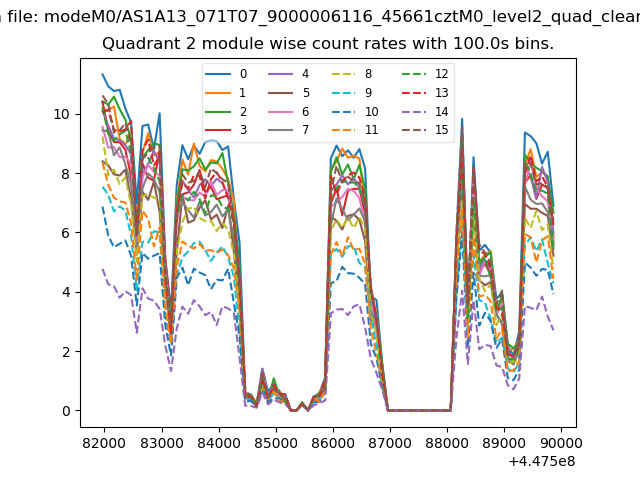
| Module-wise count rates for Quadrant B Data is divided into 100 sec bins |
 |
 |
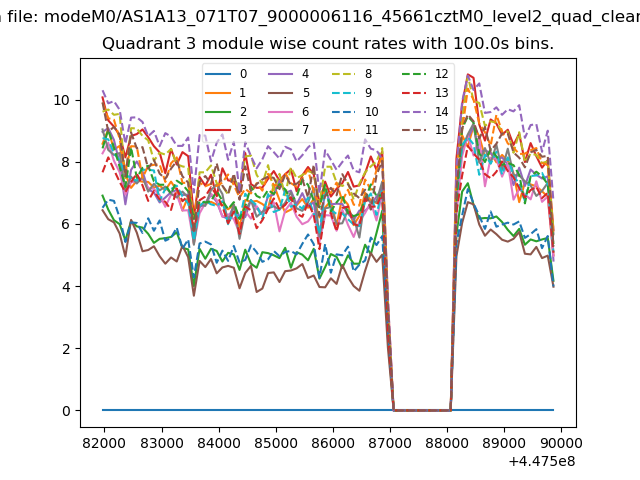
| Module-wise count rates for Quadrant C Data is divided into 100 sec bins |
 |
 |
| Module-wise count rates for Quadrant D Data is divided into 100 sec bins |
 |
 |
| Parameter | Plot |
|---|---|
| CZT HV Monitor | 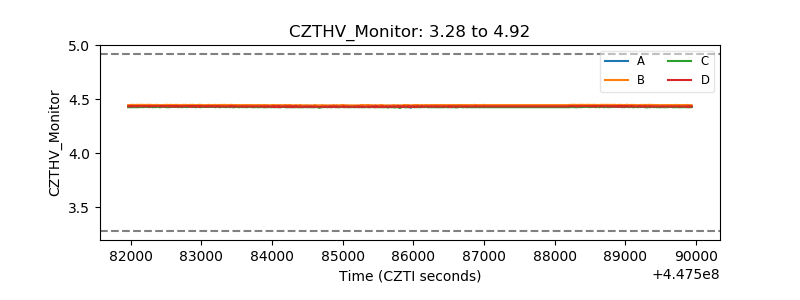 |
| D_VDD | 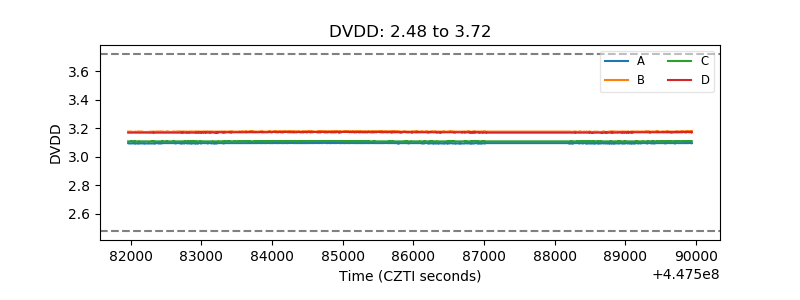 |
| Temperature 1 | 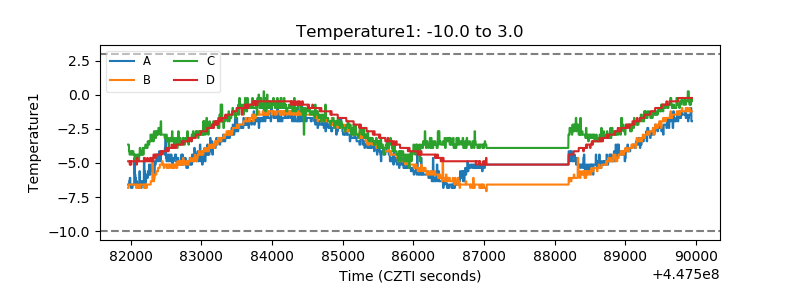 |
| Veto HV Monitor | 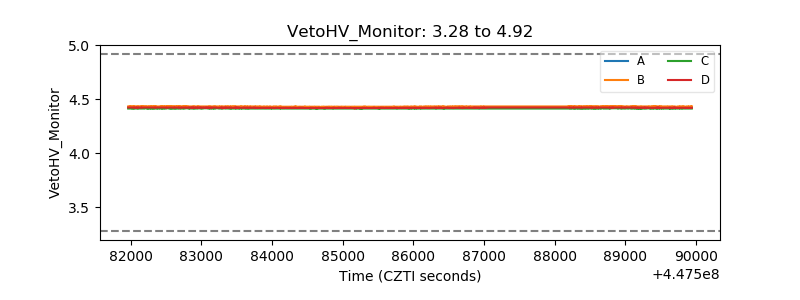 |
| Veto LLD | 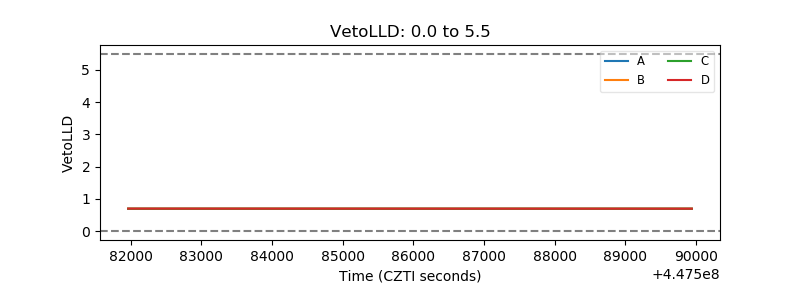 |
| Alpha Counter | 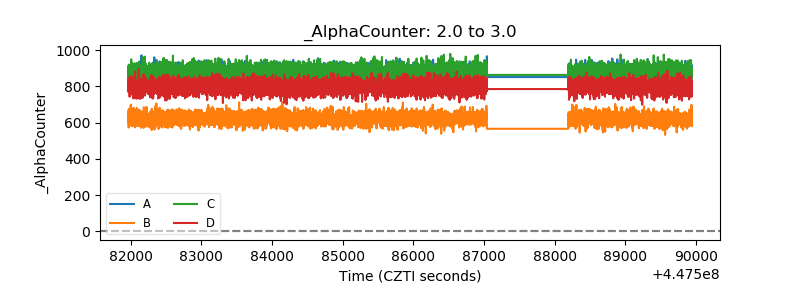 |
| _CPM_Rate | 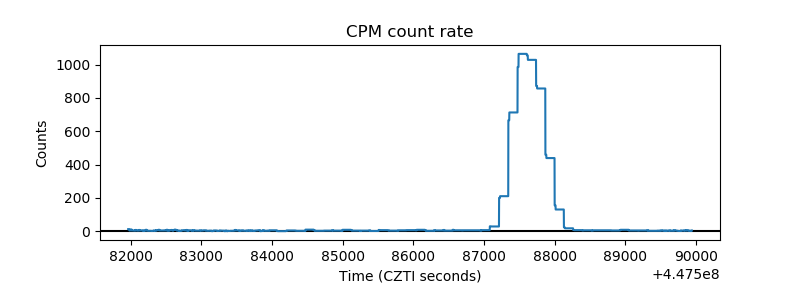 |
| CZT Counter | 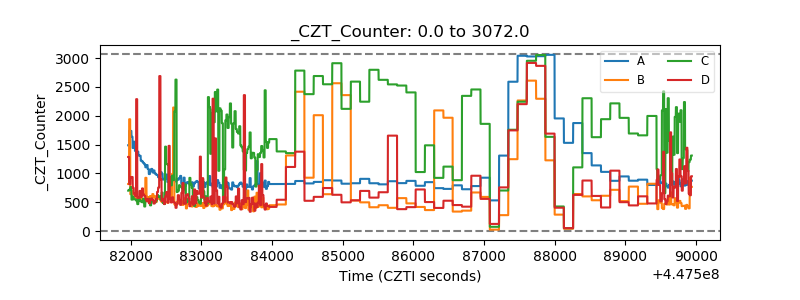 |
| +2.5 Volts monitor | 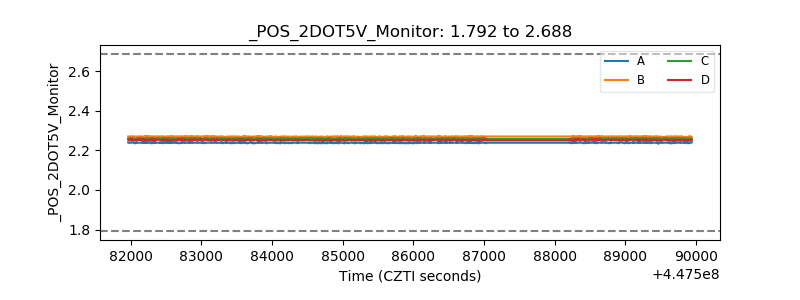 |
| +5 Volts monitor | 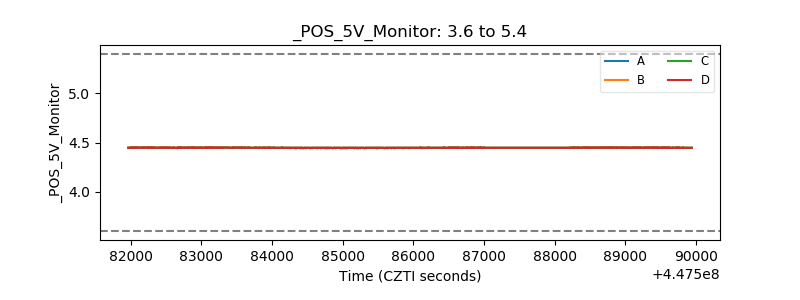 |
| _ROLL_ROT | 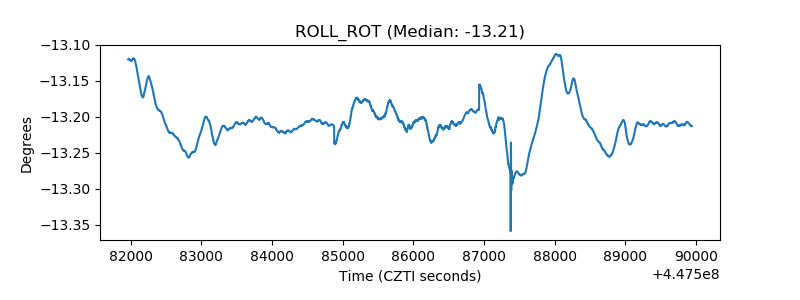 |
| _Roll_DEC | 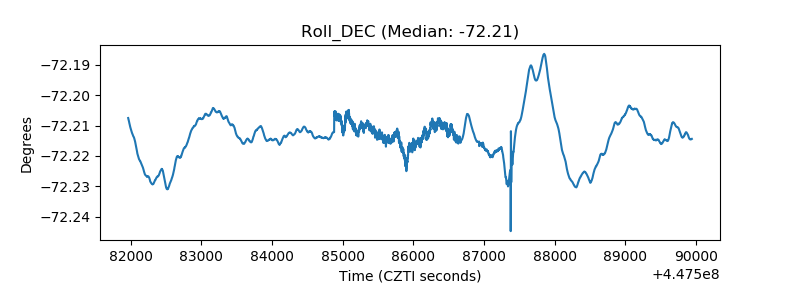 |
| _Roll_RA | 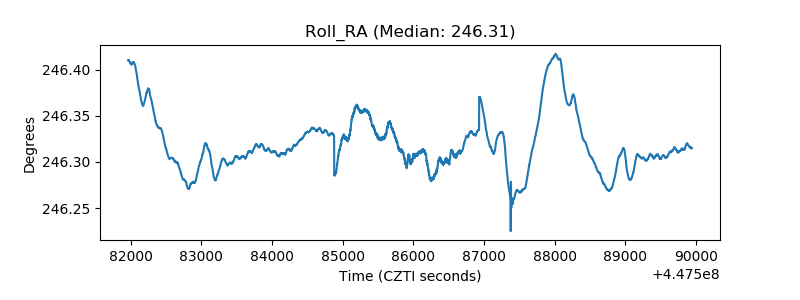 |
| Veto Counter | 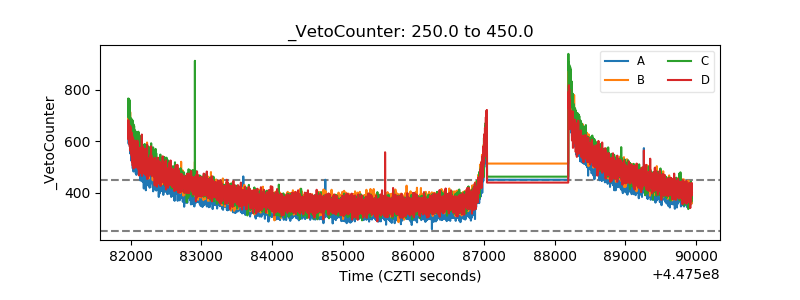 |