| Param | Original file | Final file |
|---|---|---|
| Filename | modeM0/AS1A13_071T07_9000006116_45662cztM0_level2.fits | modeM0/AS1A13_071T07_9000006116_45662cztM0_level2_quad_clean.evt |
| Size (bytes) | 553,639,680 | 101,165,760 |
| Size | 528.0 MB | 96.5 MB |
| Events in quadrant A | 5,275,722 | 707,750 |
| Events in quadrant B | 3,278,689 | 727,742 |
| Events in quadrant C | 7,351,632 | 585,762 |
| Events in quadrant D | 4,131,099 | 630,045 |
| Mode M9 | |||
|---|---|---|---|
| Quadrant | BADHDUFLAG | Total packets | Discarded packets |
| A | 0 | 12 | 0 |
| B | 0 | 12 | 0 |
| C | 0 | 12 | 0 |
| D | 0 | 12 | 0 |
| Mode M0 | |||
|---|---|---|---|
| Quadrant | BADHDUFLAG | Total packets | Discarded packets |
| A | 0 | 19064 | 1 |
| B | 0 | 13410 | 1 |
| C | 0 | 25790 | 1 |
| D | 0 | 16291 | 1 |
| Mode SS | |||
|---|---|---|---|
| Quadrant | BADHDUFLAG | Total packets | Discarded packets |
| A | 0 | 120 | 0 |
| B | 0 | 120 | 0 |
| C | 0 | 120 | 0 |
| D | 0 | 120 | 0 |
| Quadrant | Total seconds | Saturated seconds | Saturation percentage |
|---|---|---|---|
| A | 5895 | 193 | 3.273961% |
| B | 5896 | 167 | 2.832429% |
| C | 5896 | 1260 | 21.370421% |
| D | 5895 | 231 | 3.918575% |
Noise dominated data is calculated using 1-second bins in cleaned event files. If a bin has >2000 counts, and if more than 50% of those come from <1% of pixels, then it is considered to be noise-dominated and hence unusable.
| Quadrant | # 1 sec bins | Bins with >0 counts | Bins with >2000 counts | High rate bins dominated by noise | Noise dominated (total time) | Noise dominated (detector-on time) | Marked lightcurve |
|---|---|---|---|---|---|---|---|
| A | 7095 | 5895 | 10 | 10 | 0.14% | 0.17% | 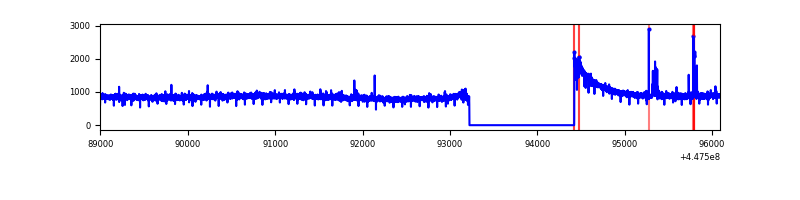 |
| B | 7096 | 5897 | 75 | 75 | 1.06% | 1.27% | 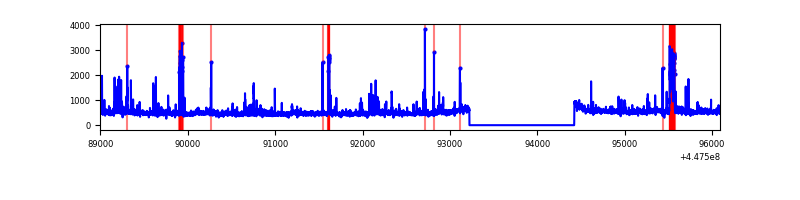 |
| C | 7096 | 5897 | 1377 | 1377 | 19.41% | 23.35% | 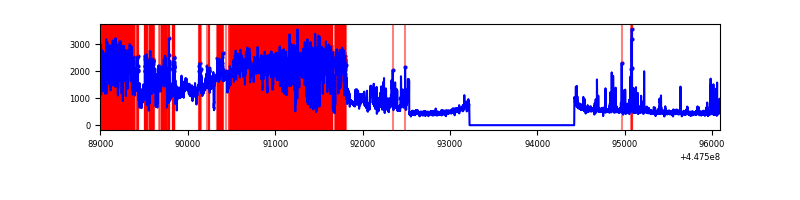 |
| D | 7095 | 5896 | 159 | 159 | 2.24% | 2.70% | 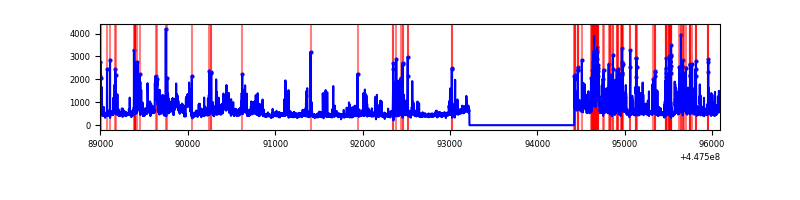 |
Top three noisy pixels from each quadrant. If the there are fewer than three noisy pixels in the level2.evt file, extra rows are filled as -1
| Pixel properties | Quadrant properties | ||||||
|---|---|---|---|---|---|---|---|
| Quadrant | DetID | PixID | Counts | Sigma | Mean | Median | Sigma |
| A | 10 | 83 | 2529064 | 17703.41 | 693 | 679 | 142.8 |
| A | 10 | 248 | 28161 | 192.43 | 693 | 679 | 142.8 |
| A | 13 | 248 | 25795 | 175.86 | 693 | 679 | 142.8 |
| B | 5 | 32 | 130586 | 992.7 | 686 | 666 | 130.9 |
| B | 5 | 172 | 84589 | 641.25 | 686 | 666 | 130.9 |
| B | 3 | 112 | 83374 | 631.96 | 686 | 666 | 130.9 |
| C | 9 | 54 | 4640199 | 30838.12 | 649 | 651 | 150.4 |
| C | 2 | 14 | 93294 | 615.78 | 649 | 651 | 150.4 |
| C | 0 | 64 | 36082 | 235.5 | 649 | 651 | 150.4 |
| D | 13 | 249 | 596485 | 3549.96 | 677 | 656 | 167.8 |
| D | 1 | 52 | 477422 | 2840.58 | 677 | 656 | 167.8 |
| D | 5 | 222 | 221822 | 1317.71 | 677 | 656 | 167.8 |
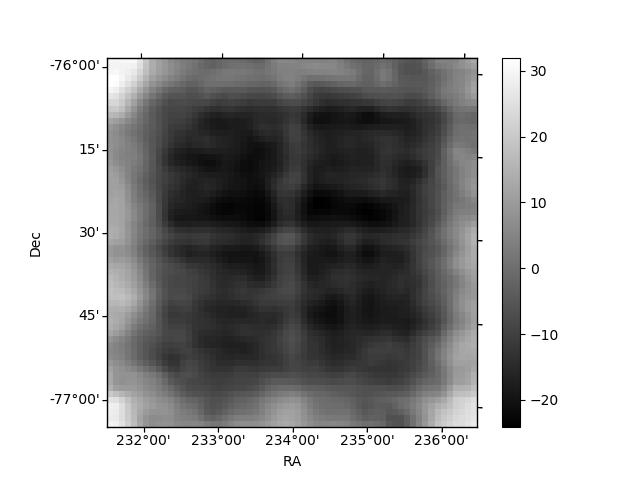
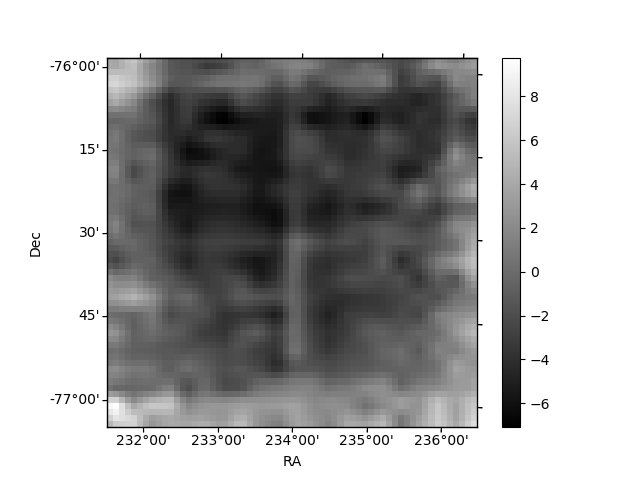
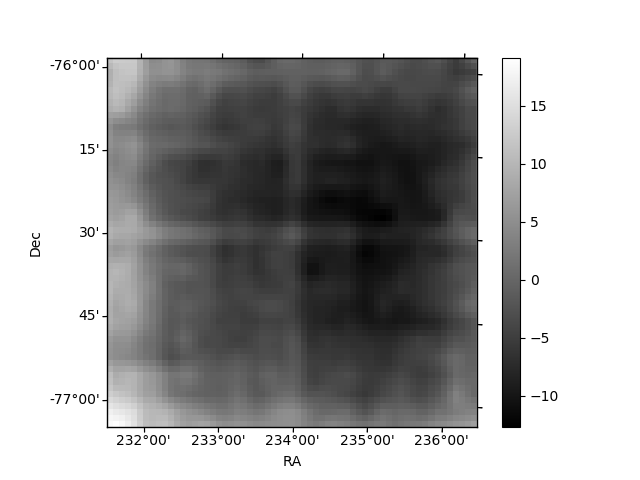
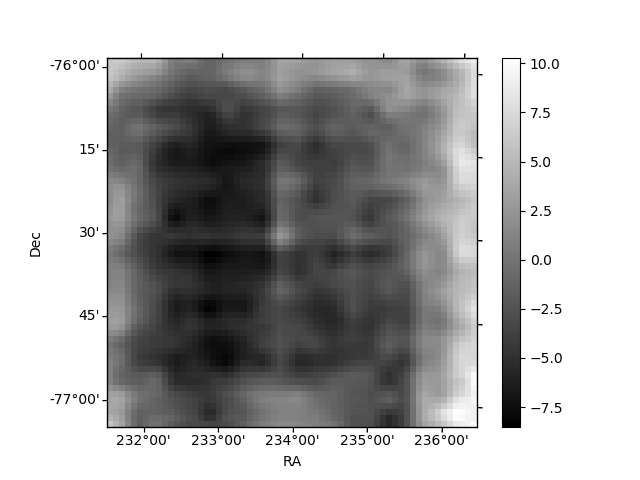
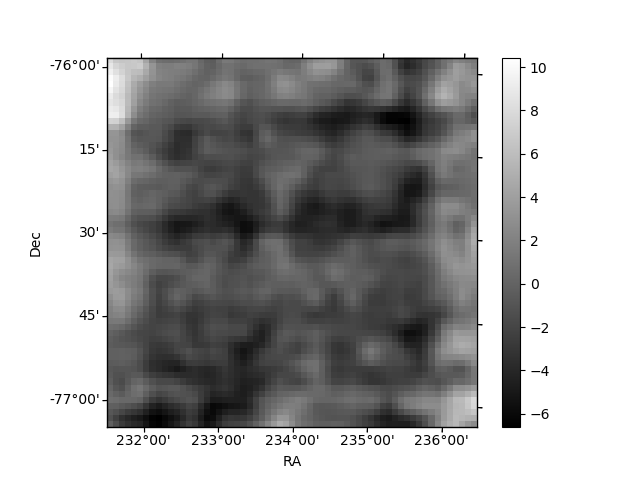
Histogram calculated using DETX and DETY for each event in the final _common_clean file
| Quadrant A | 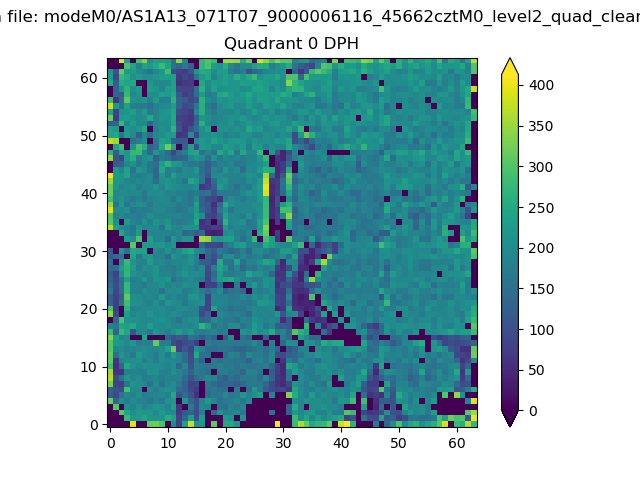 |
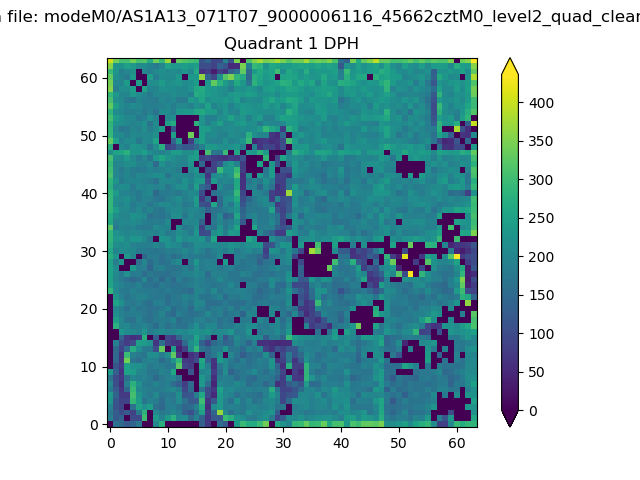 |
Quadrant B |
|---|---|---|---|
| Quadrant D | 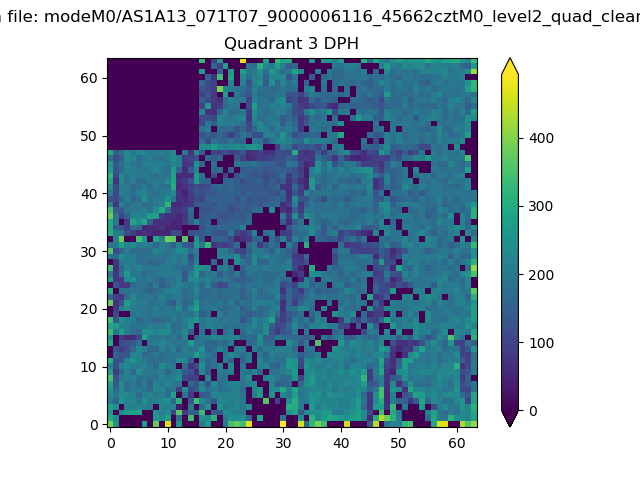 |
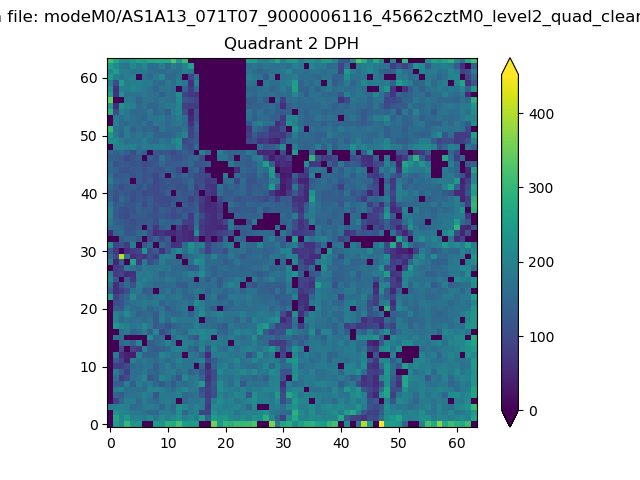 |
Quadrant C |
| Plot type | Count rate plots | Images |
|---|---|---|
| Comparison with Poisson distribution Blue bars denote a histogram of data divided into 1 sec bins. Red curve is a Poisson curve with rate = median count rate of data. |
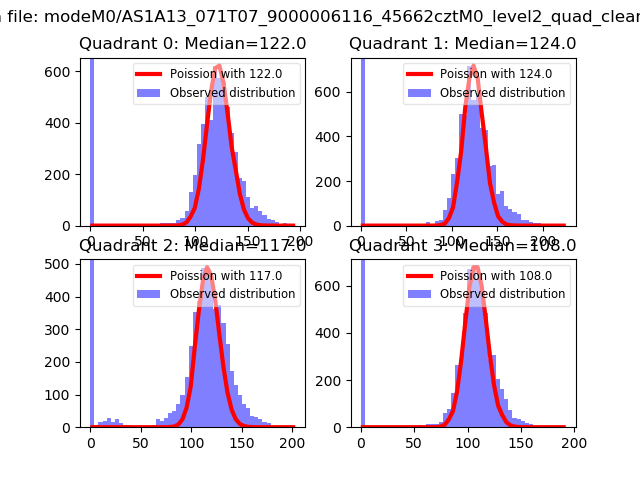 |
 |
| Quadrant-wise count rates Data is divided into 100 sec bins |
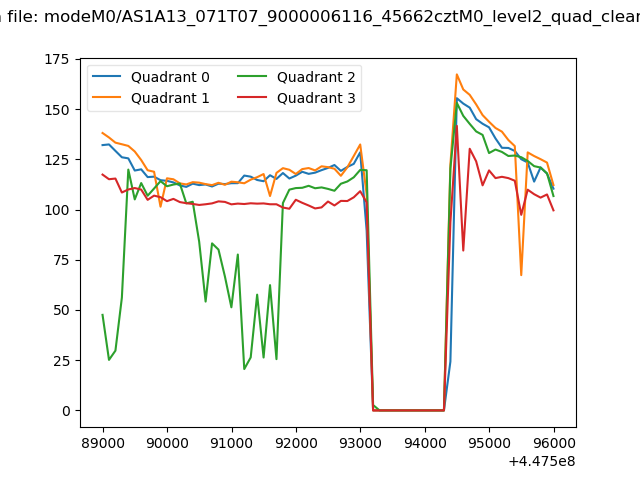 |
|
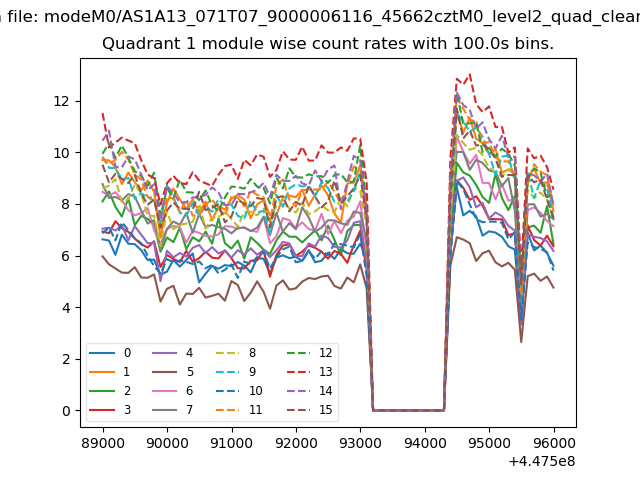
| Module-wise count rates for Quadrant A Data is divided into 100 sec bins |
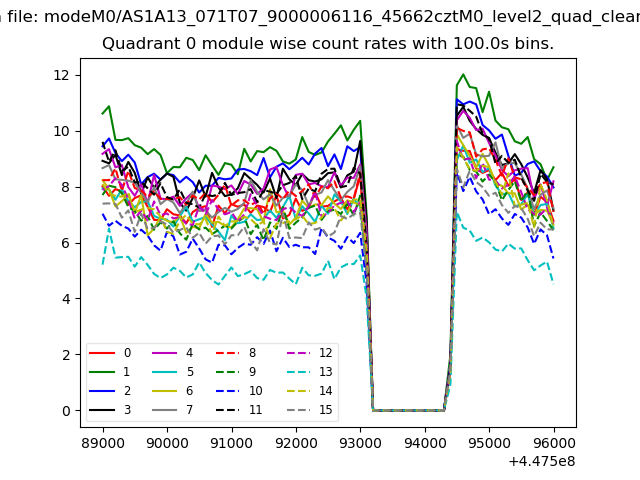 |
 |
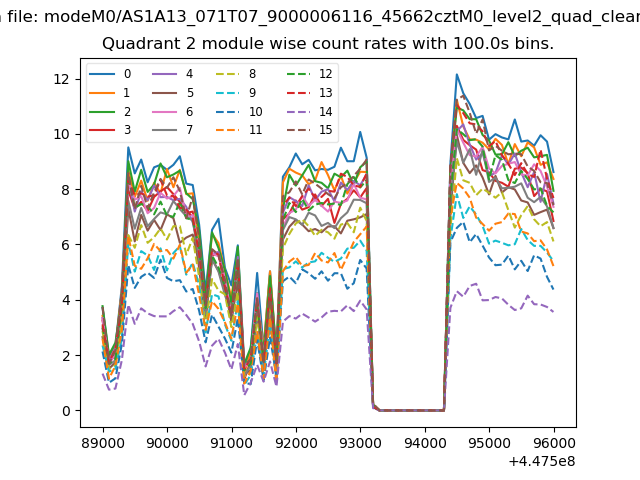
| Module-wise count rates for Quadrant B Data is divided into 100 sec bins |
 |
 |
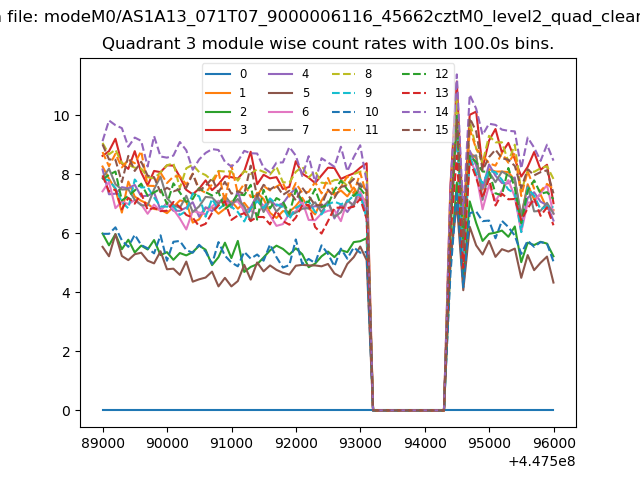
| Module-wise count rates for Quadrant C Data is divided into 100 sec bins |
 |
 |
| Module-wise count rates for Quadrant D Data is divided into 100 sec bins |
 |
 |
| Parameter | Plot |
|---|---|
| CZT HV Monitor | 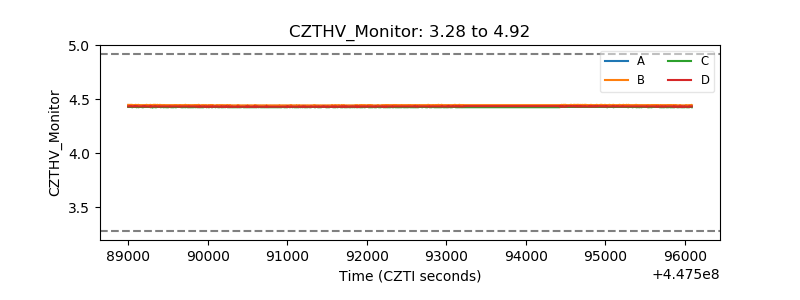 |
| D_VDD | 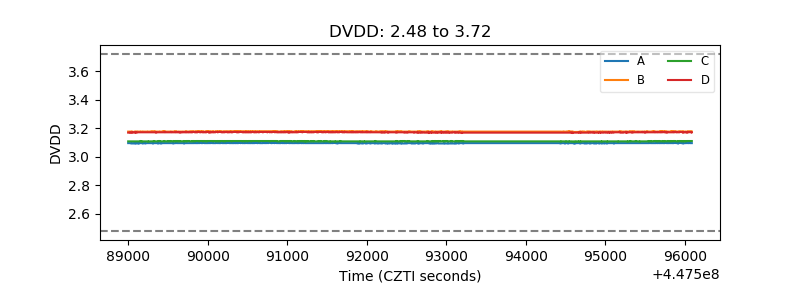 |
| Temperature 1 | 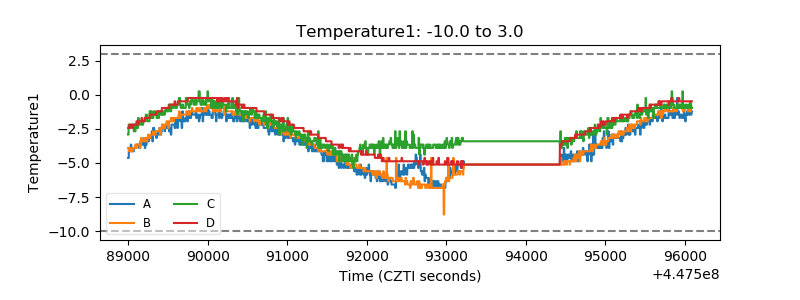 |
| Veto HV Monitor | 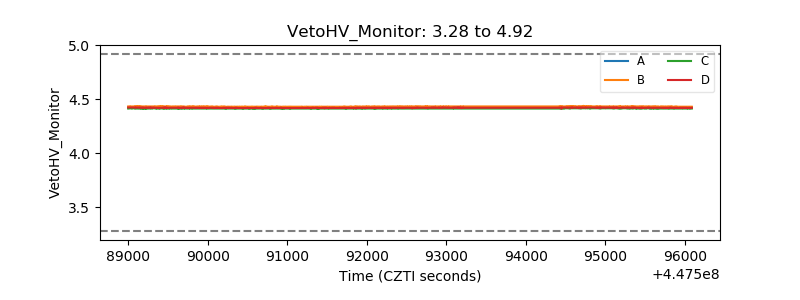 |
| Veto LLD | 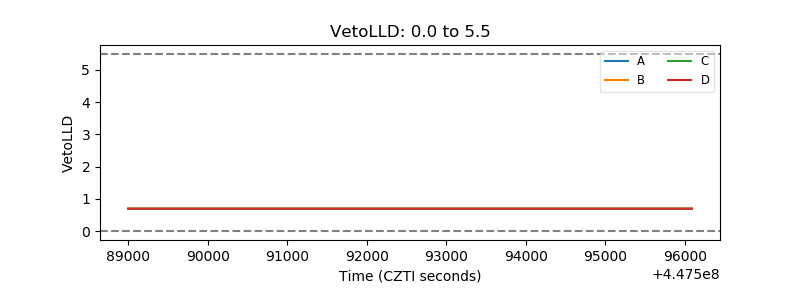 |
| Alpha Counter | 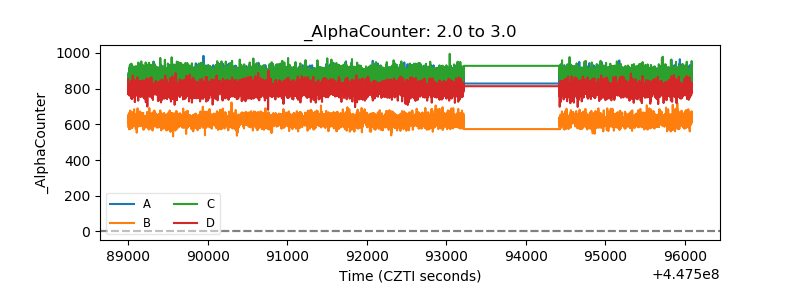 |
| _CPM_Rate | 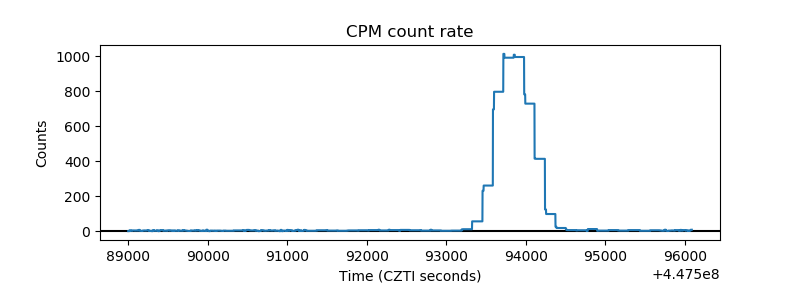 |
| CZT Counter | 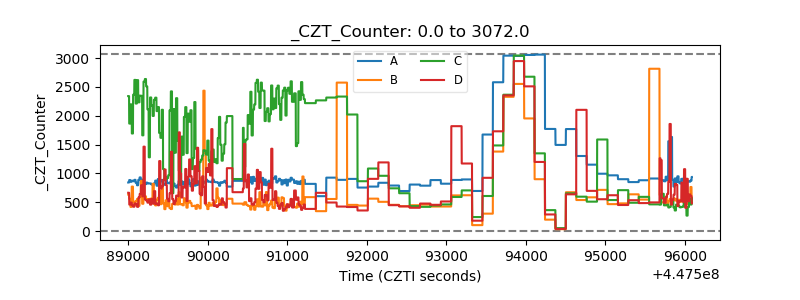 |
| +2.5 Volts monitor | 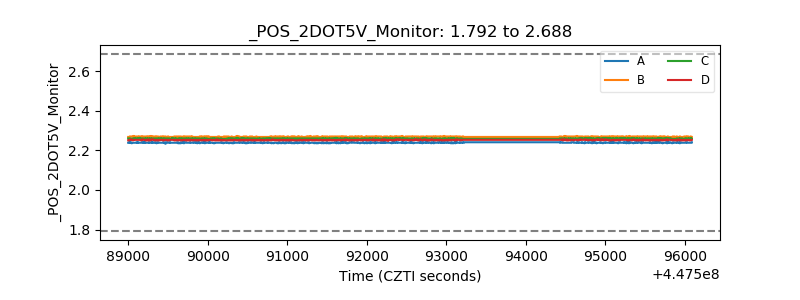 |
| +5 Volts monitor | 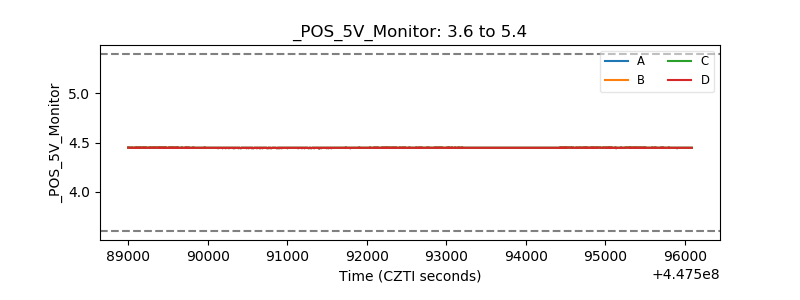 |
| _ROLL_ROT | 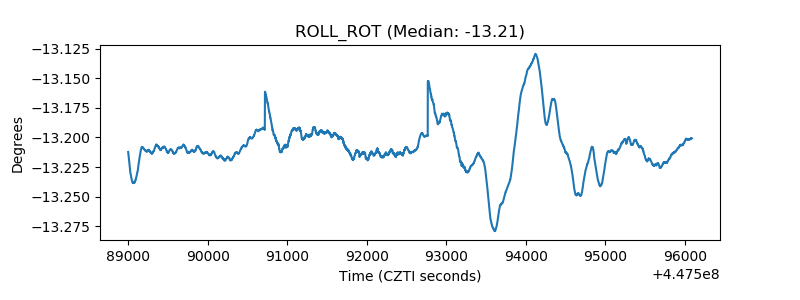 |
| _Roll_DEC | 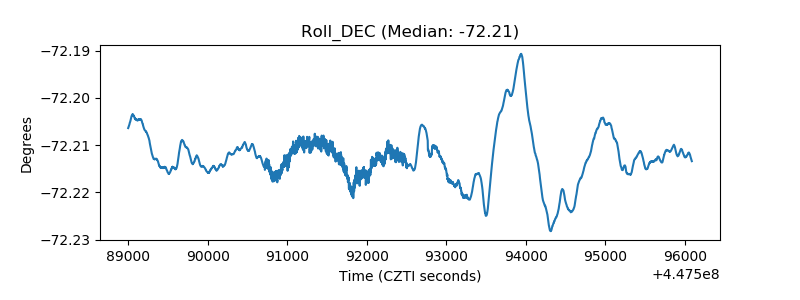 |
| _Roll_RA | 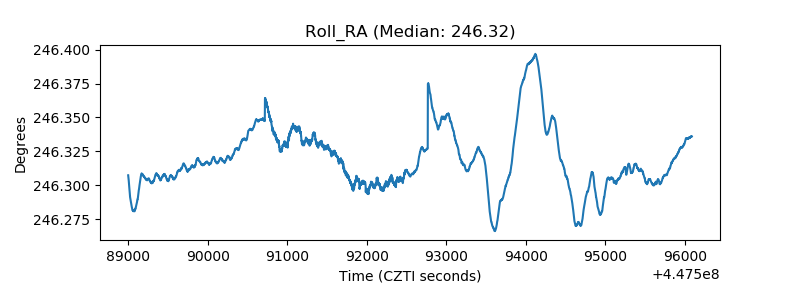 |
| Veto Counter | 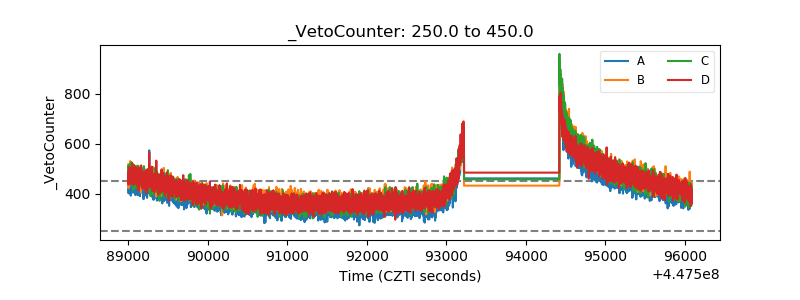 |