| Param | Original file | Final file |
|---|---|---|
| Filename | modeM0/AS1A13_071T07_9000006116_45663cztM0_level2.fits | modeM0/AS1A13_071T07_9000006116_45663cztM0_level2_quad_clean.evt |
| Size (bytes) | 479,174,400 | 110,404,800 |
| Size | 457.0 MB | 105.3 MB |
| Events in quadrant A | 5,635,991 | 744,883 |
| Events in quadrant B | 3,593,447 | 762,420 |
| Events in quadrant C | 3,548,534 | 737,753 |
| Events in quadrant D | 4,473,944 | 661,718 |
| Mode M9 | |||
|---|---|---|---|
| Quadrant | BADHDUFLAG | Total packets | Discarded packets |
| A | 0 | 12 | 0 |
| B | 0 | 12 | 0 |
| C | 0 | 12 | 0 |
| D | 0 | 12 | 0 |
| Mode M0 | |||
|---|---|---|---|
| Quadrant | BADHDUFLAG | Total packets | Discarded packets |
| A | 0 | 20440 | 3 |
| B | 0 | 14580 | 1 |
| C | 0 | 14879 | 1 |
| D | 0 | 17460 | 1 |
| Mode SS | |||
|---|---|---|---|
| Quadrant | BADHDUFLAG | Total packets | Discarded packets |
| A | 0 | 126 | 0 |
| B | 0 | 126 | 0 |
| C | 0 | 126 | 0 |
| D | 0 | 126 | 0 |
| Quadrant | Total seconds | Saturated seconds | Saturation percentage |
|---|---|---|---|
| A | 6255 | 241 | 3.852918% |
| B | 6256 | 232 | 3.708440% |
| C | 6256 | 162 | 2.589514% |
| D | 6256 | 340 | 5.434783% |
Noise dominated data is calculated using 1-second bins in cleaned event files. If a bin has >2000 counts, and if more than 50% of those come from <1% of pixels, then it is considered to be noise-dominated and hence unusable.
| Quadrant | # 1 sec bins | Bins with >0 counts | Bins with >2000 counts | High rate bins dominated by noise | Noise dominated (total time) | Noise dominated (detector-on time) | Marked lightcurve |
|---|---|---|---|---|---|---|---|
| A | 7420 | 6255 | 16 | 16 | 0.22% | 0.26% | 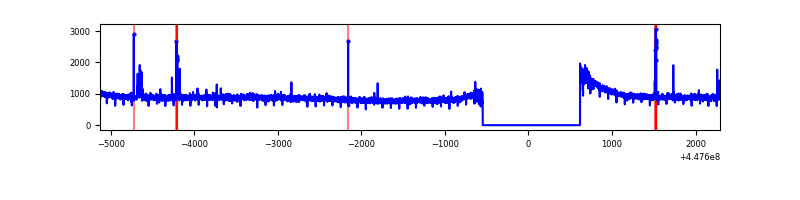 |
| B | 7421 | 6256 | 88 | 88 | 1.19% | 1.41% | 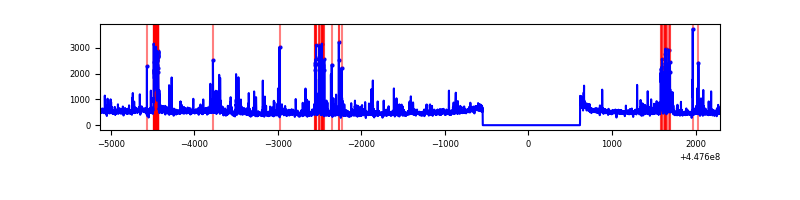 |
| C | 7421 | 6257 | 90 | 90 | 1.21% | 1.44% | 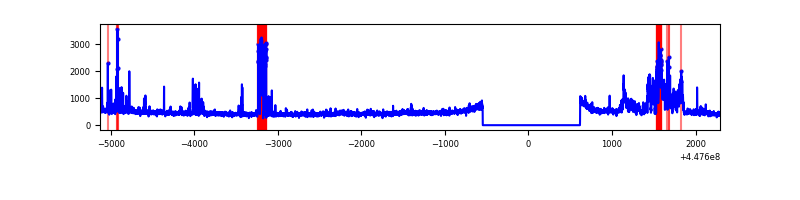 |
| D | 7421 | 6256 | 215 | 215 | 2.90% | 3.44% | 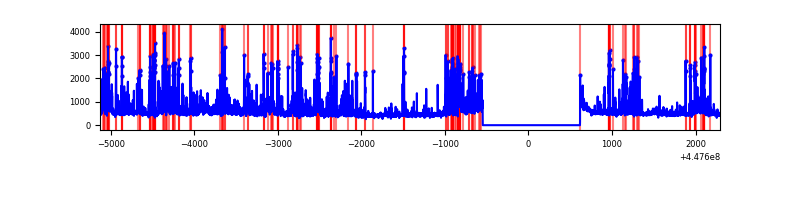 |
Top three noisy pixels from each quadrant. If the there are fewer than three noisy pixels in the level2.evt file, extra rows are filled as -1
| Pixel properties | Quadrant properties | ||||||
|---|---|---|---|---|---|---|---|
| Quadrant | DetID | PixID | Counts | Sigma | Mean | Median | Sigma |
| A | 10 | 83 | 2695680 | 17844.13 | 736 | 724 | 151.0 |
| A | 10 | 248 | 27115 | 174.74 | 736 | 724 | 151.0 |
| A | 13 | 248 | 26118 | 168.14 | 736 | 724 | 151.0 |
| B | 12 | 16 | 150854 | 1077.46 | 731 | 712 | 139.3 |
| B | 5 | 32 | 129575 | 924.75 | 731 | 712 | 139.3 |
| B | 5 | 172 | 121688 | 868.16 | 731 | 712 | 139.3 |
| C | 0 | 64 | 435588 | 2631.5 | 719 | 723 | 165.3 |
| C | 14 | 254 | 170674 | 1028.43 | 719 | 723 | 165.3 |
| C | 2 | 14 | 80907 | 485.22 | 719 | 723 | 165.3 |
| D | 13 | 249 | 507975 | 2819.54 | 715 | 692 | 179.9 |
| D | 1 | 52 | 477915 | 2652.47 | 715 | 692 | 179.9 |
| D | 12 | 1 | 153204 | 847.68 | 715 | 692 | 179.9 |
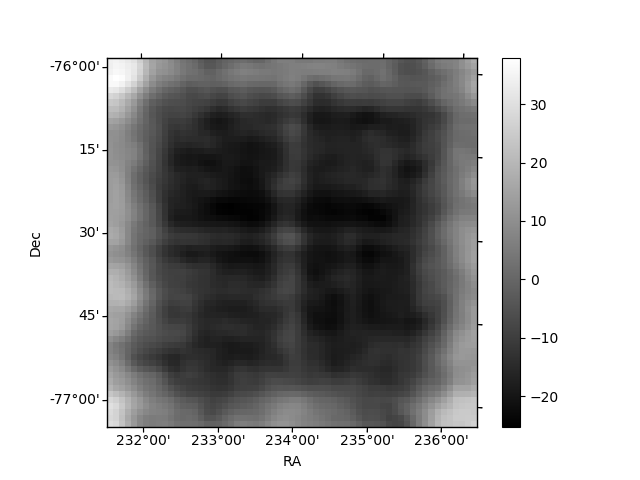
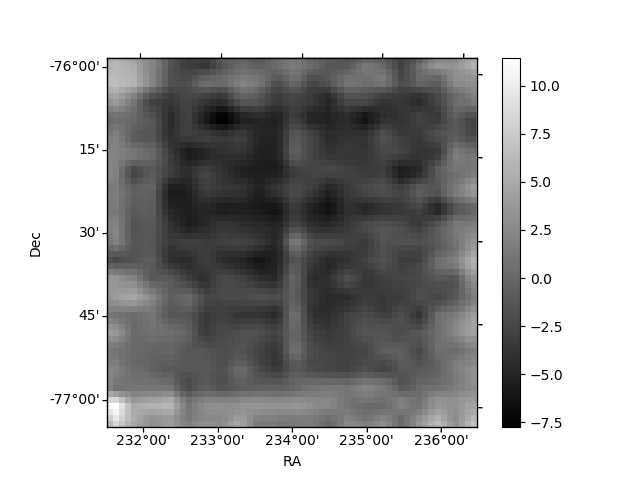
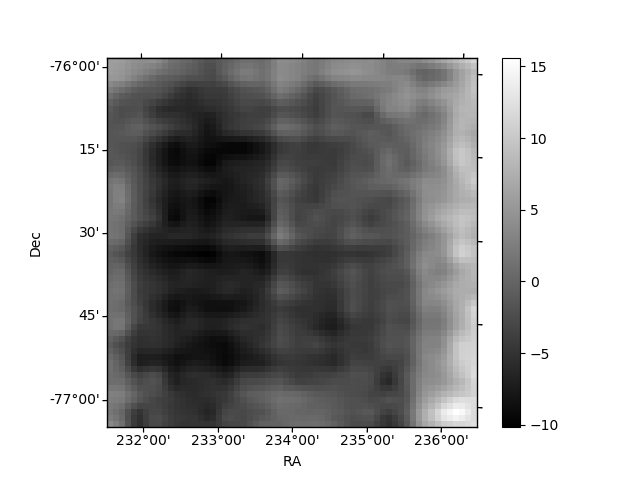
Histogram calculated using DETX and DETY for each event in the final _common_clean file
| Quadrant A | 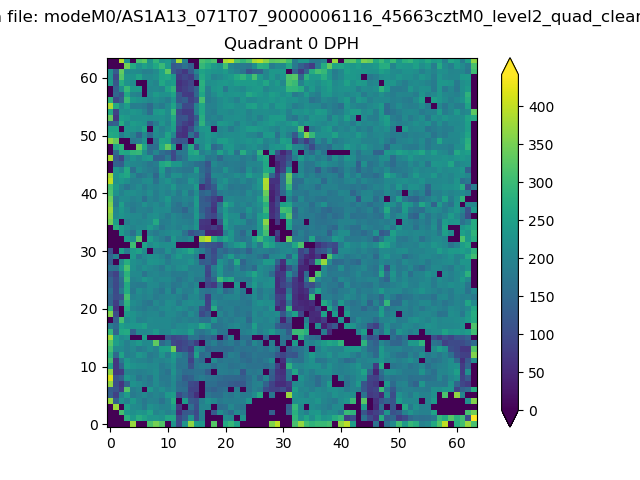 |
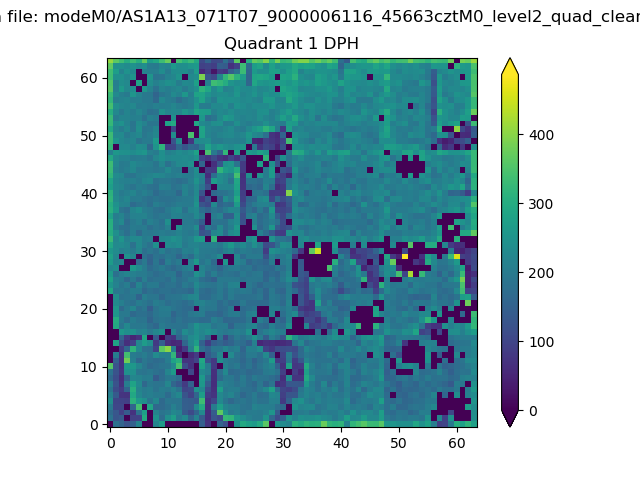 |
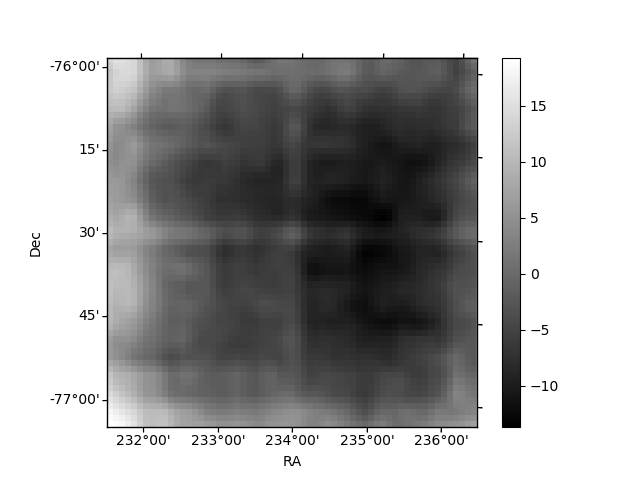
Quadrant B |
|---|---|---|---|
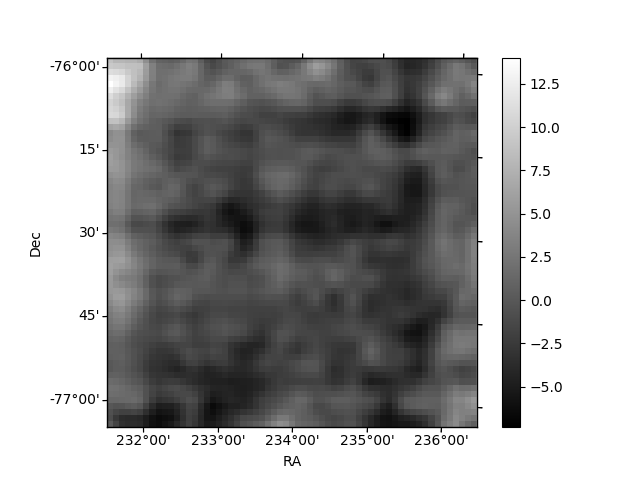
| Quadrant D | 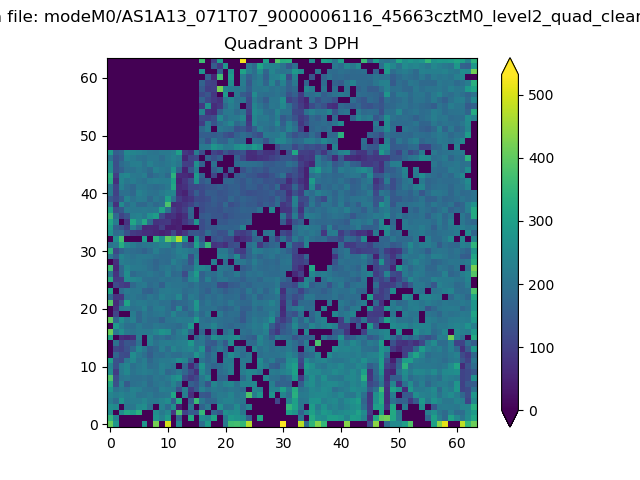 |
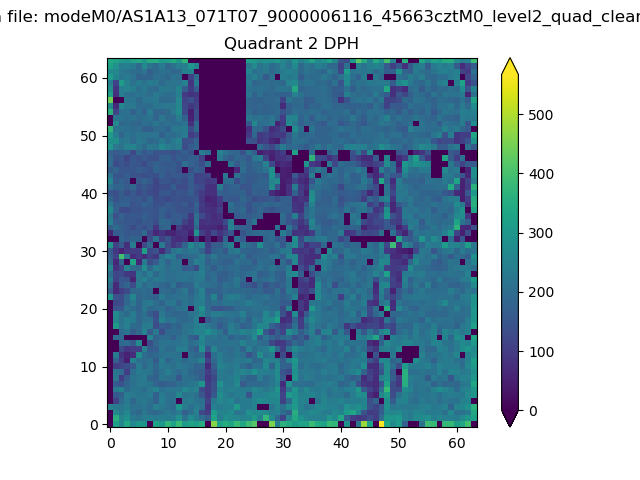 |
Quadrant C |
| Plot type | Count rate plots | Images |
|---|---|---|
| Comparison with Poisson distribution Blue bars denote a histogram of data divided into 1 sec bins. Red curve is a Poisson curve with rate = median count rate of data. |
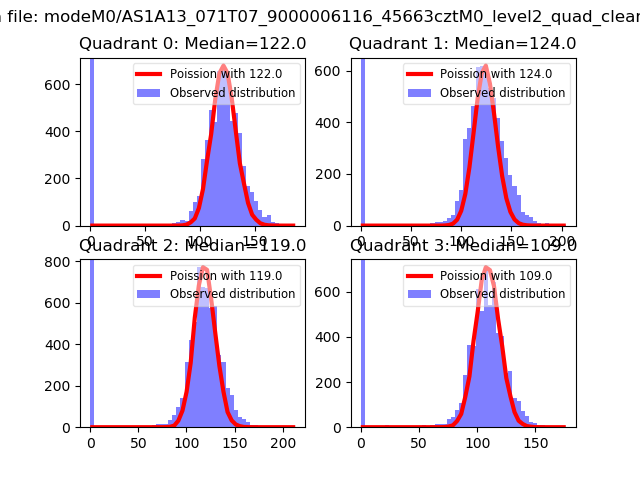 |
 |
| Quadrant-wise count rates Data is divided into 100 sec bins |
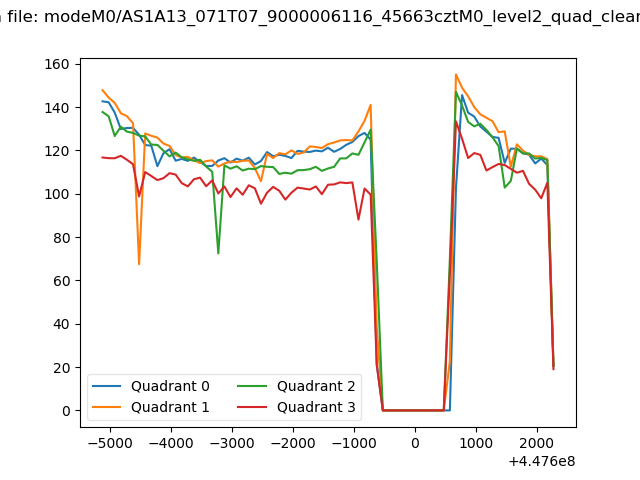 |
|
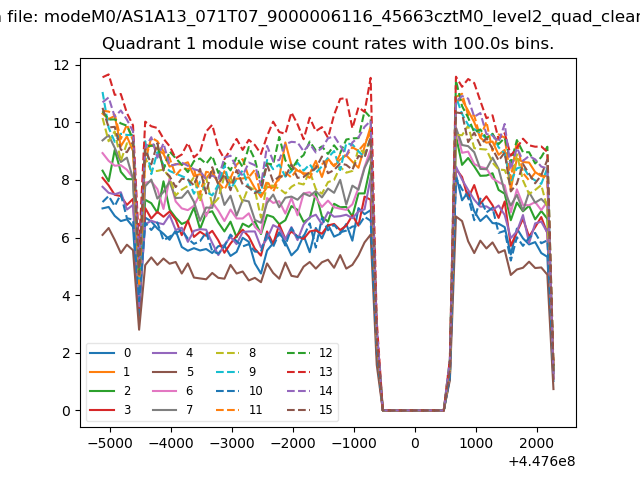
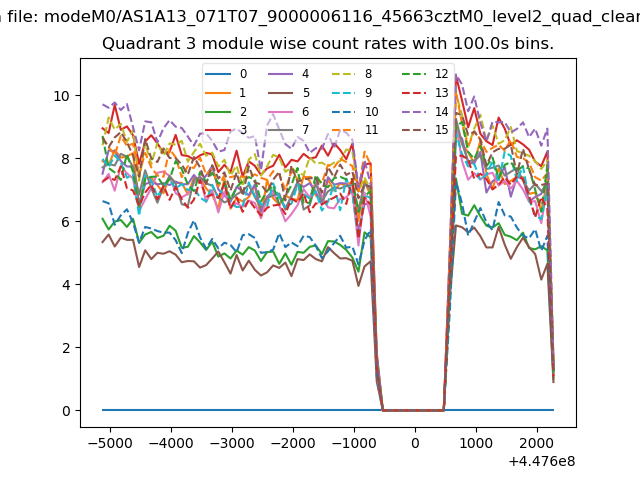
| Module-wise count rates for Quadrant A Data is divided into 100 sec bins |
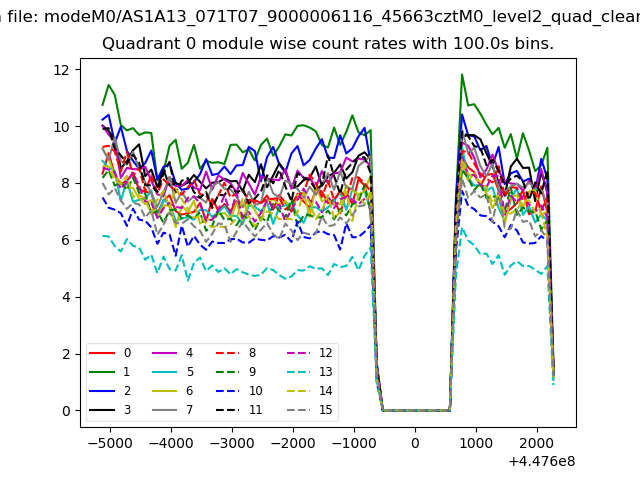 |
 |
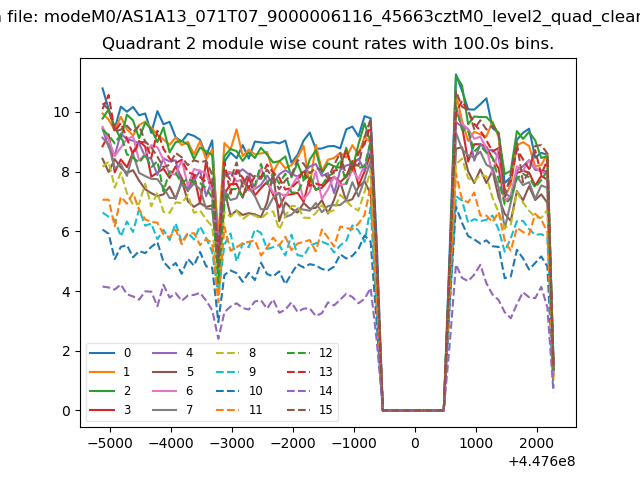
| Module-wise count rates for Quadrant B Data is divided into 100 sec bins |
 |
 |
| Module-wise count rates for Quadrant C Data is divided into 100 sec bins |
 |
 |
| Module-wise count rates for Quadrant D Data is divided into 100 sec bins |
 |
 |
| Parameter | Plot |
|---|---|
| CZT HV Monitor | 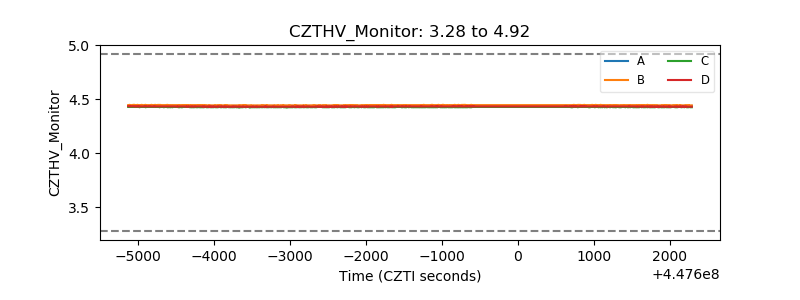 |
| D_VDD | 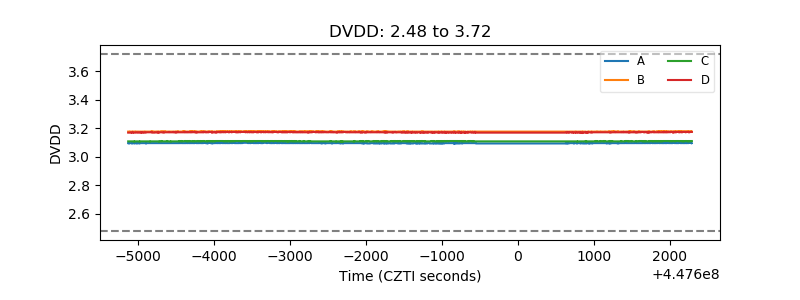 |
| Temperature 1 | 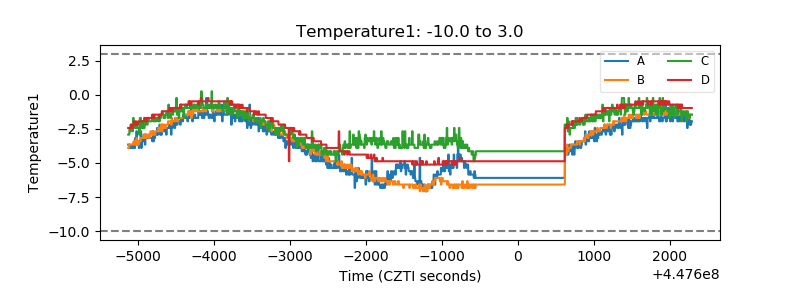 |
| Veto HV Monitor | 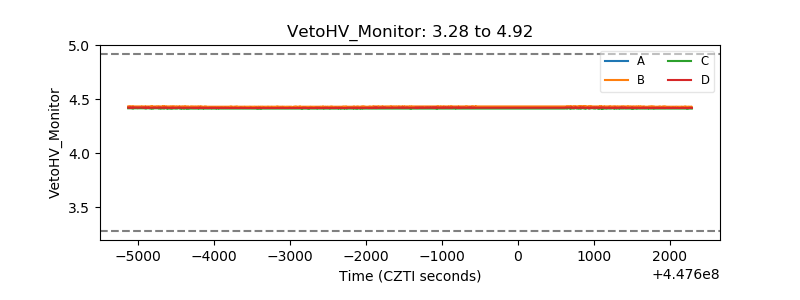 |
| Veto LLD | 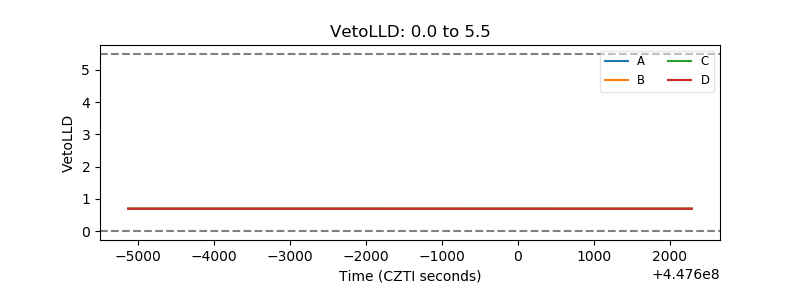 |
| Alpha Counter | 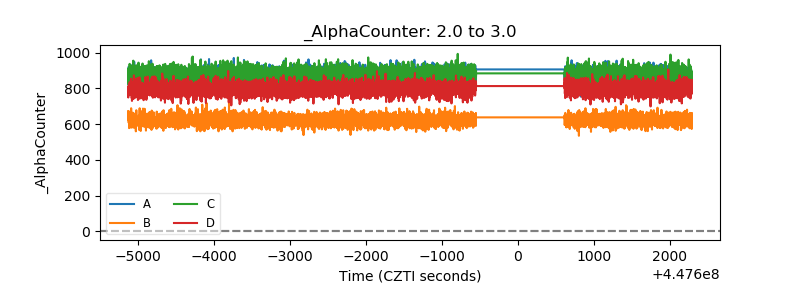 |
| _CPM_Rate | 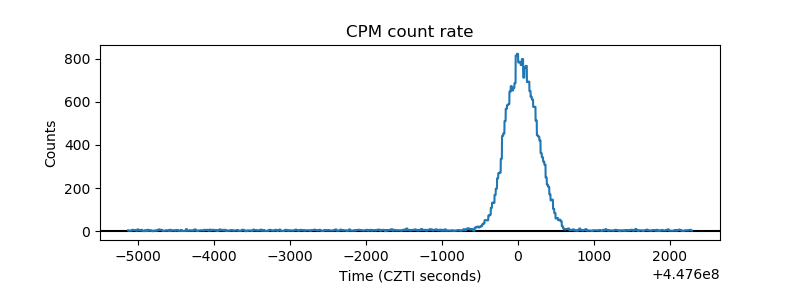 |
| CZT Counter | 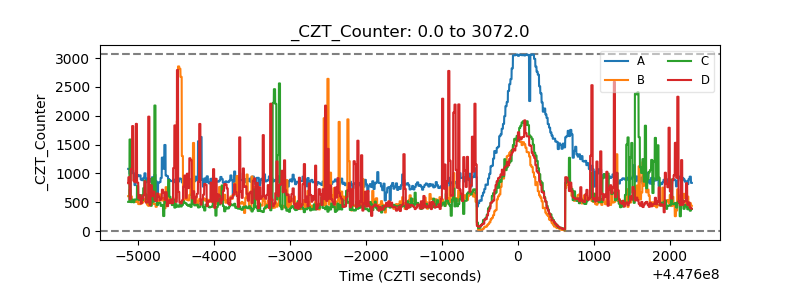 |
| +2.5 Volts monitor | 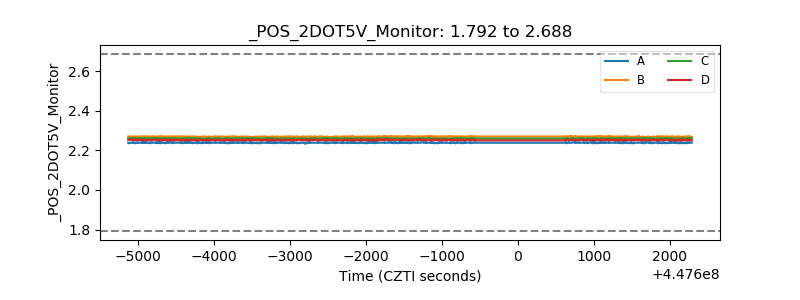 |
| +5 Volts monitor | 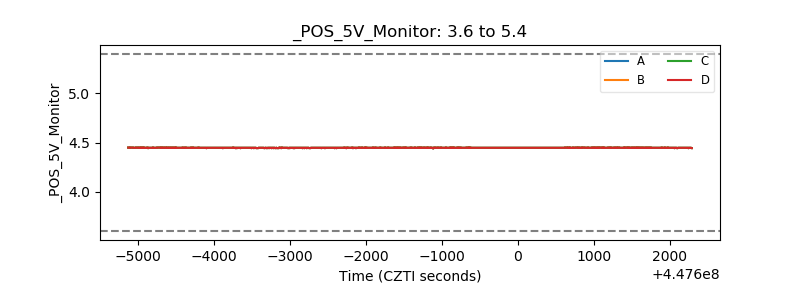 |
| _ROLL_ROT | 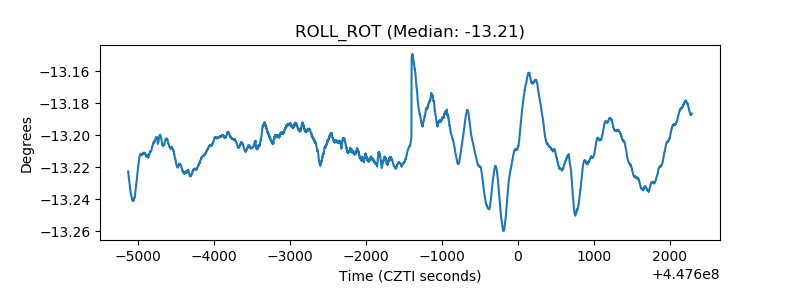 |
| _Roll_DEC | 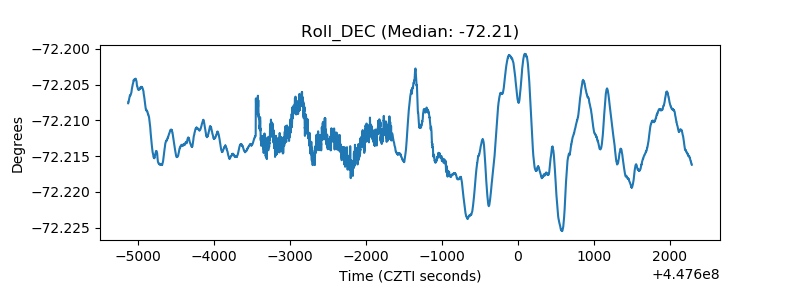 |
| _Roll_RA | 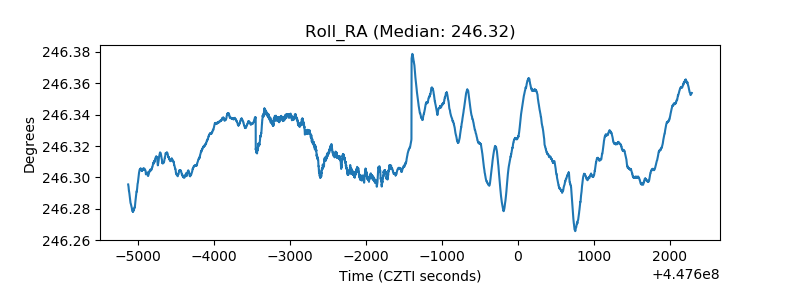 |
| Veto Counter | 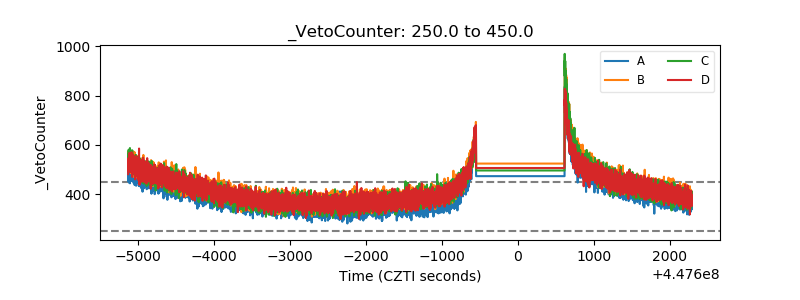 |