| Param | Original file | Final file |
|---|---|---|
| Filename | modeM0/AS1A13_071T07_9000006116_45664cztM0_level2.fits | modeM0/AS1A13_071T07_9000006116_45664cztM0_level2_quad_clean.evt |
| Size (bytes) | 485,496,000 | 111,113,280 |
| Size | 463.0 MB | 106.0 MB |
| Events in quadrant A | 5,835,498 | 744,361 |
| Events in quadrant B | 3,833,899 | 753,845 |
| Events in quadrant C | 3,972,789 | 740,566 |
| Events in quadrant D | 3,822,531 | 669,946 |
| Mode M9 | |||
|---|---|---|---|
| Quadrant | BADHDUFLAG | Total packets | Discarded packets |
| A | 0 | 10 | 0 |
| B | 0 | 10 | 0 |
| C | 0 | 10 | 0 |
| D | 0 | 10 | 0 |
| Mode M0 | |||
|---|---|---|---|
| Quadrant | BADHDUFLAG | Total packets | Discarded packets |
| A | 0 | 21349 | 1 |
| B | 0 | 15608 | 1 |
| C | 0 | 16332 | 2 |
| D | 0 | 15735 | 1 |
| Mode SS | |||
|---|---|---|---|
| Quadrant | BADHDUFLAG | Total packets | Discarded packets |
| A | 0 | 134 | 0 |
| B | 0 | 134 | 0 |
| C | 0 | 134 | 0 |
| D | 0 | 134 | 0 |
| Quadrant | Total seconds | Saturated seconds | Saturation percentage |
|---|---|---|---|
| A | 6531 | 261 | 3.996325% |
| B | 6531 | 357 | 5.466238% |
| C | 6531 | 180 | 2.756086% |
| D | 6531 | 220 | 3.368550% |
Noise dominated data is calculated using 1-second bins in cleaned event files. If a bin has >2000 counts, and if more than 50% of those come from <1% of pixels, then it is considered to be noise-dominated and hence unusable.
| Quadrant | # 1 sec bins | Bins with >0 counts | Bins with >2000 counts | High rate bins dominated by noise | Noise dominated (total time) | Noise dominated (detector-on time) | Marked lightcurve |
|---|---|---|---|---|---|---|---|
| A | 7596 | 6531 | 9 | 9 | 0.12% | 0.14% | 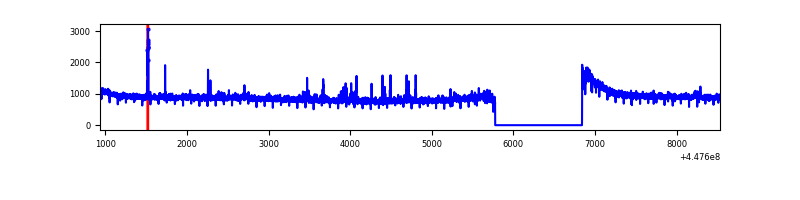 |
| B | 7596 | 6531 | 163 | 163 | 2.15% | 2.50% | 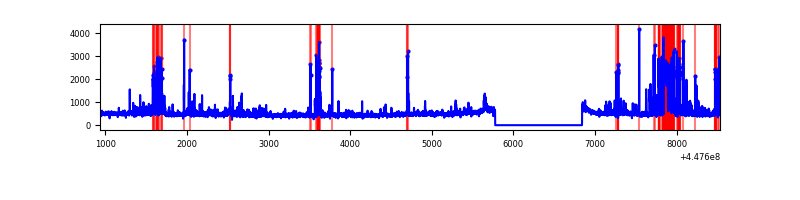 |
| C | 7596 | 6531 | 101 | 101 | 1.33% | 1.55% | 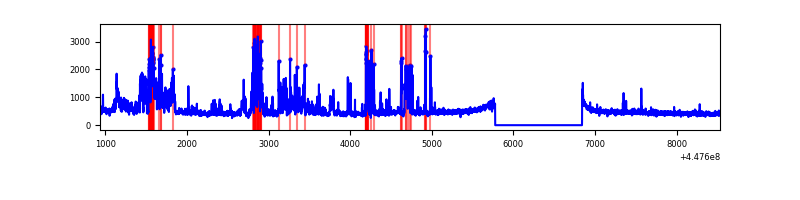 |
| D | 7596 | 6531 | 114 | 114 | 1.50% | 1.75% | 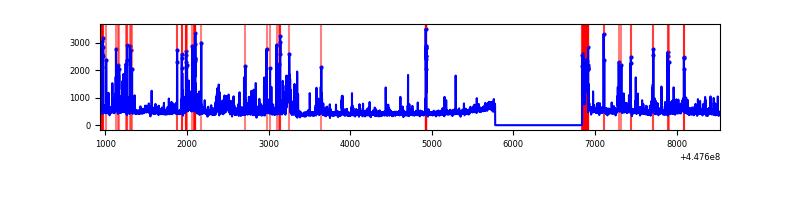 |
Top three noisy pixels from each quadrant. If the there are fewer than three noisy pixels in the level2.evt file, extra rows are filled as -1
| Pixel properties | Quadrant properties | ||||||
|---|---|---|---|---|---|---|---|
| Quadrant | DetID | PixID | Counts | Sigma | Mean | Median | Sigma |
| A | 10 | 83 | 2838696 | 18374.69 | 748 | 732 | 154.4 |
| A | 14 | 235 | 51605 | 329.38 | 748 | 732 | 154.4 |
| A | 15 | 174 | 24755 | 155.54 | 748 | 732 | 154.4 |
| B | 5 | 172 | 606821 | 4296.63 | 740 | 719 | 141.1 |
| B | 4 | 170 | 62668 | 439.15 | 740 | 719 | 141.1 |
| B | 3 | 112 | 51489 | 359.91 | 740 | 719 | 141.1 |
| C | 0 | 64 | 836604 | 4914.56 | 732 | 735 | 170.1 |
| C | 9 | 54 | 202526 | 1186.44 | 732 | 735 | 170.1 |
| C | 14 | 254 | 50829 | 294.53 | 732 | 735 | 170.1 |
| D | 1 | 52 | 394026 | 2188.22 | 727 | 706 | 179.7 |
| D | 13 | 249 | 235618 | 1306.93 | 727 | 706 | 179.7 |
| D | 5 | 171 | 114565 | 633.45 | 727 | 706 | 179.7 |
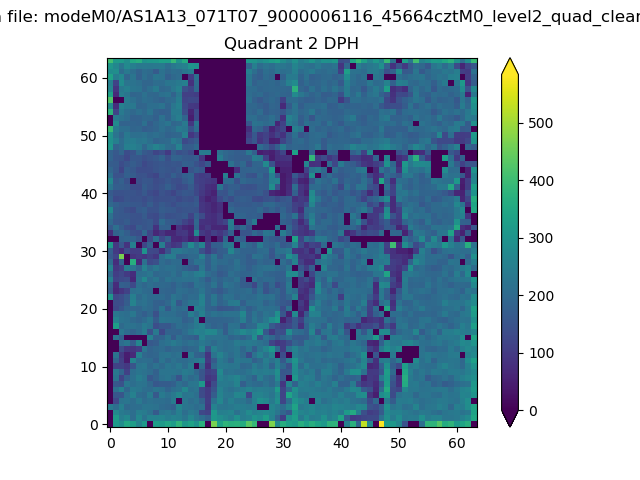
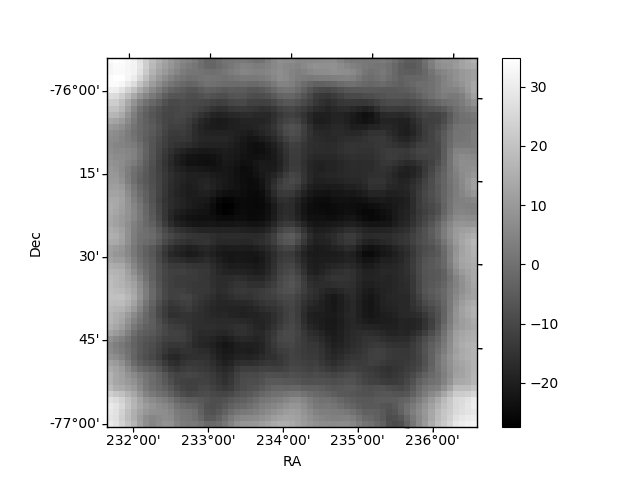
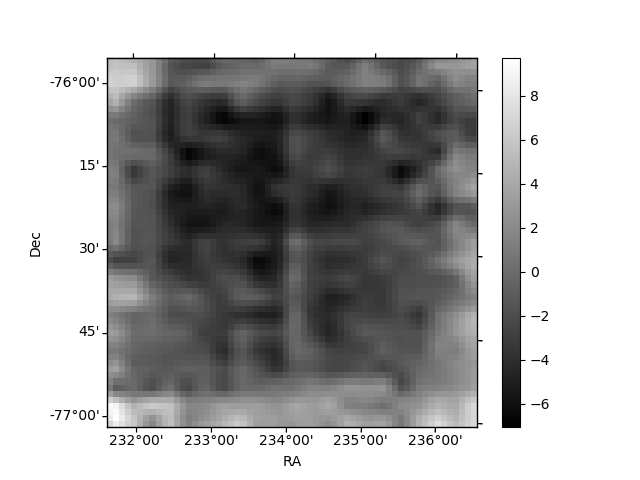
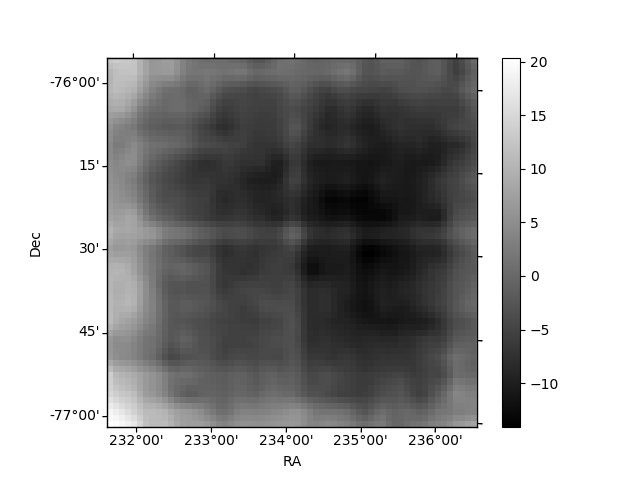
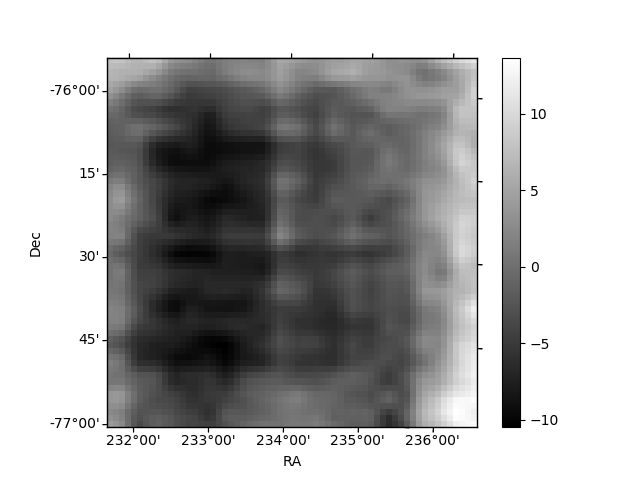
Histogram calculated using DETX and DETY for each event in the final _common_clean file
| Quadrant A | 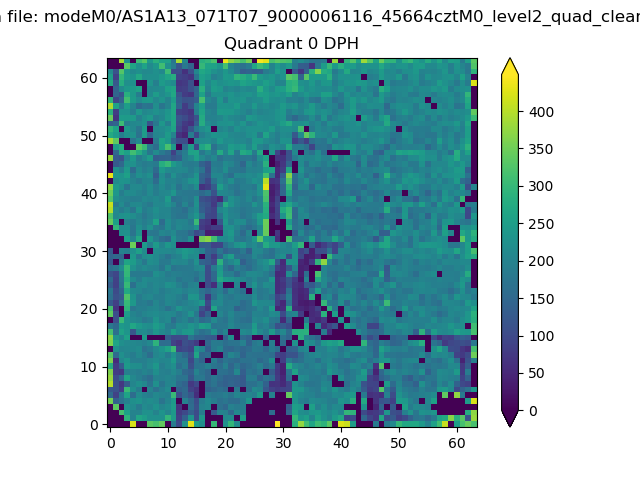 |
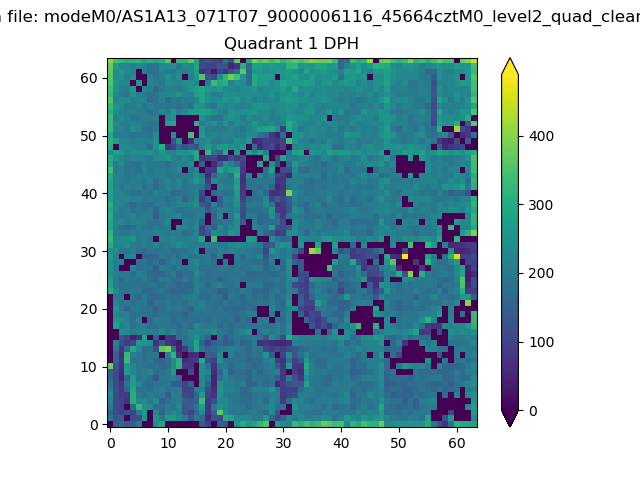 |
Quadrant B |
|---|---|---|---|
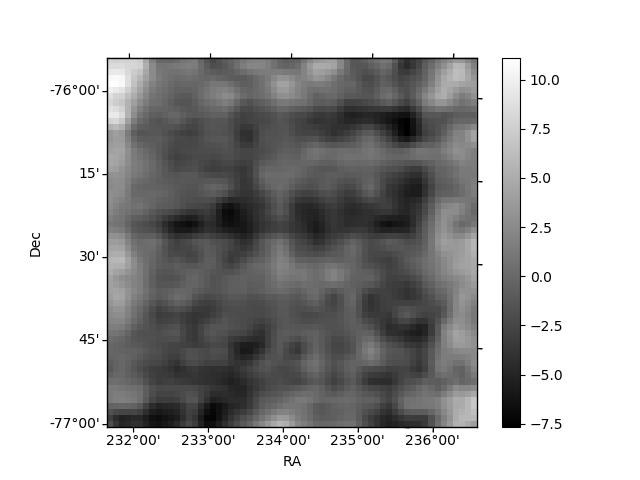
| Quadrant D | 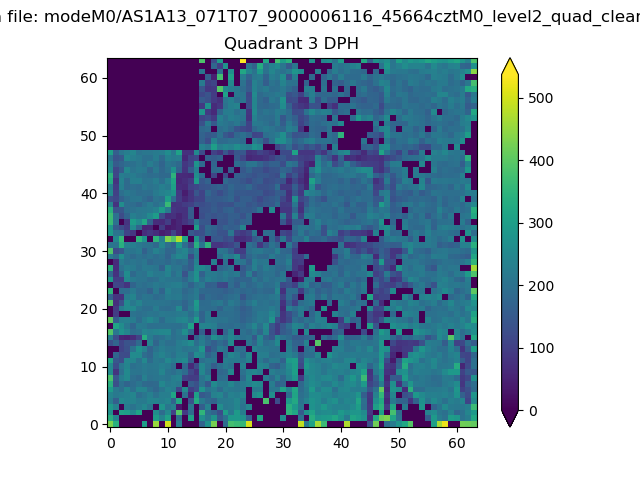 |
 |
Quadrant C |
| Plot type | Count rate plots | Images |
|---|---|---|
| Comparison with Poisson distribution Blue bars denote a histogram of data divided into 1 sec bins. Red curve is a Poisson curve with rate = median count rate of data. |
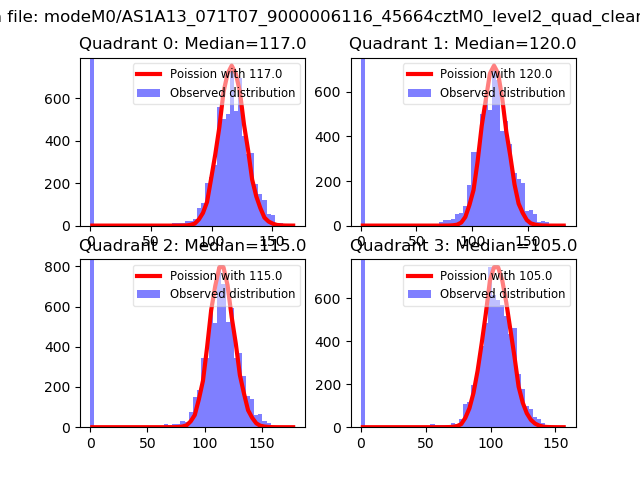 |
 |
| Quadrant-wise count rates Data is divided into 100 sec bins |
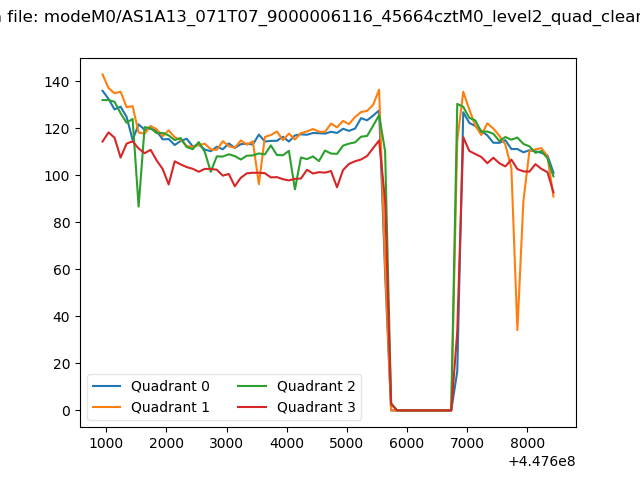 |
|
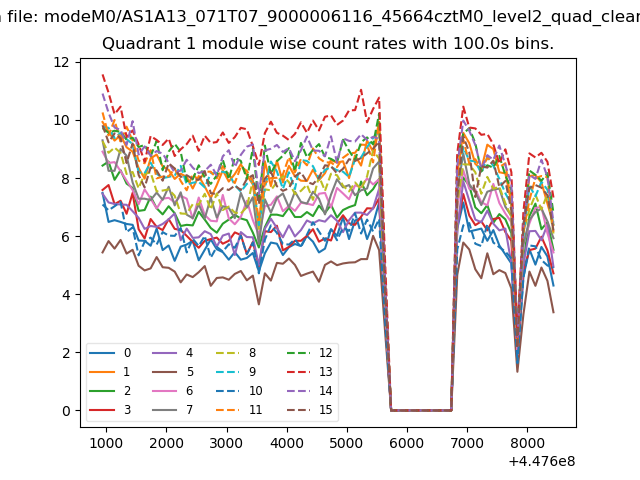
| Module-wise count rates for Quadrant A Data is divided into 100 sec bins |
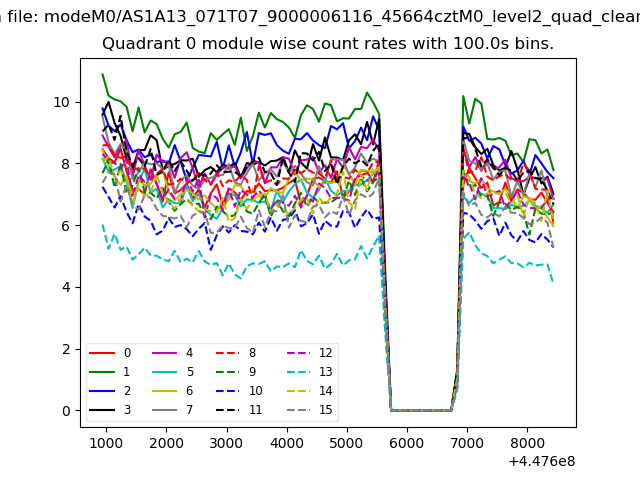 |
 |
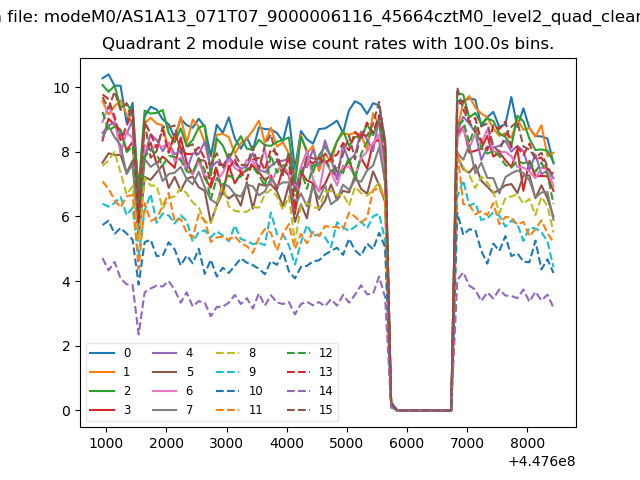
| Module-wise count rates for Quadrant B Data is divided into 100 sec bins |
 |
 |
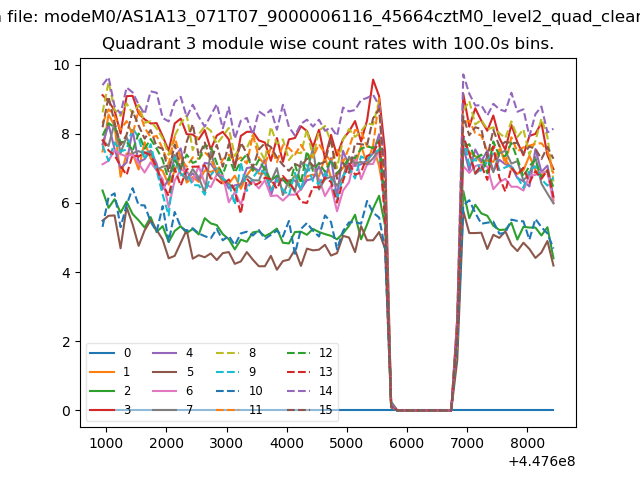
| Module-wise count rates for Quadrant C Data is divided into 100 sec bins |
 |
 |
| Module-wise count rates for Quadrant D Data is divided into 100 sec bins |
 |
 |
| Parameter | Plot |
|---|---|
| CZT HV Monitor | 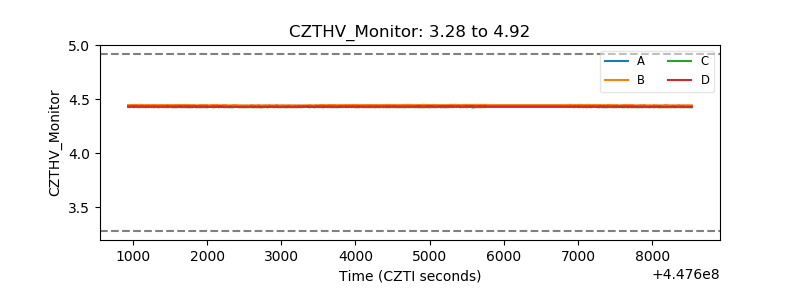 |
| D_VDD | 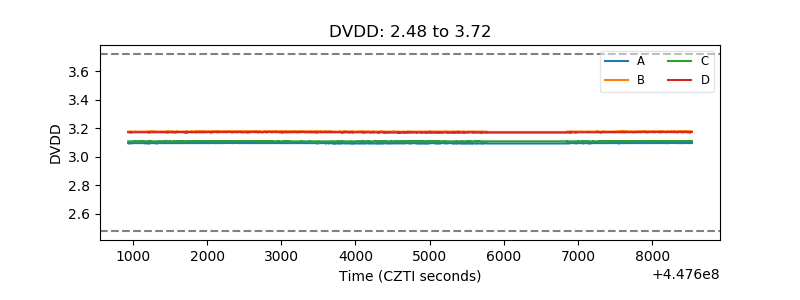 |
| Temperature 1 | 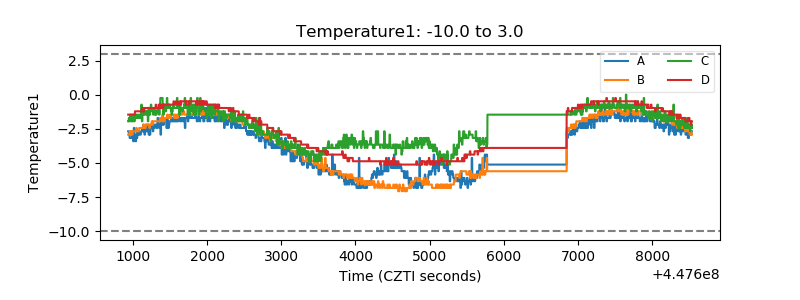 |
| Veto HV Monitor | 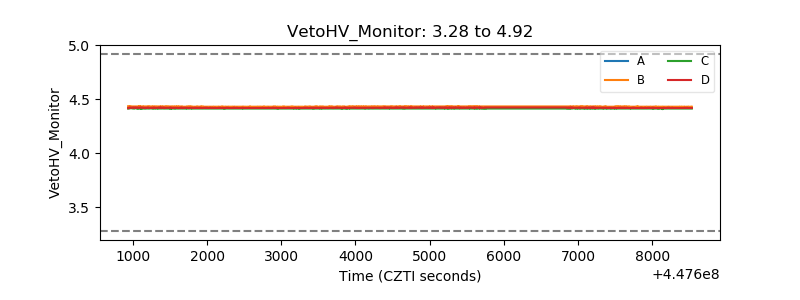 |
| Veto LLD | 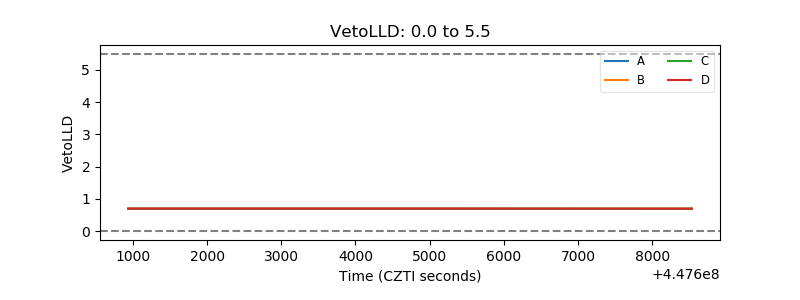 |
| Alpha Counter | 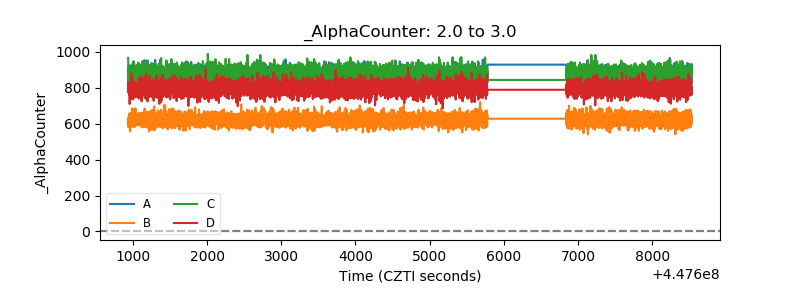 |
| _CPM_Rate | 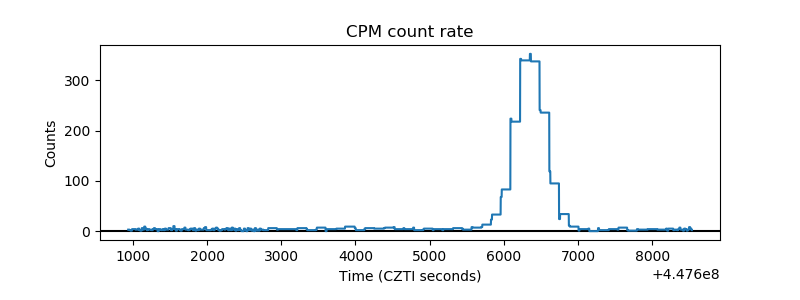 |
| CZT Counter |  |
| +2.5 Volts monitor | 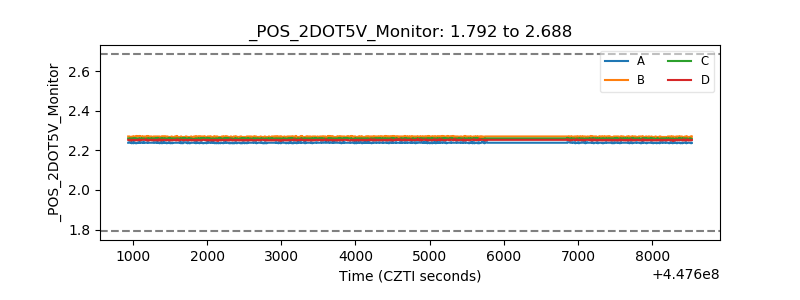 |
| +5 Volts monitor | 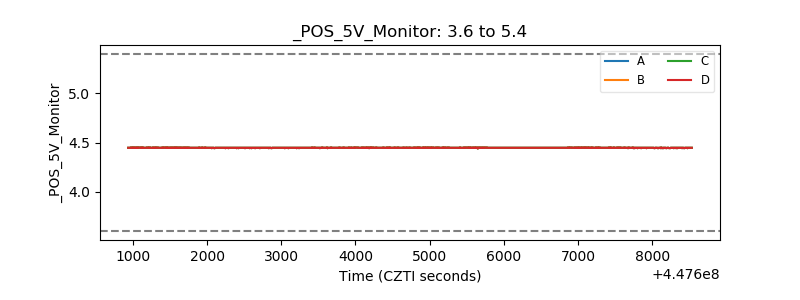 |
| _ROLL_ROT | 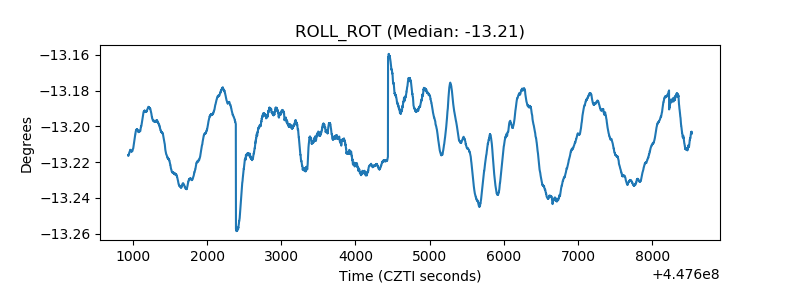 |
| _Roll_DEC | 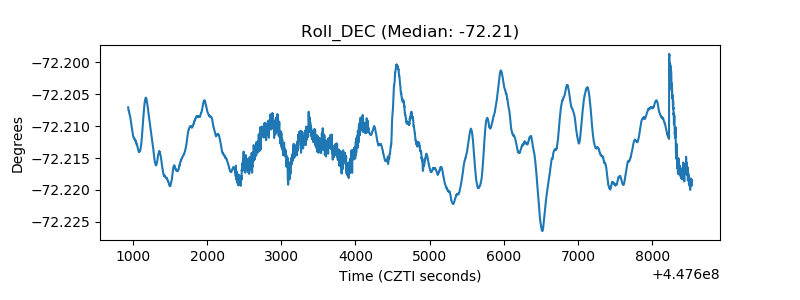 |
| _Roll_RA | 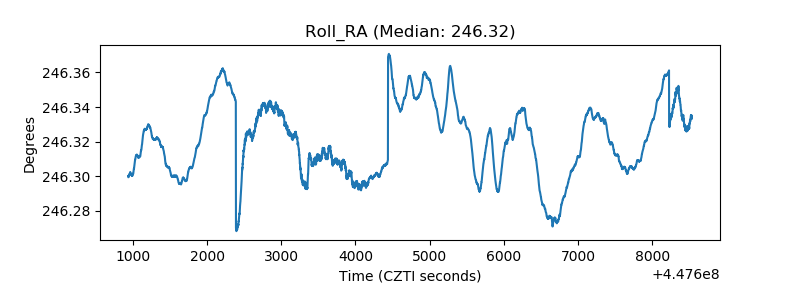 |
| Veto Counter | 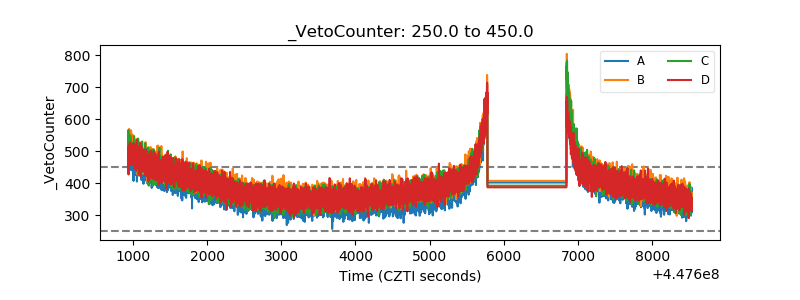 |