| Param | Original file | Final file |
|---|---|---|
| Filename | modeM0/AS1A13_071T07_9000006116_45665cztM0_level2.fits | modeM0/AS1A13_071T07_9000006116_45665cztM0_level2_quad_clean.evt |
| Size (bytes) | 166,887,360 | 38,525,760 |
| Size | 159.2 MB | 36.7 MB |
| Events in quadrant A | 2,112,905 | 257,583 |
| Events in quadrant B | 1,561,454 | 249,868 |
| Events in quadrant C | 995,312 | 257,953 |
| Events in quadrant D | 1,326,969 | 235,436 |
| Mode M0 | |||
|---|---|---|---|
| Quadrant | BADHDUFLAG | Total packets | Discarded packets |
| A | 0 | 7666 | 0 |
| B | 0 | 6117 | 0 |
| C | 0 | 4679 | 0 |
| D | 0 | 5403 | 0 |
| Mode SS | |||
|---|---|---|---|
| Quadrant | BADHDUFLAG | Total packets | Discarded packets |
| A | 0 | 46 | 0 |
| B | 0 | 46 | 0 |
| C | 0 | 46 | 0 |
| D | 0 | 46 | 0 |
| Quadrant | Total seconds | Saturated seconds | Saturation percentage |
|---|---|---|---|
| A | 2299 | 23 | 1.000435% |
| B | 2299 | 158 | 6.872553% |
| C | 2299 | 5 | 0.217486% |
| D | 2299 | 29 | 1.261418% |
Noise dominated data is calculated using 1-second bins in cleaned event files. If a bin has >2000 counts, and if more than 50% of those come from <1% of pixels, then it is considered to be noise-dominated and hence unusable.
| Quadrant | # 1 sec bins | Bins with >0 counts | Bins with >2000 counts | High rate bins dominated by noise | Noise dominated (total time) | Noise dominated (detector-on time) | Marked lightcurve |
|---|---|---|---|---|---|---|---|
| A | 2299 | 2299 | 0 | 0 | 0.00% | 0.00% | 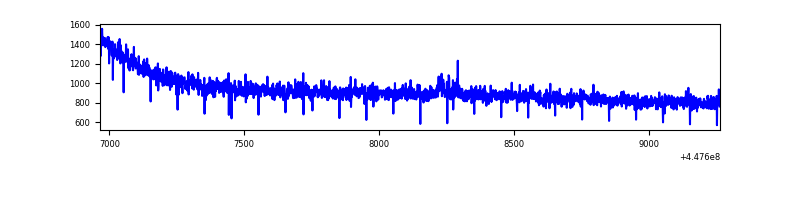 |
| B | 2299 | 2299 | 124 | 124 | 5.39% | 5.39% | 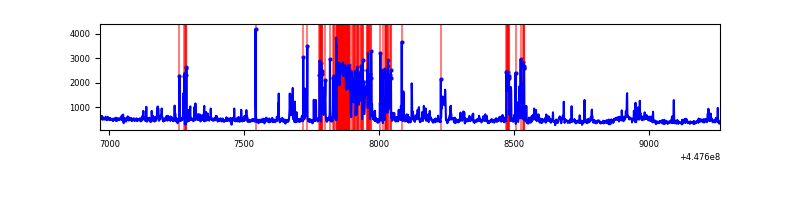 |
| C | 2299 | 2299 | 6 | 6 | 0.26% | 0.26% | 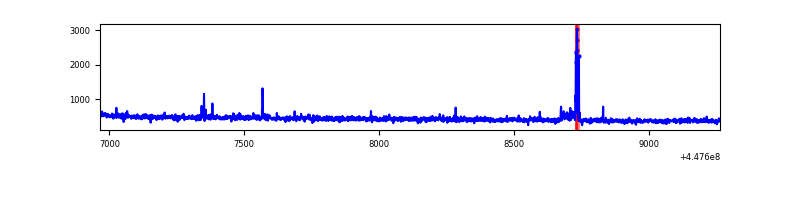 |
| D | 2299 | 2299 | 31 | 31 | 1.35% | 1.35% | 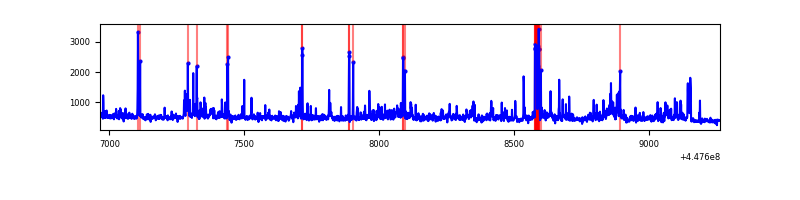 |
Top three noisy pixels from each quadrant. If the there are fewer than three noisy pixels in the level2.evt file, extra rows are filled as -1
| Pixel properties | Quadrant properties | ||||||
|---|---|---|---|---|---|---|---|
| Quadrant | DetID | PixID | Counts | Sigma | Mean | Median | Sigma |
| A | 10 | 83 | 1115446 | 20515.96 | 254 | 249 | 54.4 |
| A | 0 | 243 | 5077 | 88.82 | 254 | 249 | 54.4 |
| A | 13 | 254 | 3776 | 64.89 | 254 | 249 | 54.4 |
| B | 5 | 172 | 432490 | 8959.55 | 244 | 237 | 48.2 |
| B | 4 | 170 | 47080 | 970.94 | 244 | 237 | 48.2 |
| B | 0 | 183 | 46814 | 965.43 | 244 | 237 | 48.2 |
| C | 14 | 254 | 31006 | 521.29 | 245 | 246 | 59.0 |
| C | 9 | 54 | 6406 | 104.39 | 245 | 246 | 59.0 |
| C | 13 | 61 | 1663 | 24.01 | 245 | 246 | 59.0 |
| D | 1 | 52 | 110434 | 1742.64 | 246 | 238 | 63.2 |
| D | 5 | 171 | 42634 | 670.45 | 246 | 238 | 63.2 |
| D | 13 | 29 | 40621 | 638.62 | 246 | 238 | 63.2 |
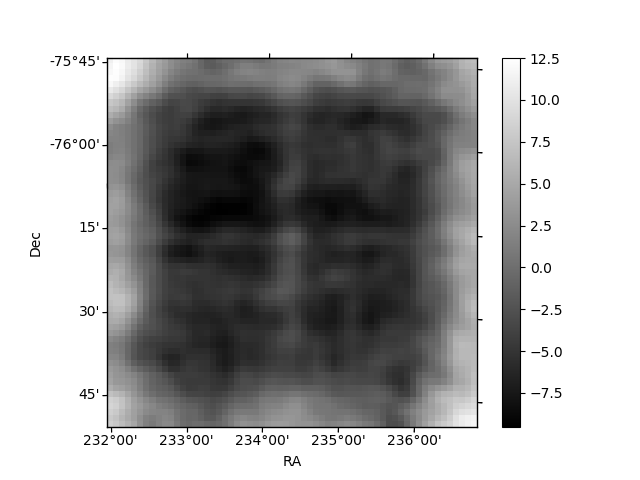
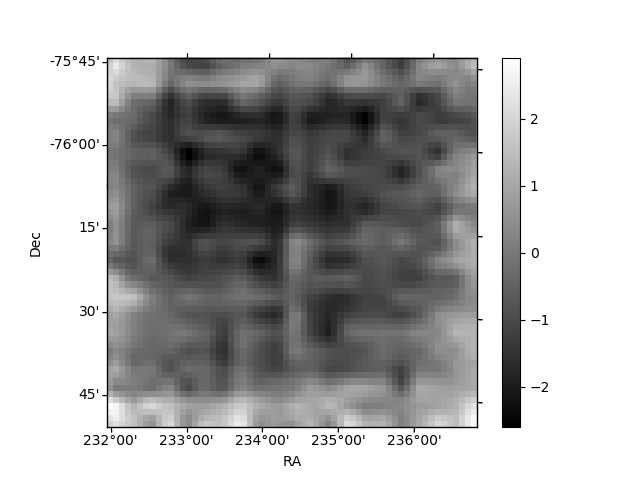
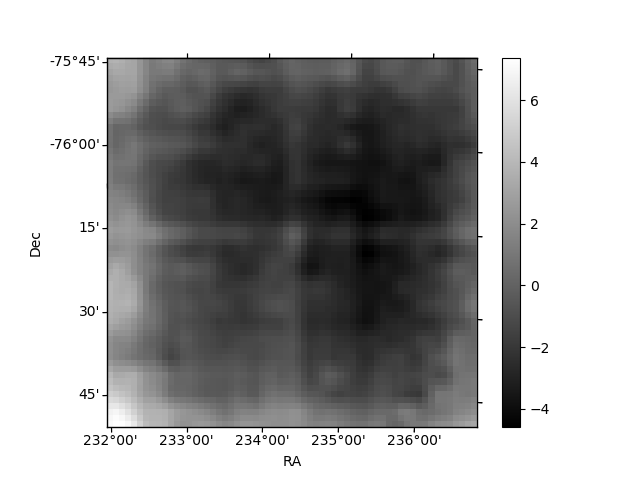
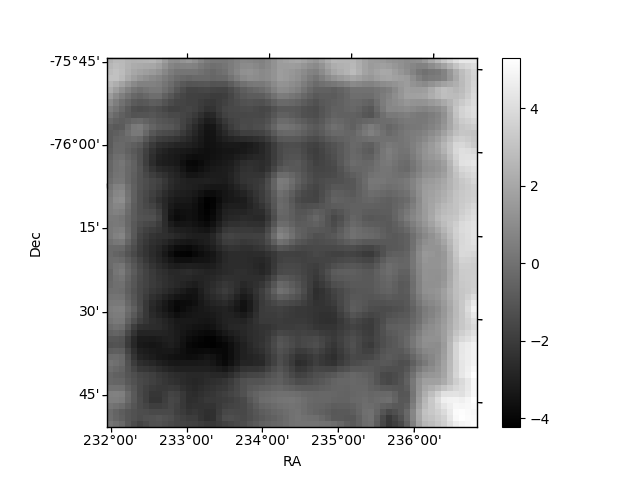
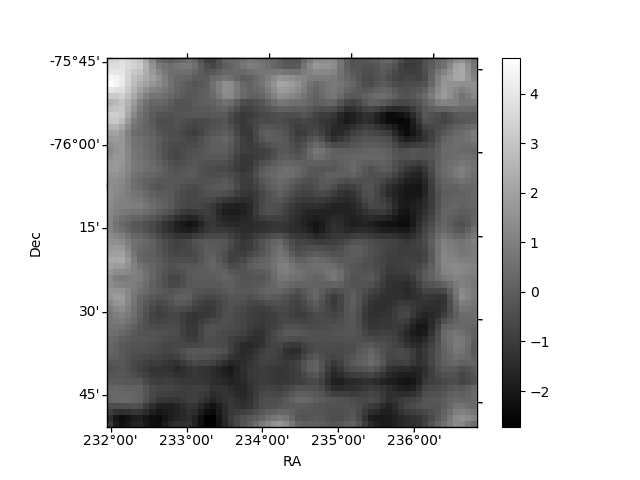
Histogram calculated using DETX and DETY for each event in the final _common_clean file
| Quadrant A | 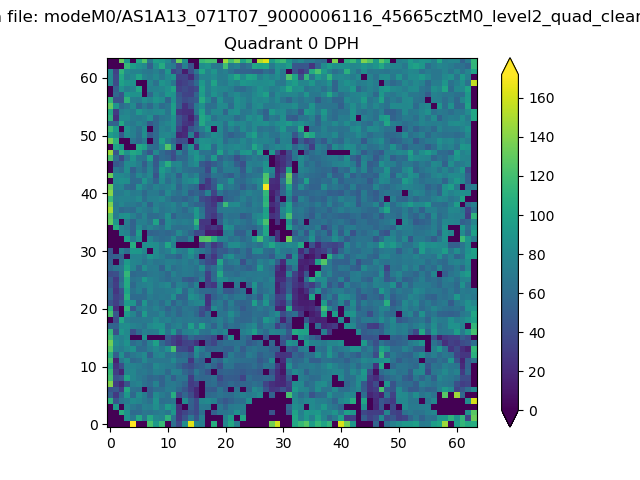 |
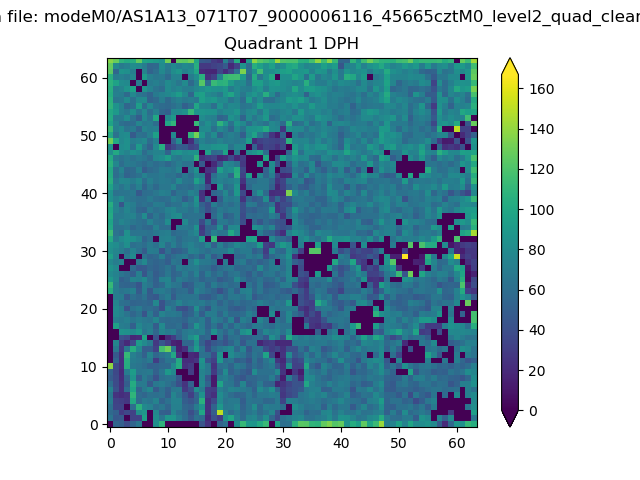 |
Quadrant B |
|---|---|---|---|
| Quadrant D | 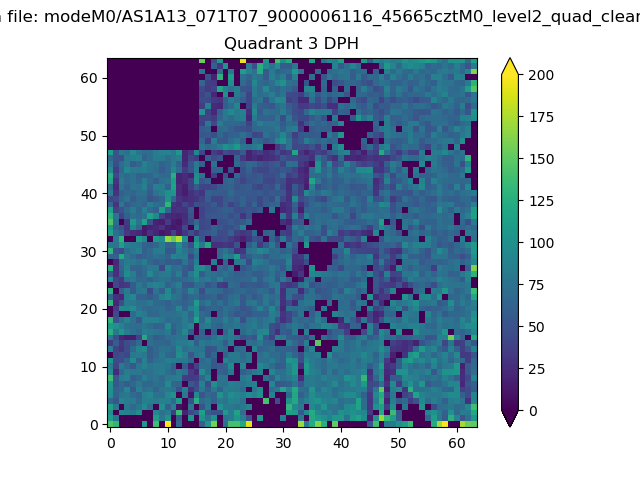 |
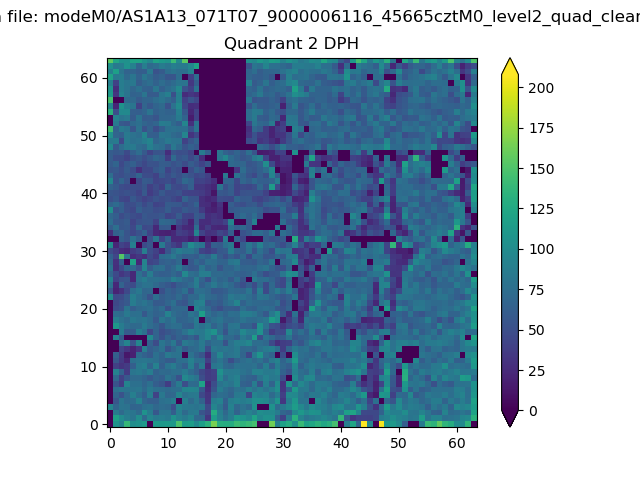 |
Quadrant C |
| Plot type | Count rate plots | Images |
|---|---|---|
| Comparison with Poisson distribution Blue bars denote a histogram of data divided into 1 sec bins. Red curve is a Poisson curve with rate = median count rate of data. |
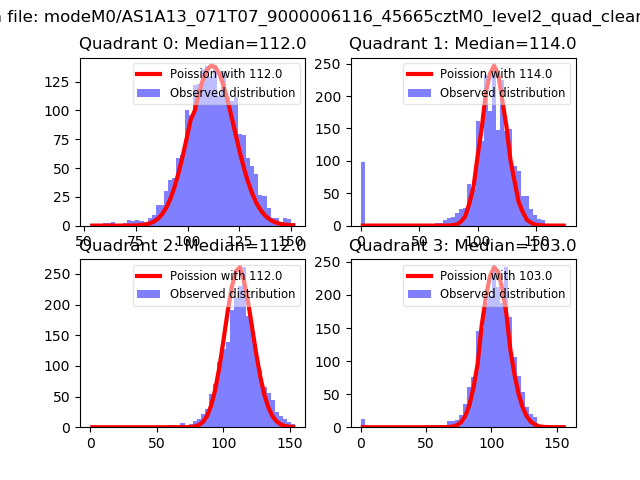 |
 |
| Quadrant-wise count rates Data is divided into 100 sec bins |
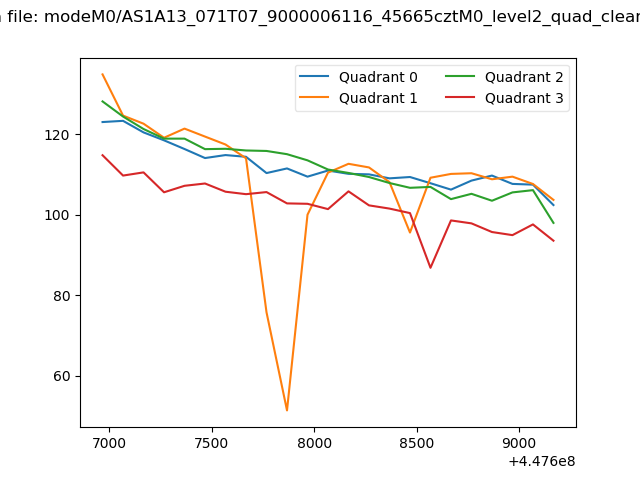 |
|
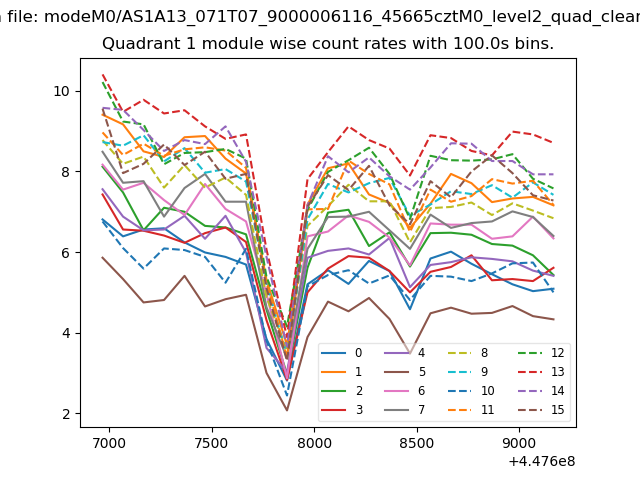
| Module-wise count rates for Quadrant A Data is divided into 100 sec bins |
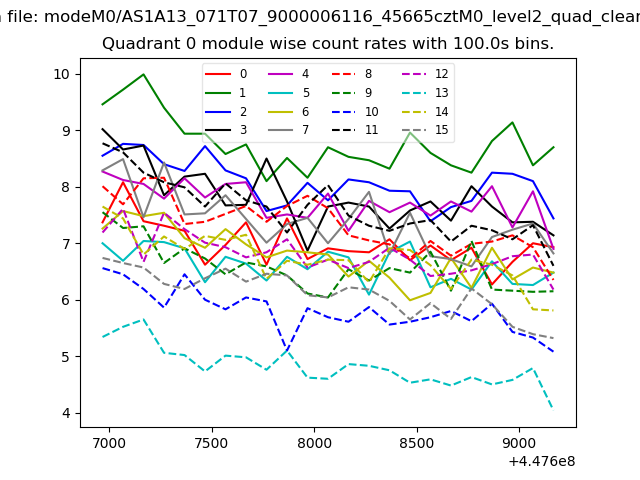 |
 |
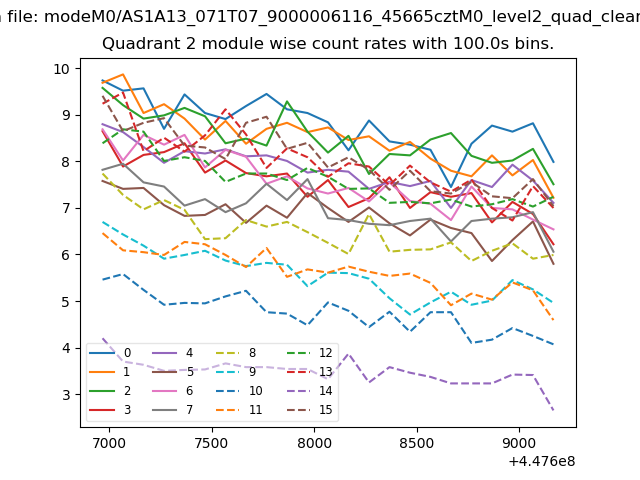
| Module-wise count rates for Quadrant B Data is divided into 100 sec bins |
 |
 |
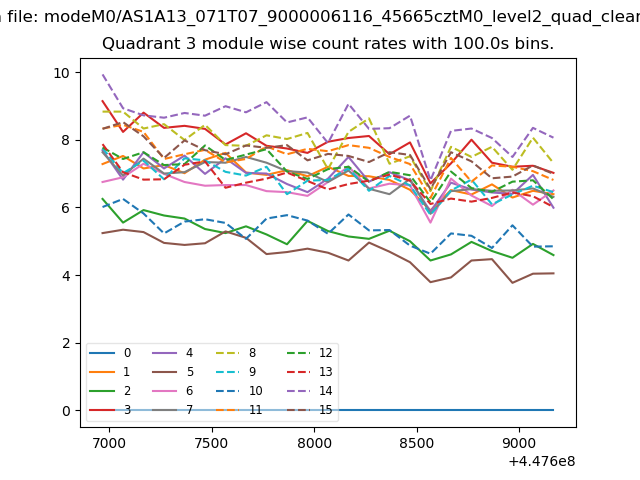
| Module-wise count rates for Quadrant C Data is divided into 100 sec bins |
 |
 |
| Module-wise count rates for Quadrant D Data is divided into 100 sec bins |
 |
 |
| Parameter | Plot |
|---|---|
| CZT HV Monitor | 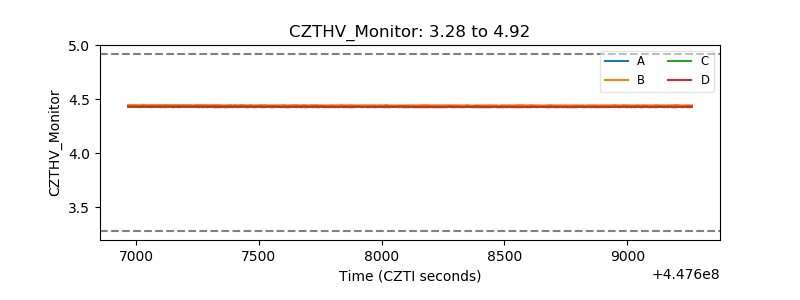 |
| D_VDD | 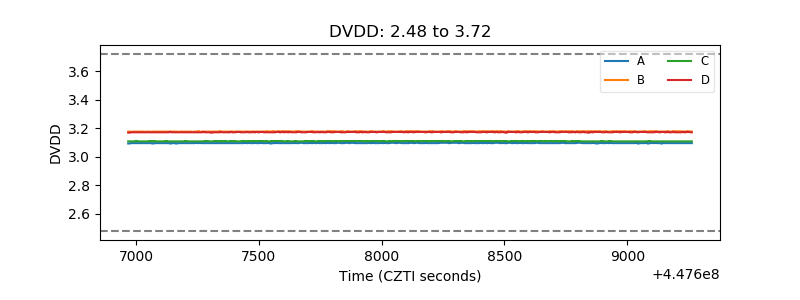 |
| Temperature 1 | 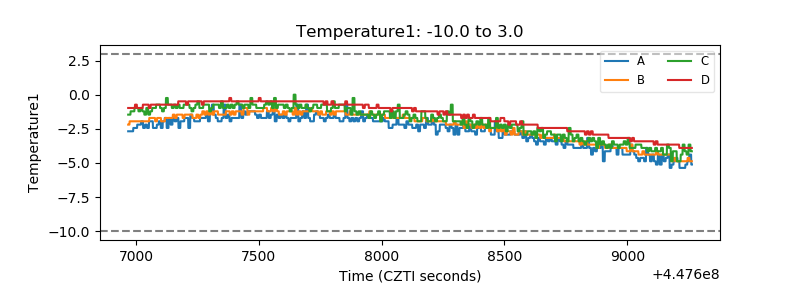 |
| Veto HV Monitor | 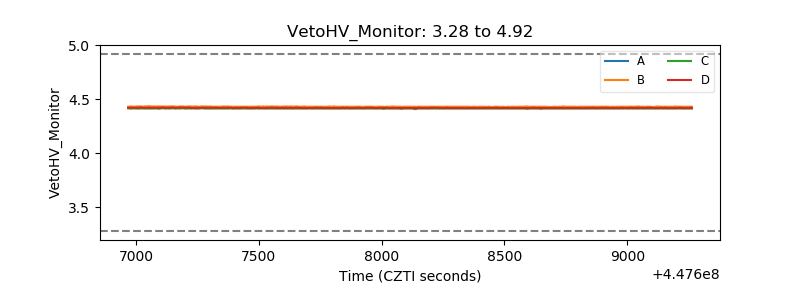 |
| Veto LLD | 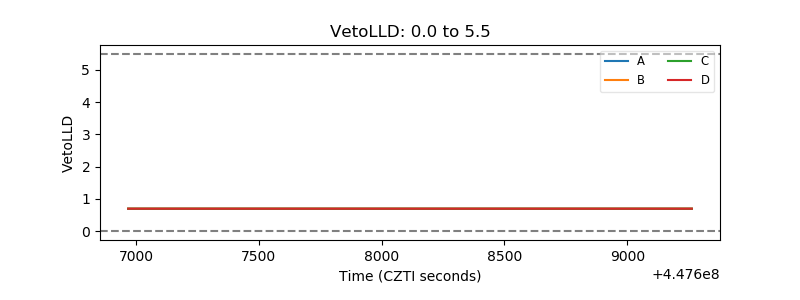 |
| Alpha Counter | 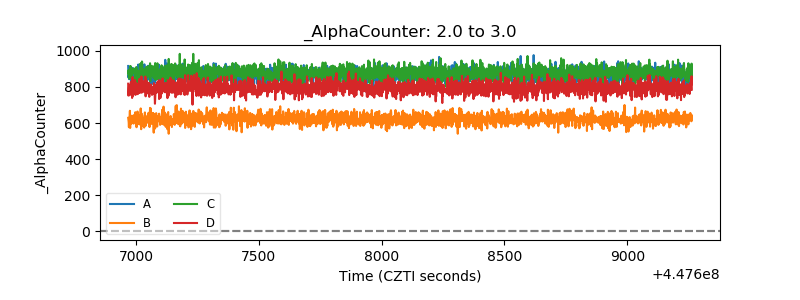 |
| _CPM_Rate | 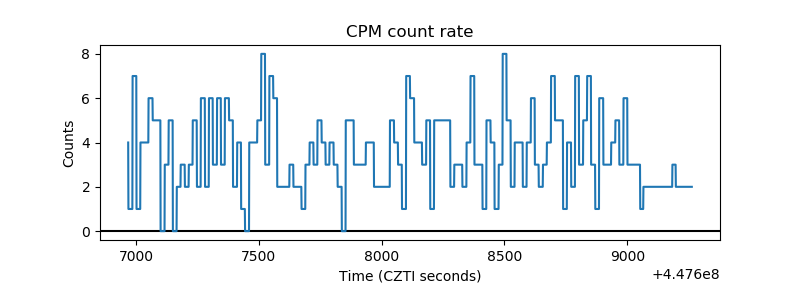 |
| CZT Counter | 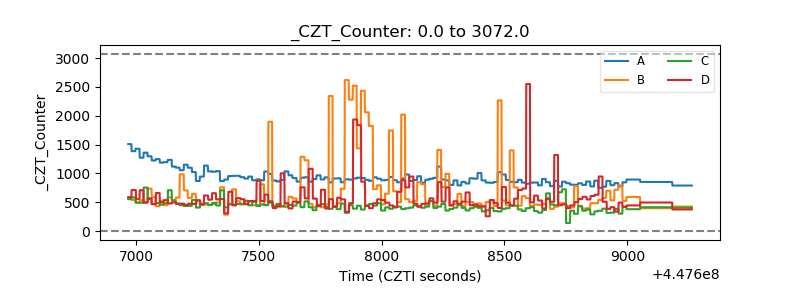 |
| +2.5 Volts monitor | 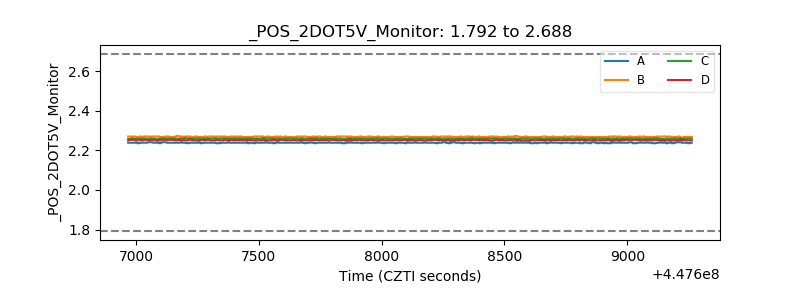 |
| +5 Volts monitor | 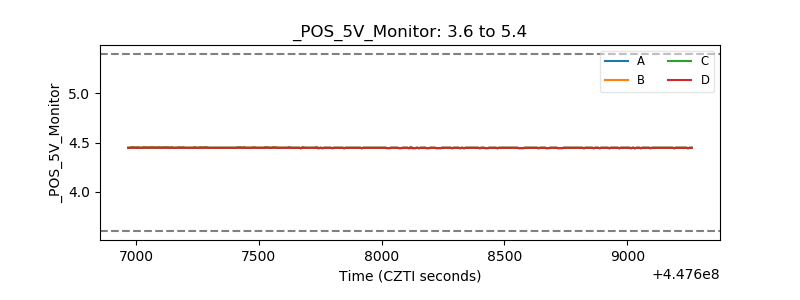 |
| _ROLL_ROT | 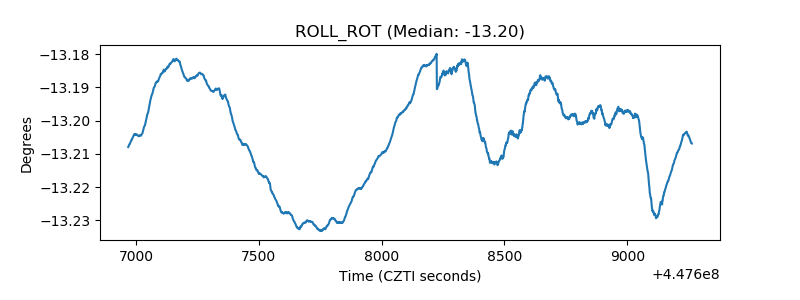 |
| _Roll_DEC | 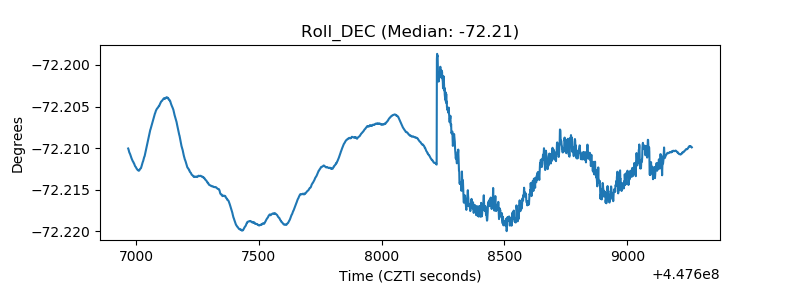 |
| _Roll_RA | 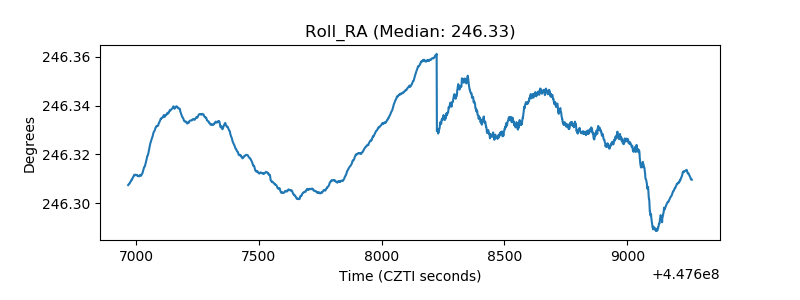 |
| Veto Counter | 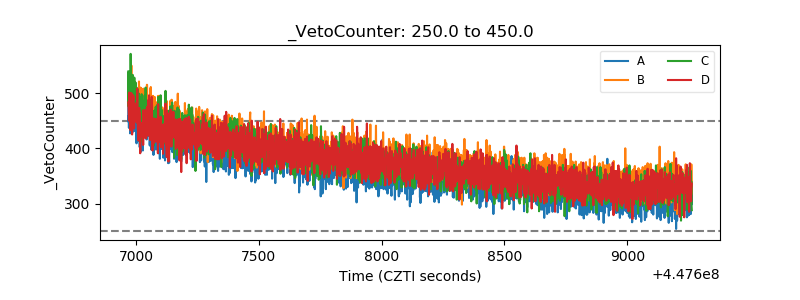 |