| Param | Original file | Final file |
|---|---|---|
| Filename | modeM0/AS1A13_093T12_9000006118_45665cztM0_level2.fits | modeM0/AS1A13_093T12_9000006118_45665cztM0_level2_quad_clean.evt |
| Size (bytes) | 229,567,680 | 52,830,720 |
| Size | 218.9 MB | 50.4 MB |
| Events in quadrant A | 2,932,351 | 342,031 |
| Events in quadrant B | 1,777,275 | 362,014 |
| Events in quadrant C | 1,701,568 | 348,717 |
| Events in quadrant D | 1,836,069 | 319,669 |
| Mode M0 | |||
|---|---|---|---|
| Quadrant | BADHDUFLAG | Total packets | Discarded packets |
| A | 0 | 10952 | 1 |
| B | 0 | 7353 | 1 |
| C | 0 | 7242 | 1 |
| D | 0 | 7630 | 1 |
| Mode SS | |||
|---|---|---|---|
| Quadrant | BADHDUFLAG | Total packets | Discarded packets |
| A | 0 | 66 | 0 |
| B | 0 | 66 | 0 |
| C | 0 | 66 | 0 |
| D | 0 | 66 | 0 |
| Mode M9 | |||
|---|---|---|---|
| Quadrant | BADHDUFLAG | Total packets | Discarded packets |
| A | 0 | 9 | 0 |
| B | 0 | 9 | 0 |
| C | 0 | 9 | 0 |
| D | 0 | 9 | 0 |
| Quadrant | Total seconds | Saturated seconds | Saturation percentage |
|---|---|---|---|
| A | 3203 | 231 | 7.211989% |
| B | 3203 | 128 | 3.996254% |
| C | 3203 | 93 | 2.903528% |
| D | 3203 | 109 | 3.403060% |
Noise dominated data is calculated using 1-second bins in cleaned event files. If a bin has >2000 counts, and if more than 50% of those come from <1% of pixels, then it is considered to be noise-dominated and hence unusable.
| Quadrant | # 1 sec bins | Bins with >0 counts | Bins with >2000 counts | High rate bins dominated by noise | Noise dominated (total time) | Noise dominated (detector-on time) | Marked lightcurve |
|---|---|---|---|---|---|---|---|
| A | 4033 | 3203 | 14 | 14 | 0.35% | 0.44% | 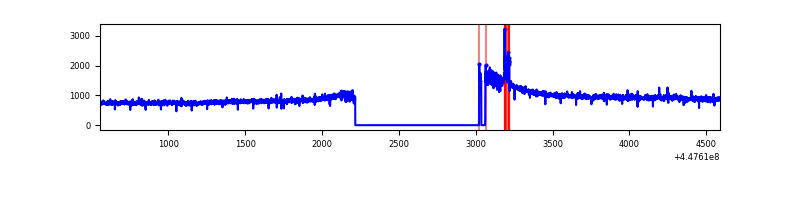 |
| B | 4033 | 3204 | 8 | 8 | 0.20% | 0.25% | 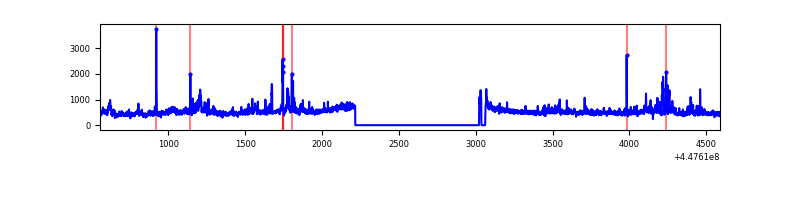 |
| C | 4033 | 3205 | 8 | 8 | 0.20% | 0.25% | 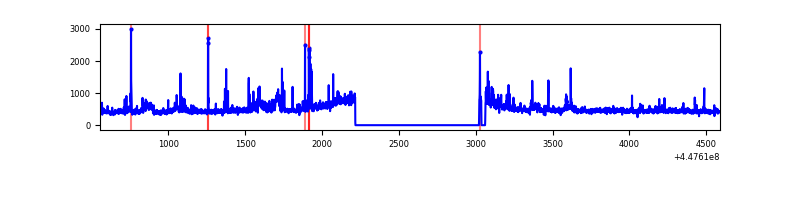 |
| D | 4033 | 3205 | 21 | 21 | 0.52% | 0.66% | 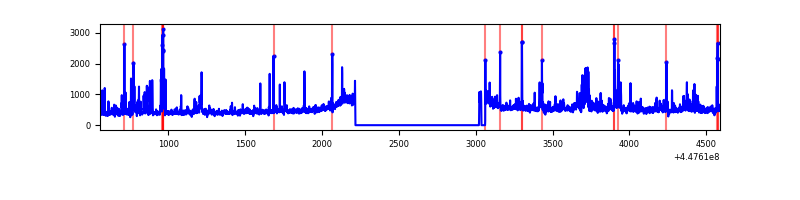 |
Top three noisy pixels from each quadrant. If the there are fewer than three noisy pixels in the level2.evt file, extra rows are filled as -1
| Pixel properties | Quadrant properties | ||||||
|---|---|---|---|---|---|---|---|
| Quadrant | DetID | PixID | Counts | Sigma | Mean | Median | Sigma |
| A | 10 | 83 | 1434640 | 18036.99 | 378 | 371 | 79.5 |
| A | 10 | 248 | 23962 | 296.67 | 378 | 371 | 79.5 |
| A | 6 | 10 | 5320 | 62.24 | 378 | 371 | 79.5 |
| B | 0 | 155 | 73559 | 969.75 | 379 | 367 | 75.5 |
| B | 5 | 255 | 53848 | 708.59 | 379 | 367 | 75.5 |
| B | 0 | 183 | 32807 | 429.81 | 379 | 367 | 75.5 |
| C | 9 | 54 | 138605 | 1567.18 | 373 | 372 | 88.2 |
| C | 14 | 254 | 90535 | 1022.2 | 373 | 372 | 88.2 |
| C | 2 | 14 | 15918 | 176.25 | 373 | 372 | 88.2 |
| D | 1 | 52 | 125116 | 1319.74 | 375 | 361 | 94.5 |
| D | 13 | 249 | 109318 | 1152.62 | 375 | 361 | 94.5 |
| D | 5 | 171 | 56173 | 590.42 | 375 | 361 | 94.5 |
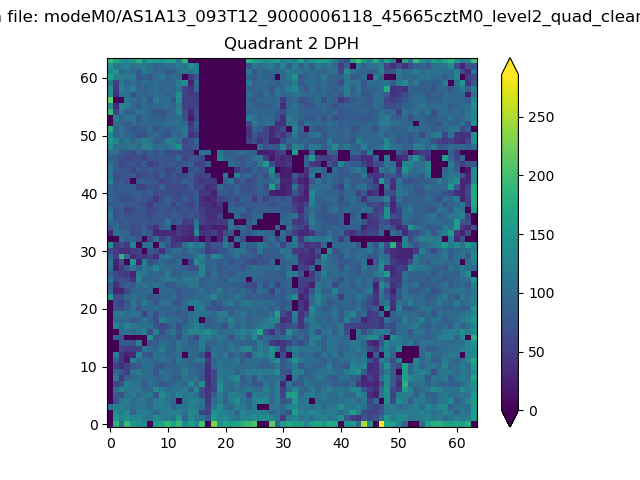
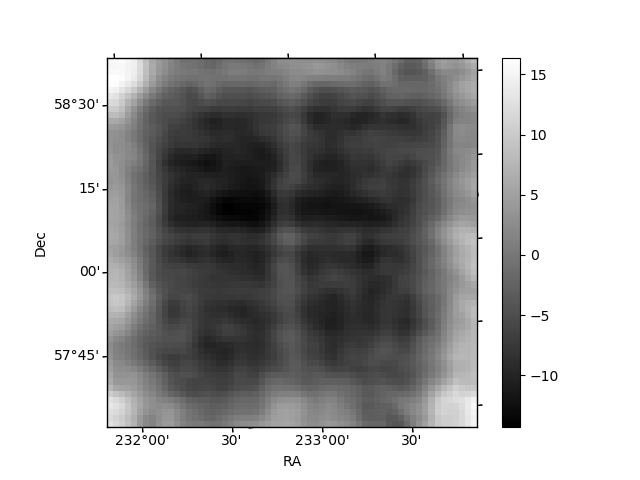
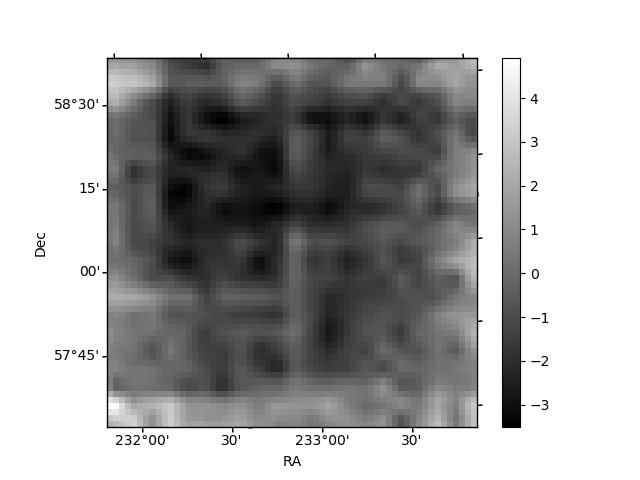
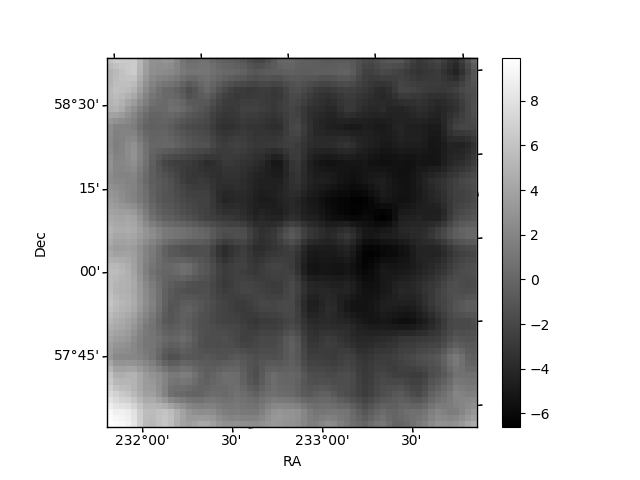
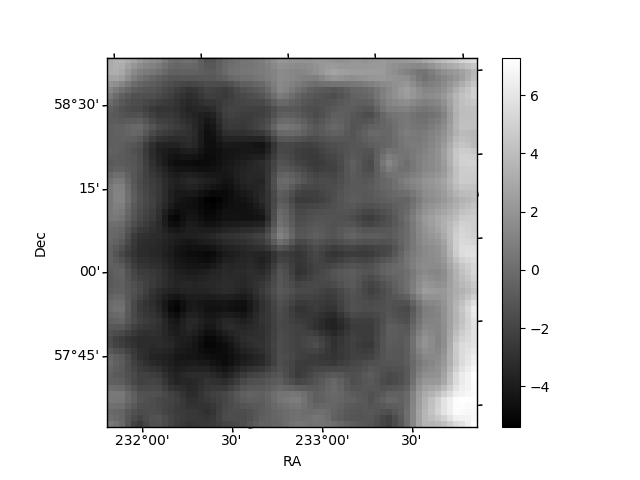
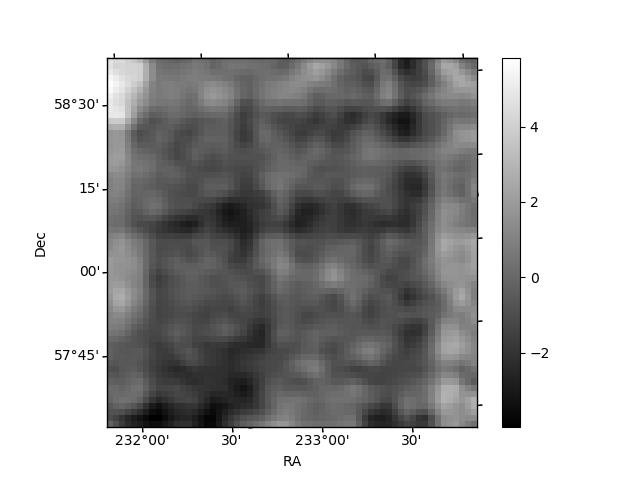
Histogram calculated using DETX and DETY for each event in the final _common_clean file
| Quadrant A | 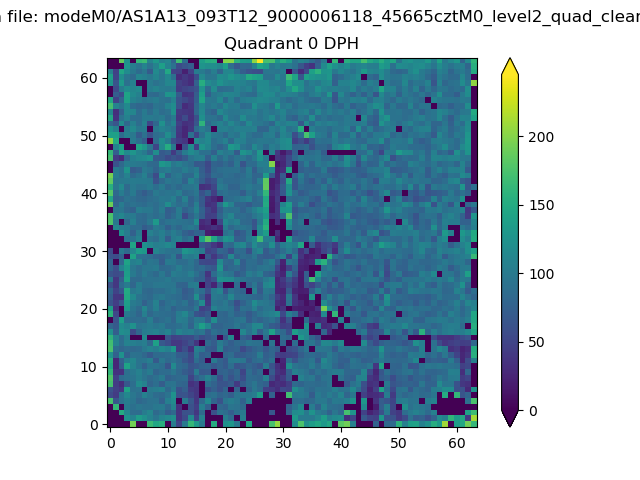 |
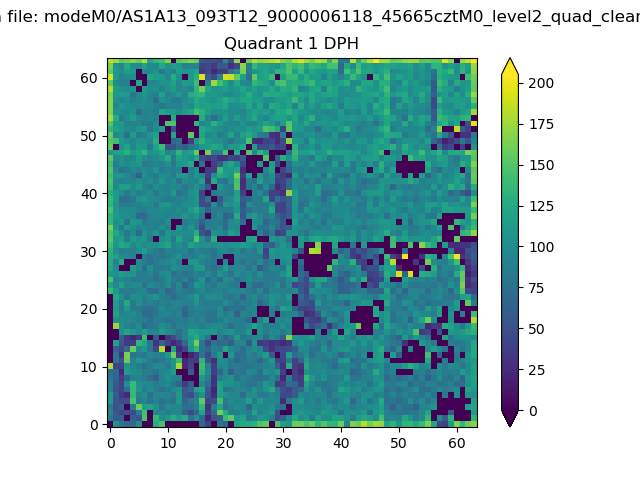 |
Quadrant B |
|---|---|---|---|
| Quadrant D | 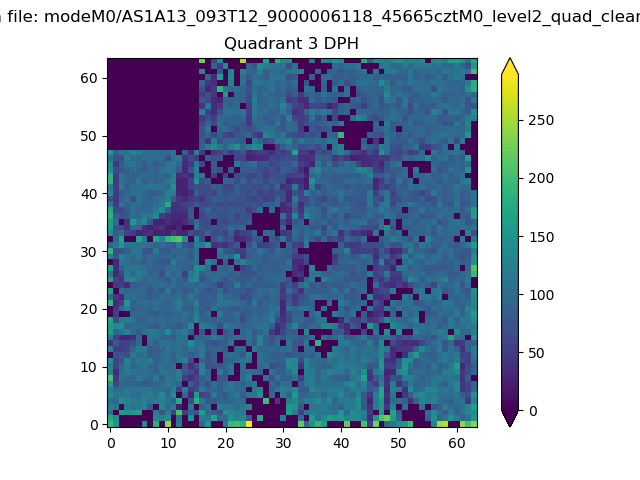 |
 |
Quadrant C |
| Plot type | Count rate plots | Images |
|---|---|---|
| Comparison with Poisson distribution Blue bars denote a histogram of data divided into 1 sec bins. Red curve is a Poisson curve with rate = median count rate of data. |
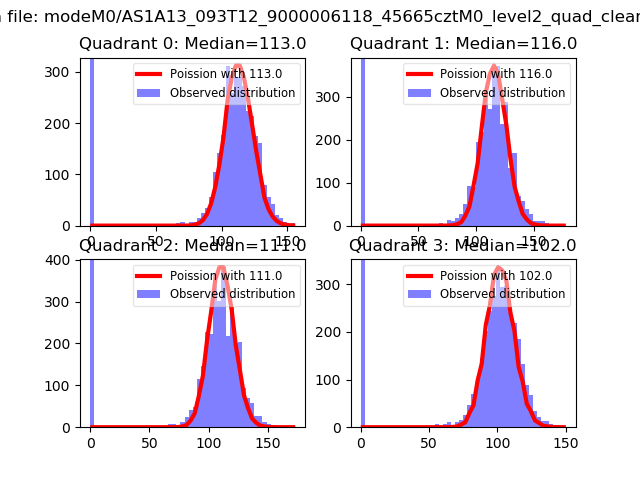 |
 |
| Quadrant-wise count rates Data is divided into 100 sec bins |
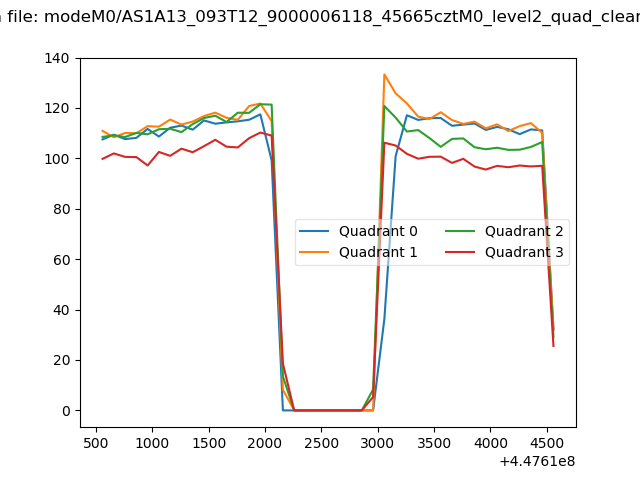 |
|
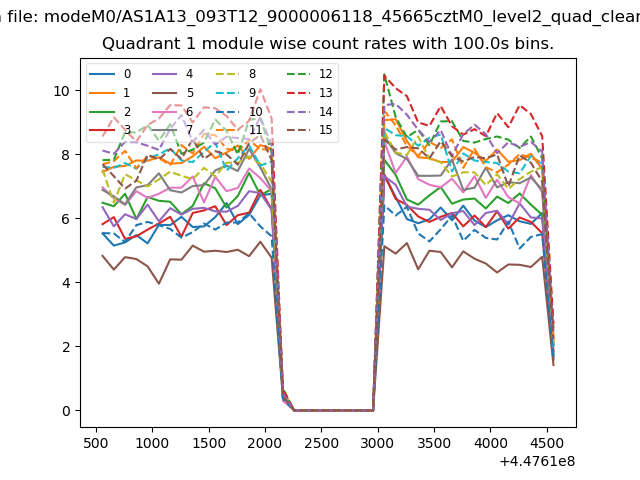
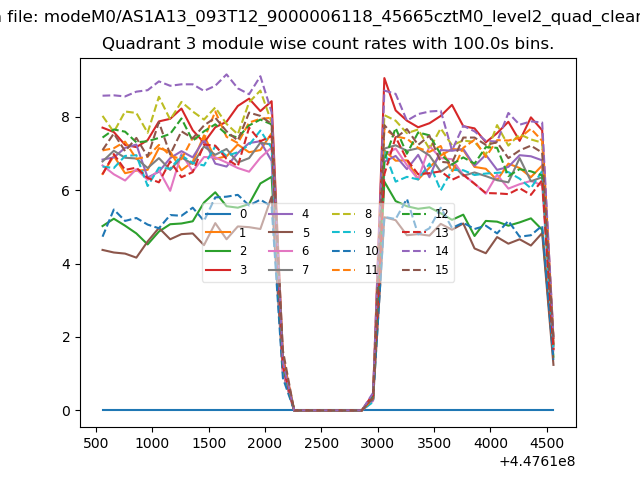
| Module-wise count rates for Quadrant A Data is divided into 100 sec bins |
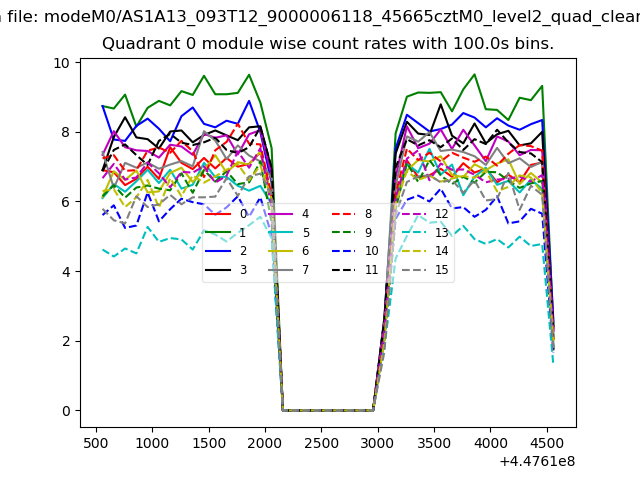 |
 |
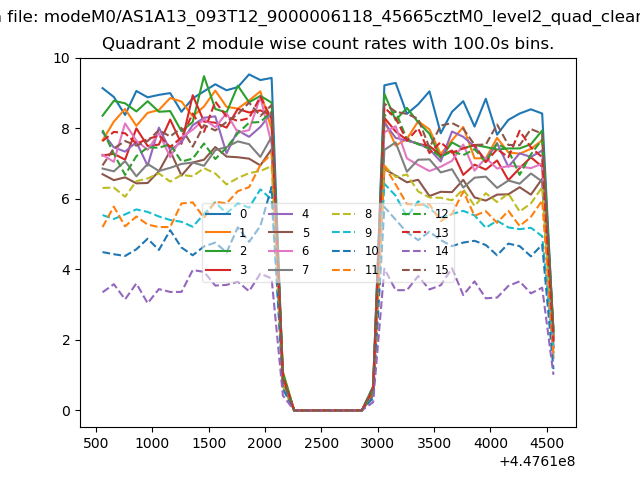
| Module-wise count rates for Quadrant B Data is divided into 100 sec bins |
 |
 |
| Module-wise count rates for Quadrant C Data is divided into 100 sec bins |
 |
 |
| Module-wise count rates for Quadrant D Data is divided into 100 sec bins |
 |
 |
| Parameter | Plot |
|---|---|
| CZT HV Monitor |  |
| D_VDD | 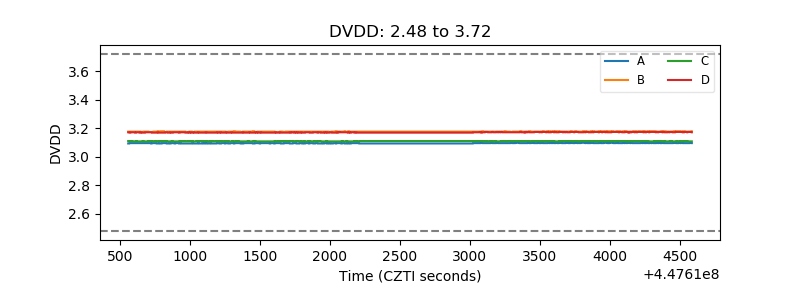 |
| Temperature 1 | 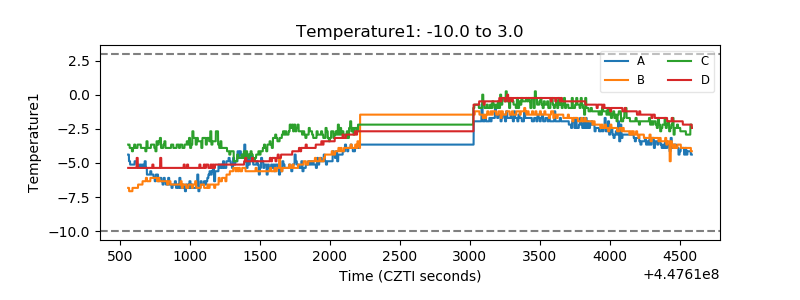 |
| Veto HV Monitor | 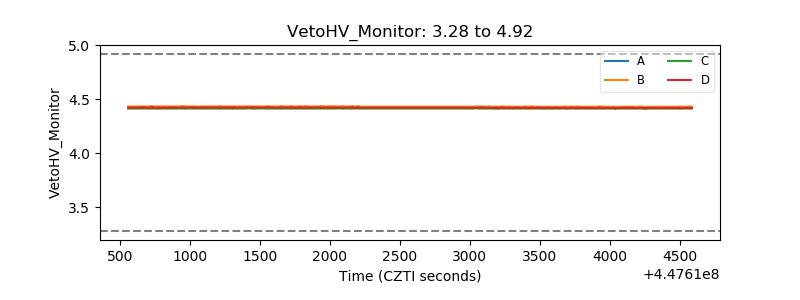 |
| Veto LLD | 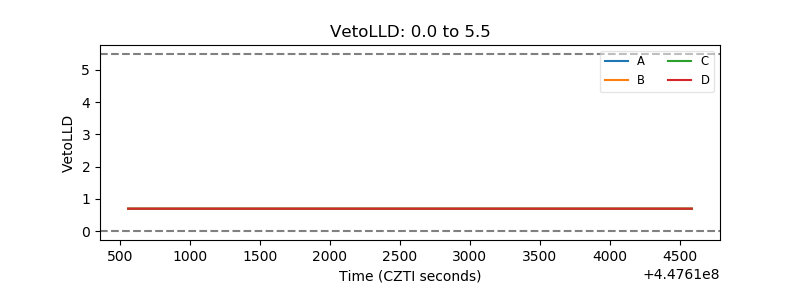 |
| Alpha Counter | 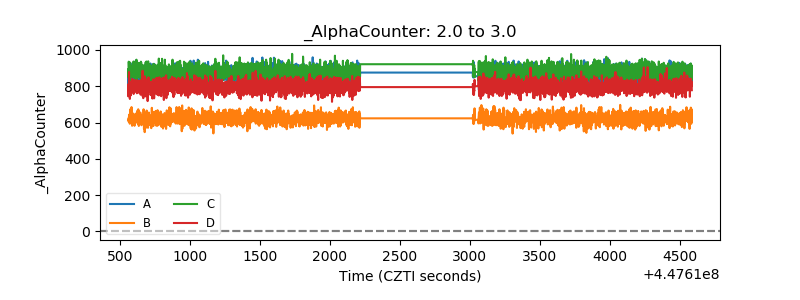 |
| _CPM_Rate | 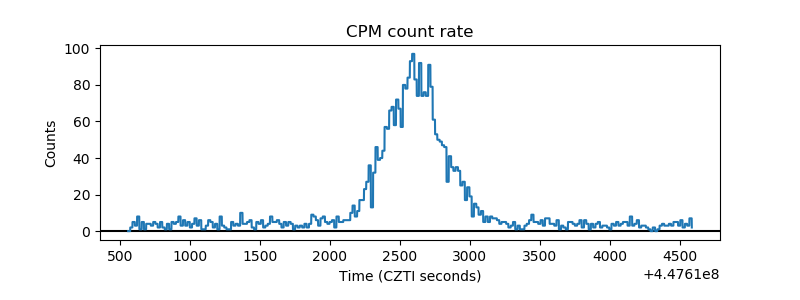 |
| CZT Counter | 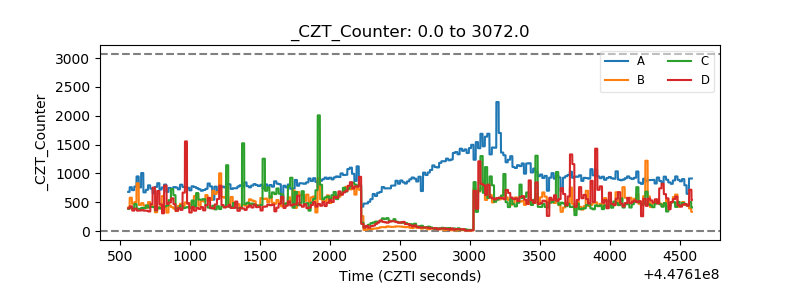 |
| +2.5 Volts monitor | 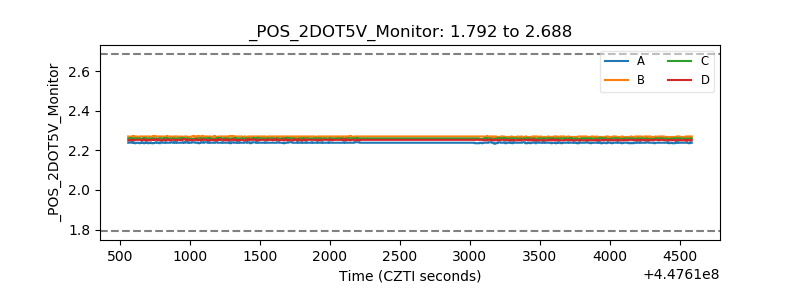 |
| +5 Volts monitor | 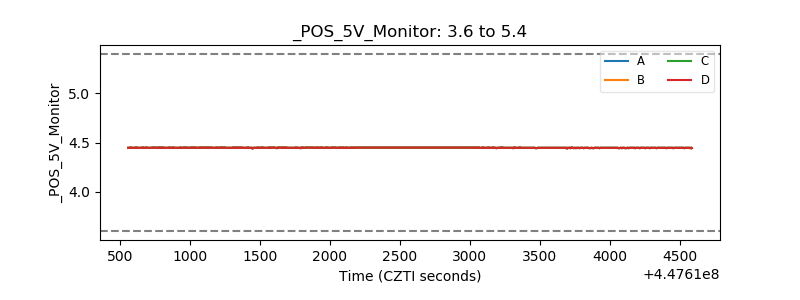 |
| _ROLL_ROT | 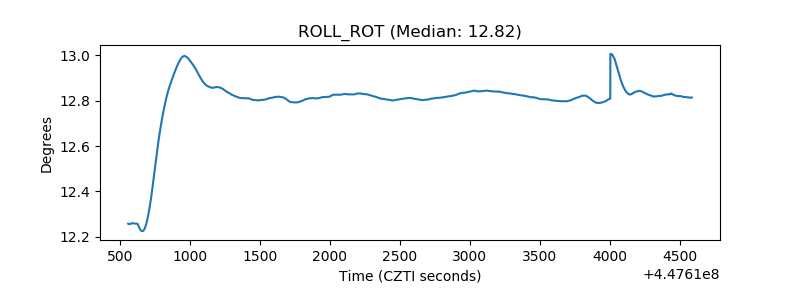 |
| _Roll_DEC | 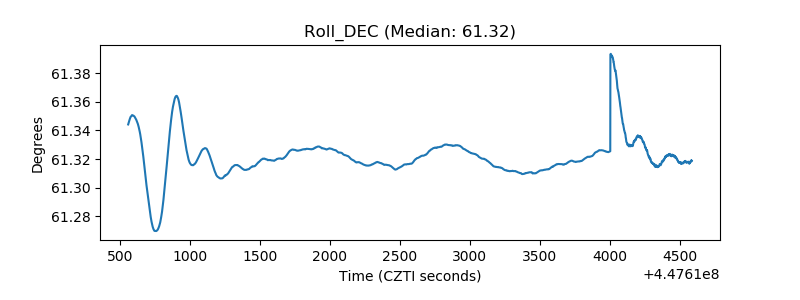 |
| _Roll_RA | 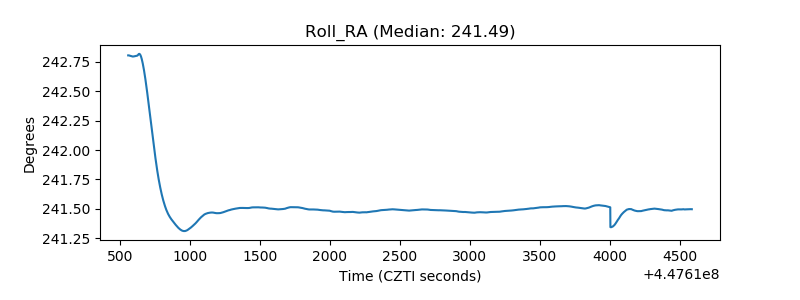 |
| Veto Counter | 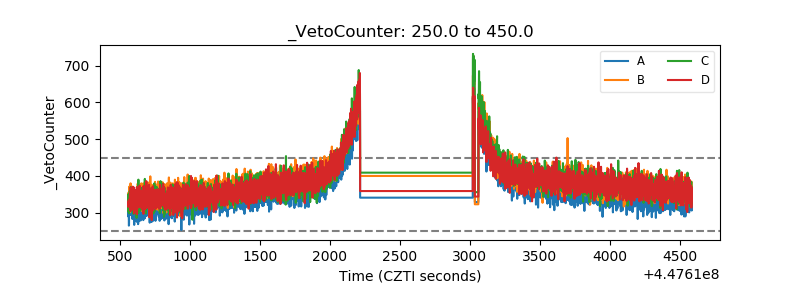 |