| Param | Original file | Final file |
|---|---|---|
| Filename | modeM0/AS1A13_093T12_9000006118_45666cztM0_level2.fits | modeM0/AS1A13_093T12_9000006118_45666cztM0_level2_quad_clean.evt |
| Size (bytes) | 520,626,240 | 119,658,240 |
| Size | 496.5 MB | 114.1 MB |
| Events in quadrant A | 6,413,987 | 782,803 |
| Events in quadrant B | 4,176,092 | 821,208 |
| Events in quadrant C | 3,477,768 | 787,968 |
| Events in quadrant D | 4,633,166 | 718,714 |
| Mode M0 | |||
|---|---|---|---|
| Quadrant | BADHDUFLAG | Total packets | Discarded packets |
| A | 0 | 24289 | 4 |
| B | 0 | 17439 | 3 |
| C | 0 | 15742 | 3 |
| D | 0 | 18806 | 3 |
| Mode SS | |||
|---|---|---|---|
| Quadrant | BADHDUFLAG | Total packets | Discarded packets |
| A | 0 | 152 | 0 |
| B | 0 | 152 | 0 |
| C | 0 | 152 | 0 |
| D | 0 | 152 | 0 |
| Mode M9 | |||
|---|---|---|---|
| Quadrant | BADHDUFLAG | Total packets | Discarded packets |
| A | 0 | 3 | 0 |
| B | 0 | 4 | 0 |
| C | 0 | 4 | 0 |
| D | 0 | 4 | 0 |
| Quadrant | Total seconds | Saturated seconds | Saturation percentage |
|---|---|---|---|
| A | 7359 | 288 | 3.913575% |
| B | 7359 | 175 | 2.378040% |
| C | 7359 | 93 | 1.263759% |
| D | 7359 | 175 | 2.378040% |
Noise dominated data is calculated using 1-second bins in cleaned event files. If a bin has >2000 counts, and if more than 50% of those come from <1% of pixels, then it is considered to be noise-dominated and hence unusable.
| Quadrant | # 1 sec bins | Bins with >0 counts | Bins with >2000 counts | High rate bins dominated by noise | Noise dominated (total time) | Noise dominated (detector-on time) | Marked lightcurve |
|---|---|---|---|---|---|---|---|
| A | 7714 | 7361 | 13 | 13 | 0.17% | 0.18% | 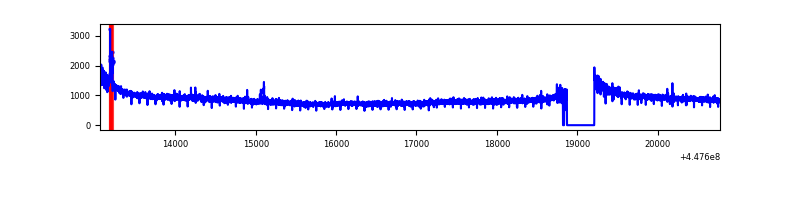 |
| B | 7714 | 7361 | 47 | 47 | 0.61% | 0.64% | 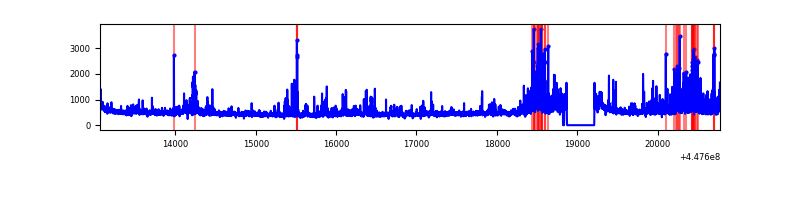 |
| C | 7714 | 7361 | 37 | 37 | 0.48% | 0.50% | 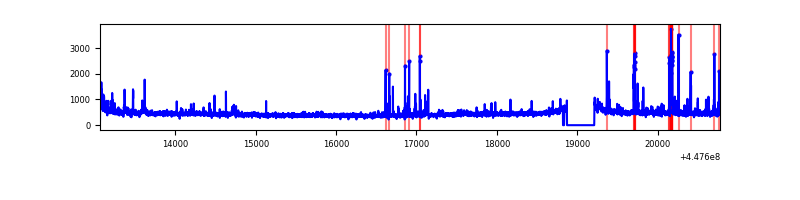 |
| D | 7714 | 7360 | 113 | 113 | 1.46% | 1.54% | 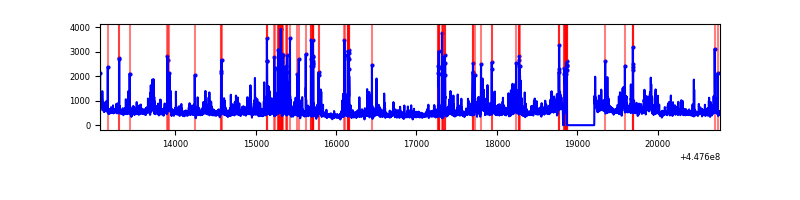 |
Top three noisy pixels from each quadrant. If the there are fewer than three noisy pixels in the level2.evt file, extra rows are filled as -1
| Pixel properties | Quadrant properties | ||||||
|---|---|---|---|---|---|---|---|
| Quadrant | DetID | PixID | Counts | Sigma | Mean | Median | Sigma |
| A | 10 | 83 | 3187253 | 18750.87 | 819 | 800 | 169.9 |
| A | 10 | 248 | 32464 | 186.33 | 819 | 800 | 169.9 |
| A | 0 | 243 | 12884 | 71.11 | 819 | 800 | 169.9 |
| B | 12 | 16 | 432112 | 2686.68 | 821 | 795 | 160.5 |
| B | 0 | 183 | 75968 | 468.25 | 821 | 795 | 160.5 |
| B | 0 | 189 | 61544 | 378.41 | 821 | 795 | 160.5 |
| C | 14 | 254 | 227737 | 1192.56 | 809 | 811 | 190.3 |
| C | 9 | 54 | 70862 | 368.14 | 809 | 811 | 190.3 |
| C | 12 | 250 | 8719 | 41.56 | 809 | 811 | 190.3 |
| D | 1 | 52 | 546815 | 2692.88 | 806 | 780 | 202.8 |
| D | 13 | 249 | 471907 | 2323.46 | 806 | 780 | 202.8 |
| D | 2 | 249 | 144177 | 707.19 | 806 | 780 | 202.8 |
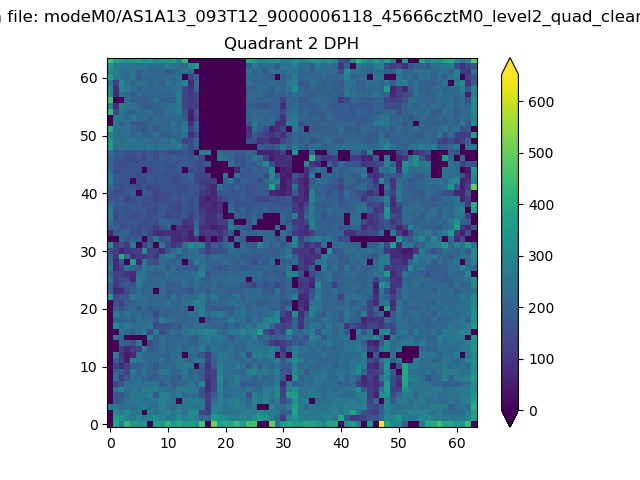
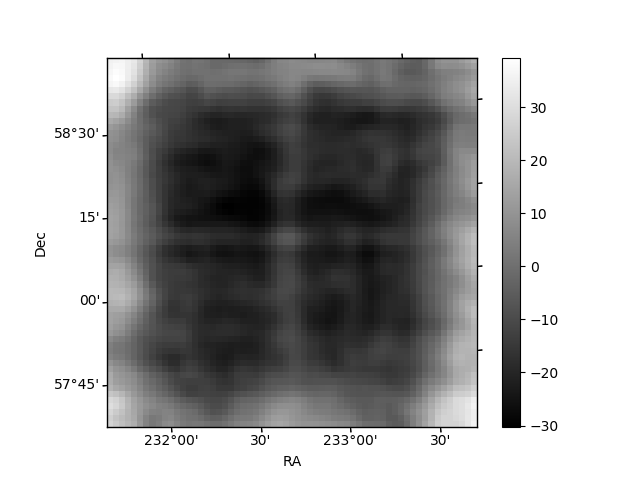
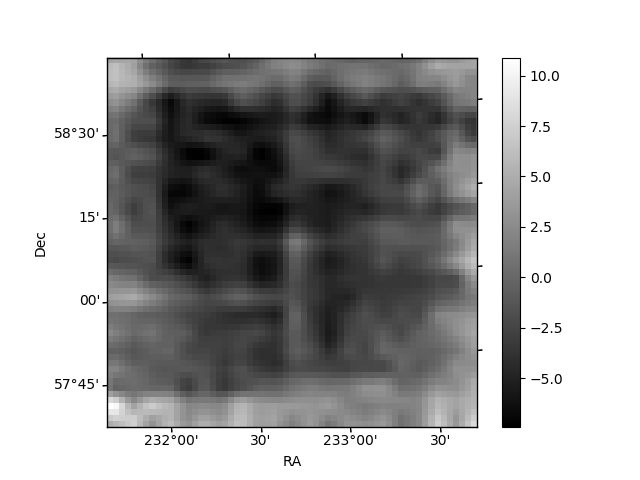
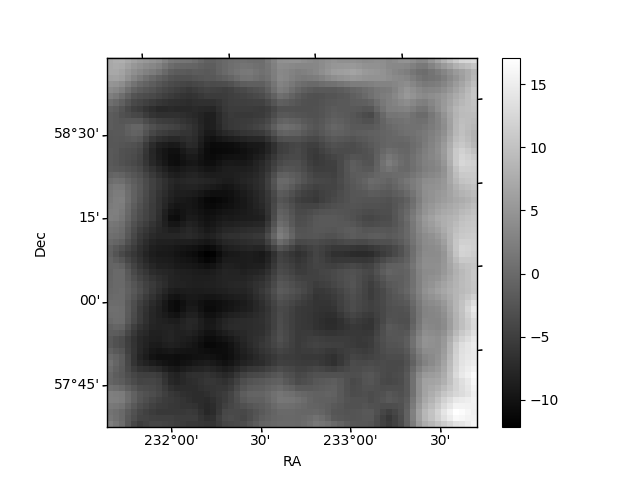
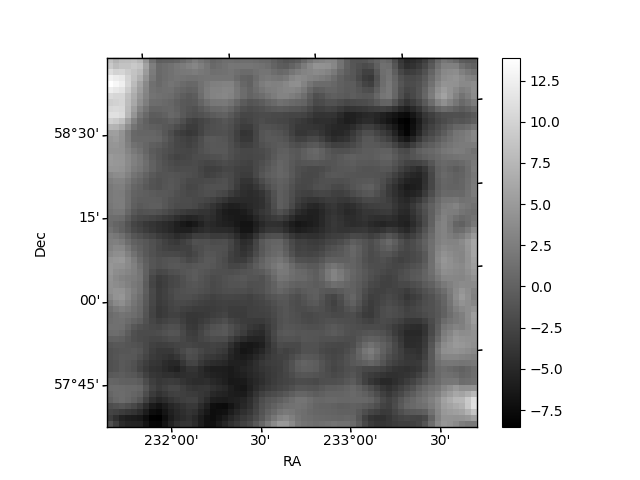
Histogram calculated using DETX and DETY for each event in the final _common_clean file
| Quadrant A | 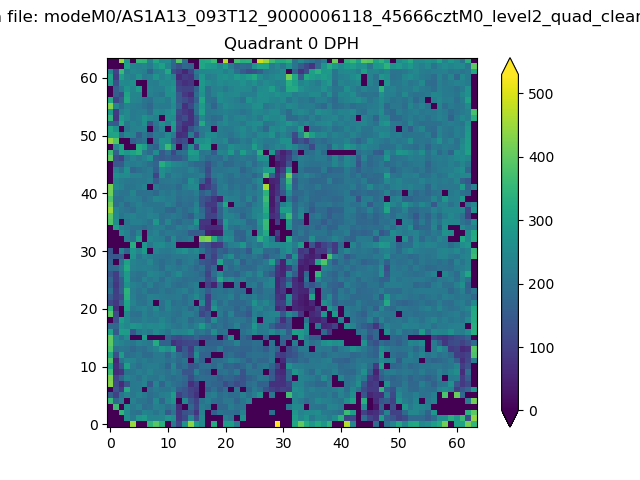 |
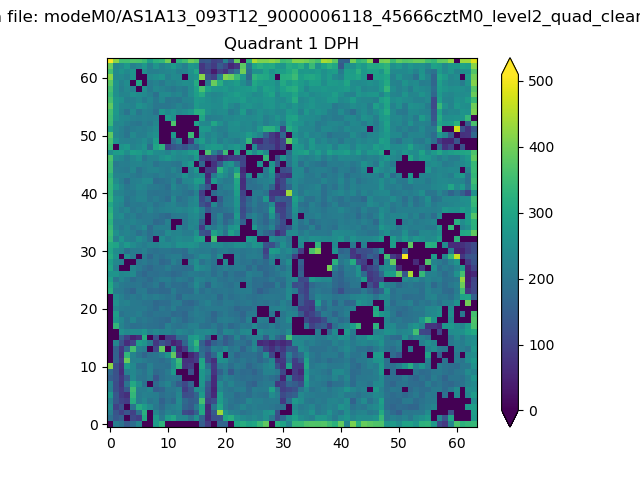 |
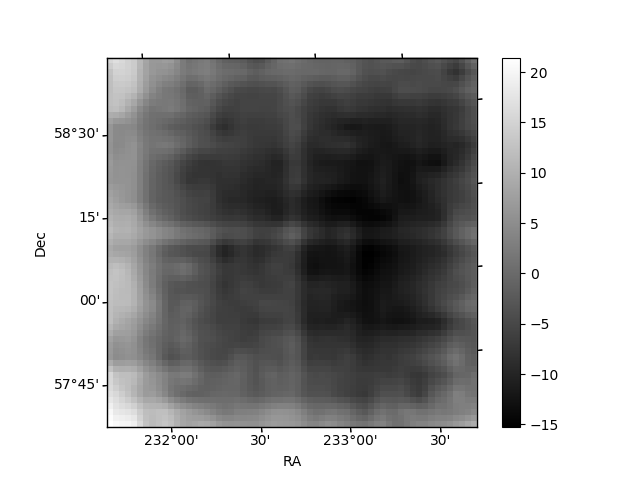
Quadrant B |
|---|---|---|---|
| Quadrant D | 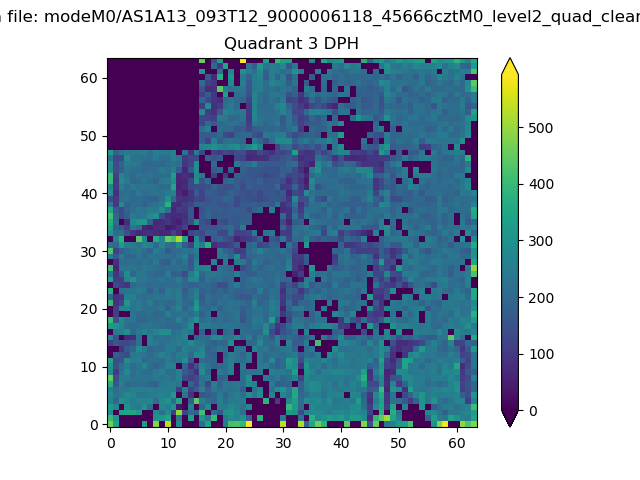 |
 |
Quadrant C |
| Plot type | Count rate plots | Images |
|---|---|---|
| Comparison with Poisson distribution Blue bars denote a histogram of data divided into 1 sec bins. Red curve is a Poisson curve with rate = median count rate of data. |
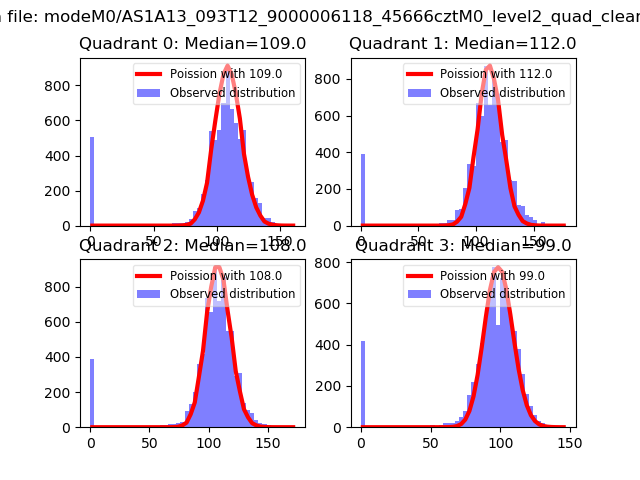 |
 |
| Quadrant-wise count rates Data is divided into 100 sec bins |
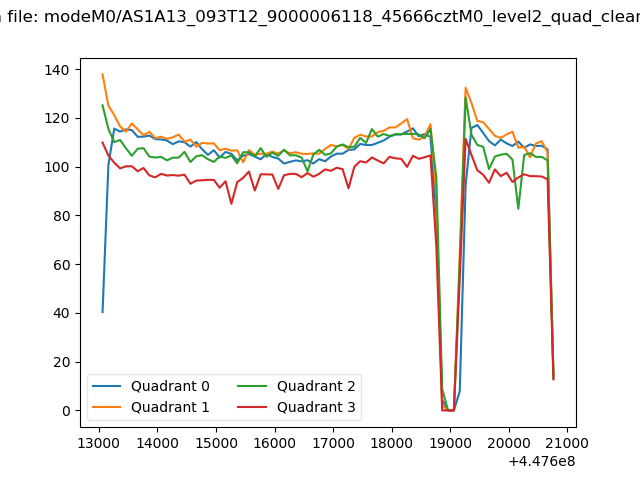 |
|
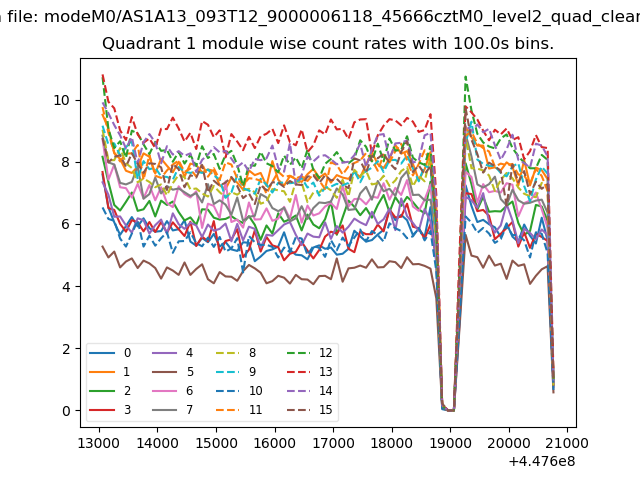
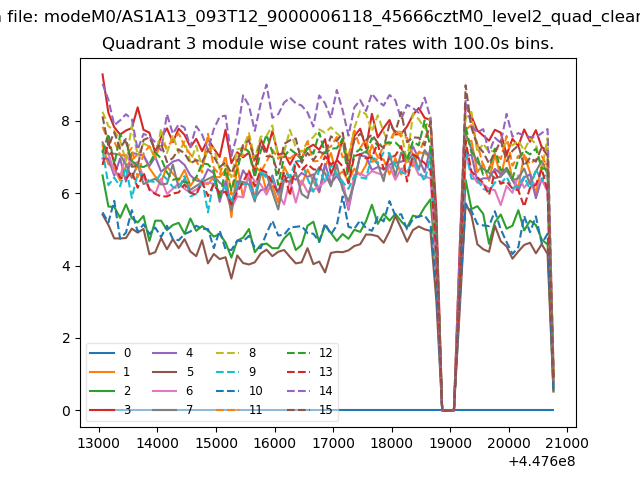
| Module-wise count rates for Quadrant A Data is divided into 100 sec bins |
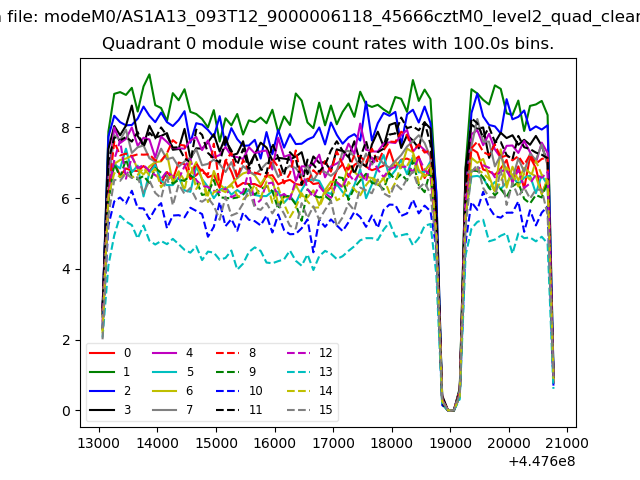 |
 |
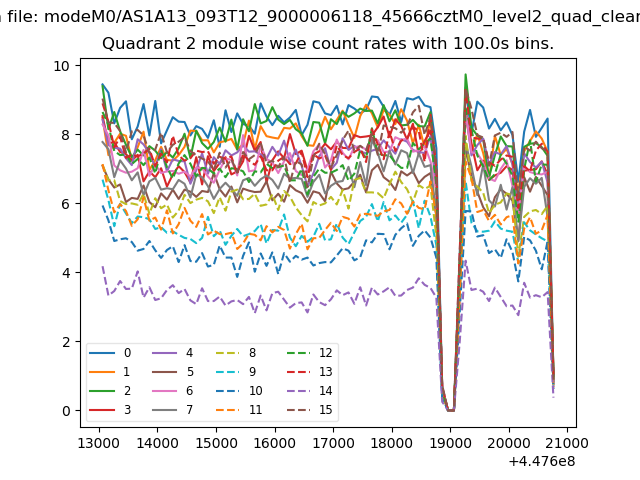
| Module-wise count rates for Quadrant B Data is divided into 100 sec bins |
 |
 |
| Module-wise count rates for Quadrant C Data is divided into 100 sec bins |
 |
 |
| Module-wise count rates for Quadrant D Data is divided into 100 sec bins |
 |
 |
| Parameter | Plot |
|---|---|
| CZT HV Monitor | 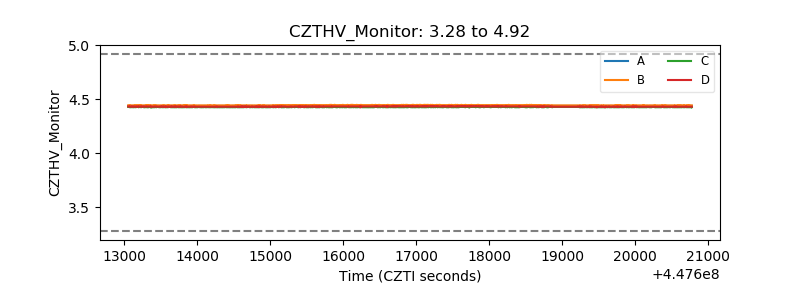 |
| D_VDD | 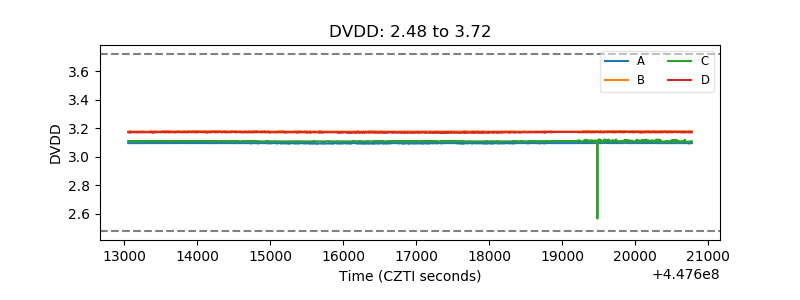 |
| Temperature 1 | 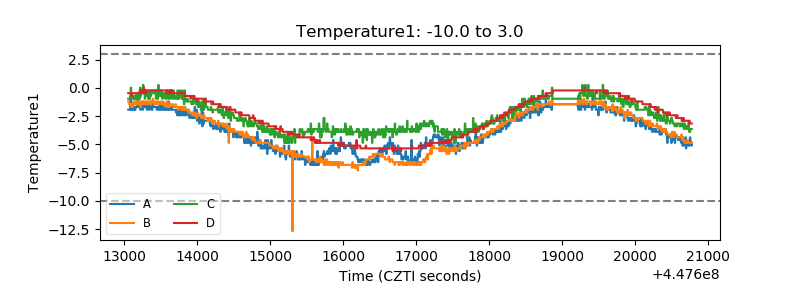 |
| Veto HV Monitor | 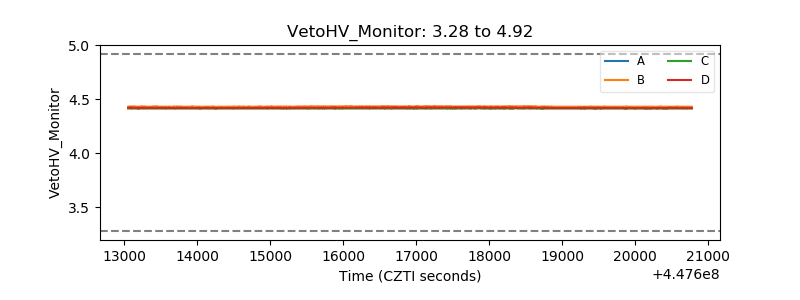 |
| Veto LLD | 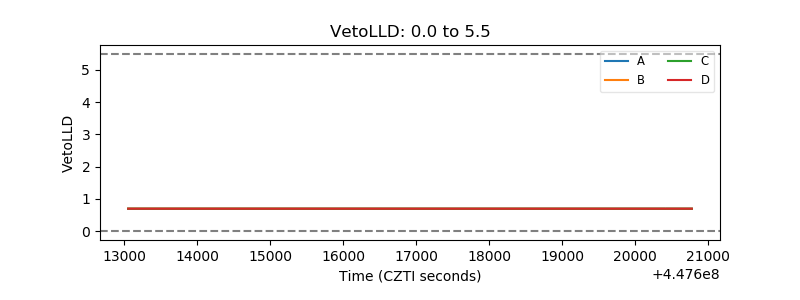 |
| Alpha Counter | 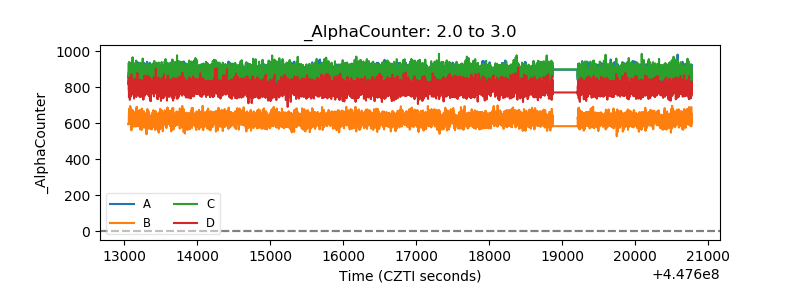 |
| _CPM_Rate | 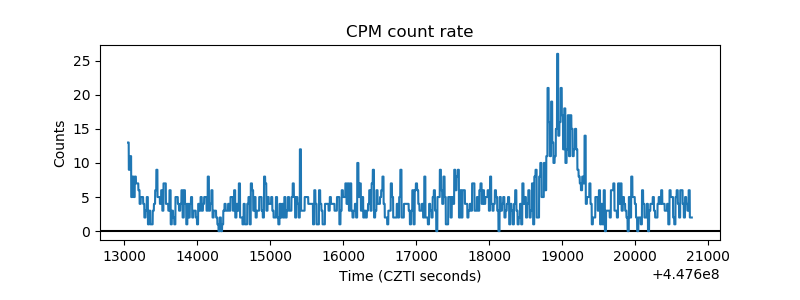 |
| CZT Counter | 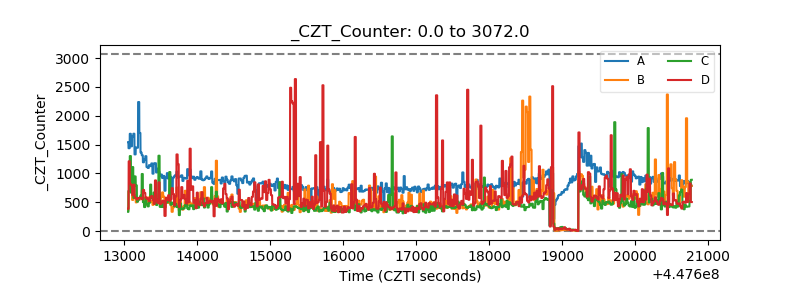 |
| +2.5 Volts monitor | 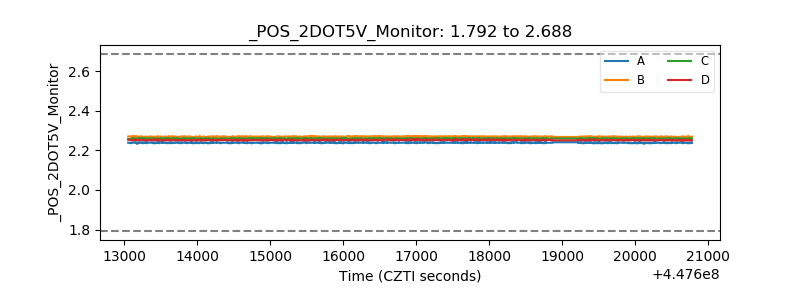 |
| +5 Volts monitor | 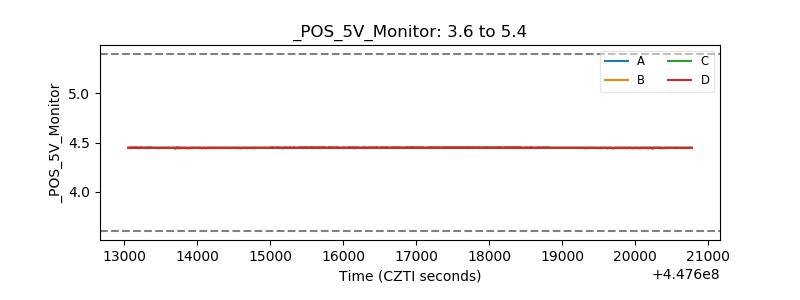 |
| _ROLL_ROT | 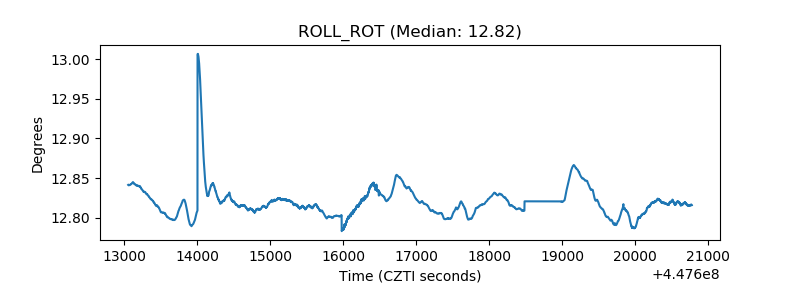 |
| _Roll_DEC | 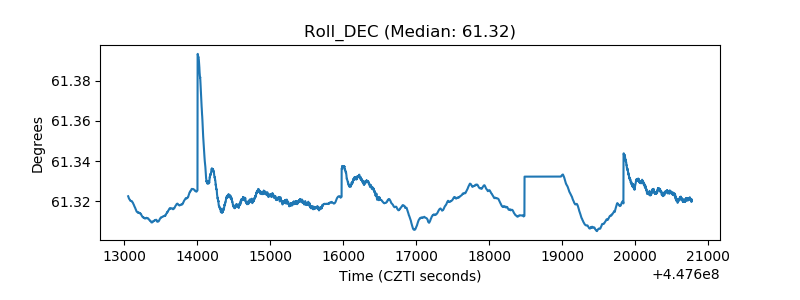 |
| _Roll_RA | 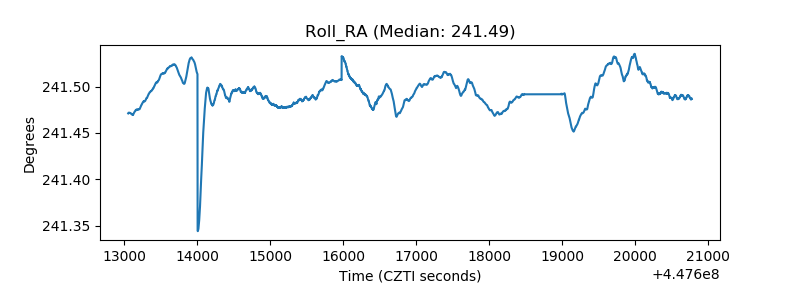 |
| Veto Counter | 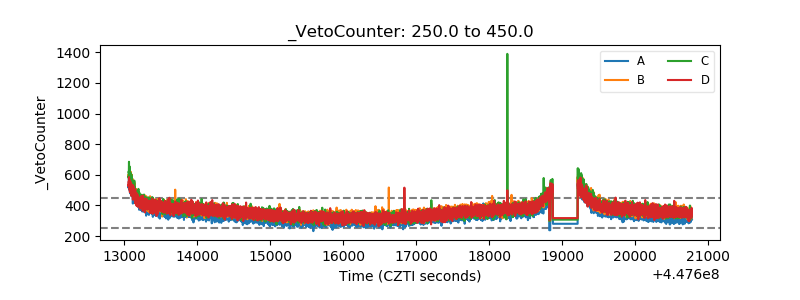 |