| Param | Original file | Final file |
|---|---|---|
| Filename | modeM0/AS1A13_093T12_9000006118_45667cztM0_level2.fits | modeM0/AS1A13_093T12_9000006118_45667cztM0_level2_quad_clean.evt |
| Size (bytes) | 570,208,320 | 126,578,880 |
| Size | 543.8 MB | 120.7 MB |
| Events in quadrant A | 6,674,881 | 840,235 |
| Events in quadrant B | 5,035,419 | 854,006 |
| Events in quadrant C | 4,119,992 | 831,119 |
| Events in quadrant D | 4,669,696 | 762,702 |
| Mode M0 | |||
|---|---|---|---|
| Quadrant | BADHDUFLAG | Total packets | Discarded packets |
| A | 0 | 25434 | 1 |
| B | 0 | 20423 | 1 |
| C | 0 | 17760 | 1 |
| D | 0 | 19297 | 1 |
| Mode SS | |||
|---|---|---|---|
| Quadrant | BADHDUFLAG | Total packets | Discarded packets |
| A | 0 | 156 | 0 |
| B | 0 | 156 | 0 |
| C | 0 | 156 | 0 |
| D | 0 | 156 | 0 |
| Mode M9 | |||
|---|---|---|---|
| Quadrant | BADHDUFLAG | Total packets | Discarded packets |
| A | 0 | 1 | 0 |
| B | 0 | 2 | 0 |
| C | 0 | 2 | 0 |
| D | 0 | 2 | 0 |
| Quadrant | Total seconds | Saturated seconds | Saturation percentage |
|---|---|---|---|
| A | 7833 | 178 | 2.272437% |
| B | 7833 | 332 | 4.238478% |
| C | 7833 | 128 | 1.634112% |
| D | 7832 | 110 | 1.404494% |
Noise dominated data is calculated using 1-second bins in cleaned event files. If a bin has >2000 counts, and if more than 50% of those come from <1% of pixels, then it is considered to be noise-dominated and hence unusable.
| Quadrant | # 1 sec bins | Bins with >0 counts | Bins with >2000 counts | High rate bins dominated by noise | Noise dominated (total time) | Noise dominated (detector-on time) | Marked lightcurve |
|---|---|---|---|---|---|---|---|
| A | 7833 | 7833 | 0 | 0 | 0.00% | 0.00% | 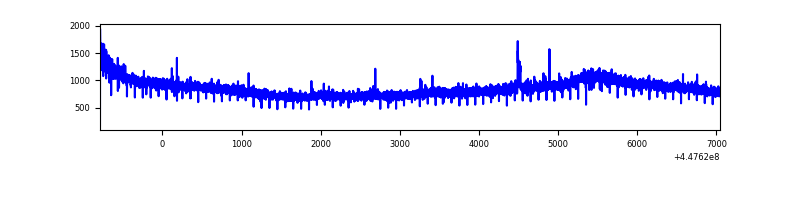 |
| B | 7833 | 7833 | 215 | 215 | 2.74% | 2.74% | 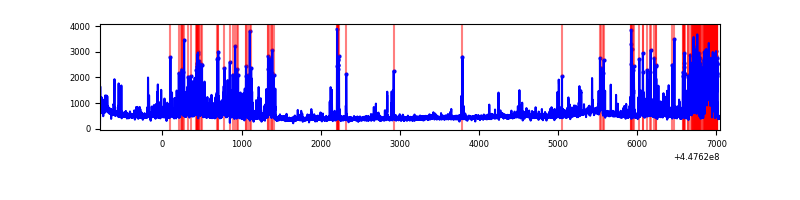 |
| C | 7833 | 7833 | 105 | 105 | 1.34% | 1.34% | 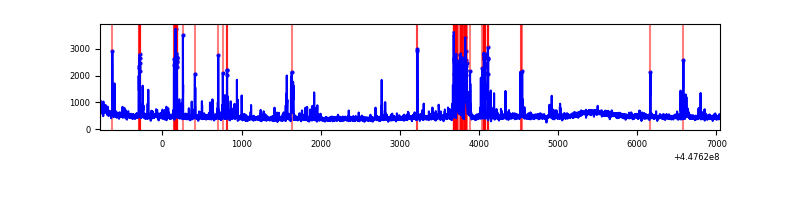 |
| D | 7832 | 7832 | 73 | 73 | 0.93% | 0.93% | 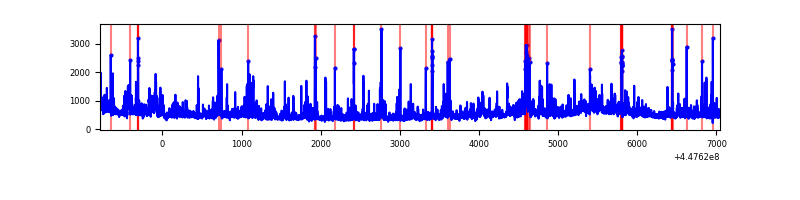 |
Top three noisy pixels from each quadrant. If the there are fewer than three noisy pixels in the level2.evt file, extra rows are filled as -1
| Pixel properties | Quadrant properties | ||||||
|---|---|---|---|---|---|---|---|
| Quadrant | DetID | PixID | Counts | Sigma | Mean | Median | Sigma |
| A | 10 | 83 | 3241308 | 17739.34 | 876 | 856 | 182.7 |
| A | 0 | 247 | 14828 | 76.49 | 876 | 856 | 182.7 |
| A | 0 | 243 | 10468 | 52.62 | 876 | 856 | 182.7 |
| B | 12 | 16 | 1073825 | 6324.08 | 868 | 839 | 169.7 |
| B | 3 | 112 | 132036 | 773.26 | 868 | 839 | 169.7 |
| B | 5 | 172 | 77720 | 453.13 | 868 | 839 | 169.7 |
| C | 14 | 254 | 509918 | 2517.82 | 864 | 869 | 202.2 |
| C | 9 | 54 | 186944 | 920.35 | 864 | 869 | 202.2 |
| C | 2 | 14 | 19468 | 91.99 | 864 | 869 | 202.2 |
| D | 1 | 52 | 620472 | 2827.11 | 865 | 837 | 219.2 |
| D | 13 | 249 | 220227 | 1000.98 | 865 | 837 | 219.2 |
| D | 2 | 249 | 113831 | 515.54 | 865 | 837 | 219.2 |
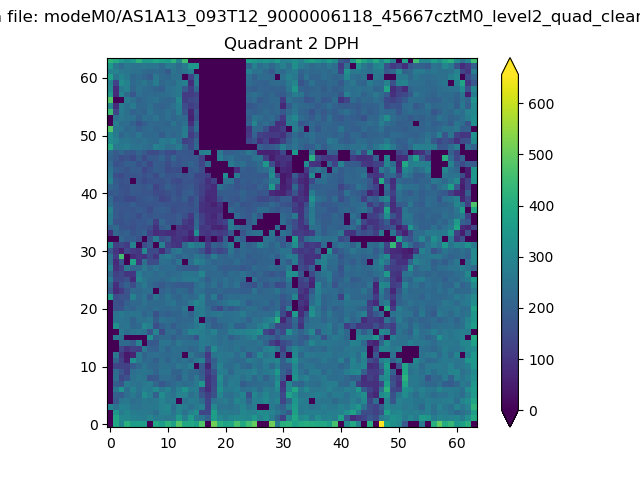
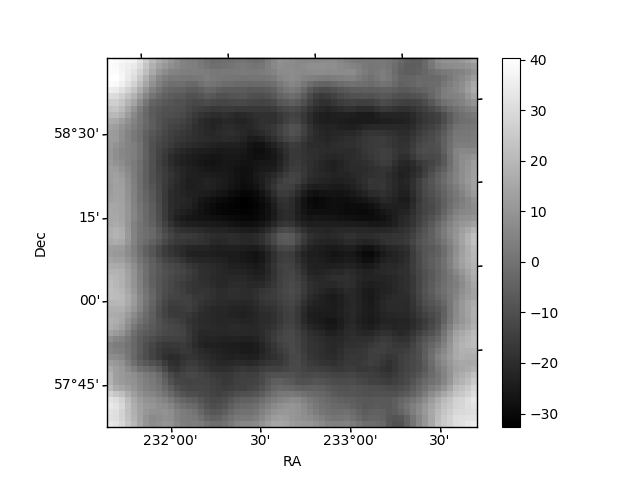
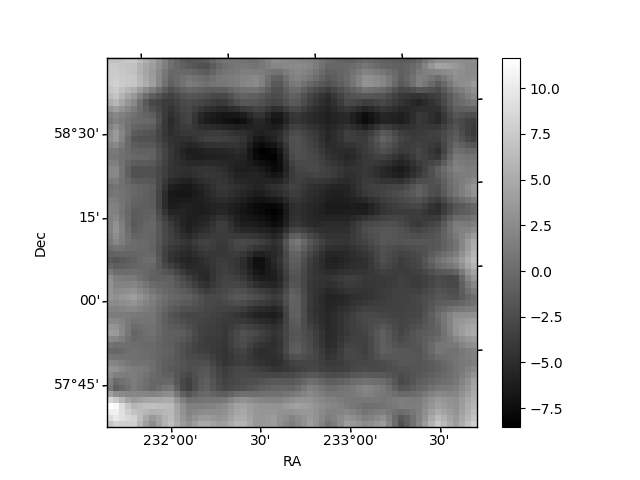
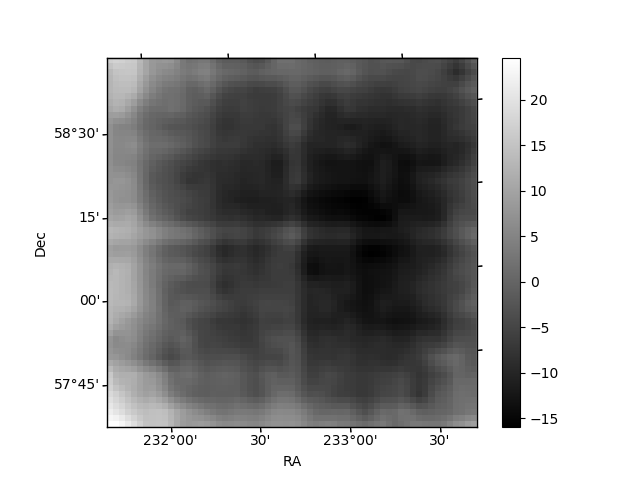
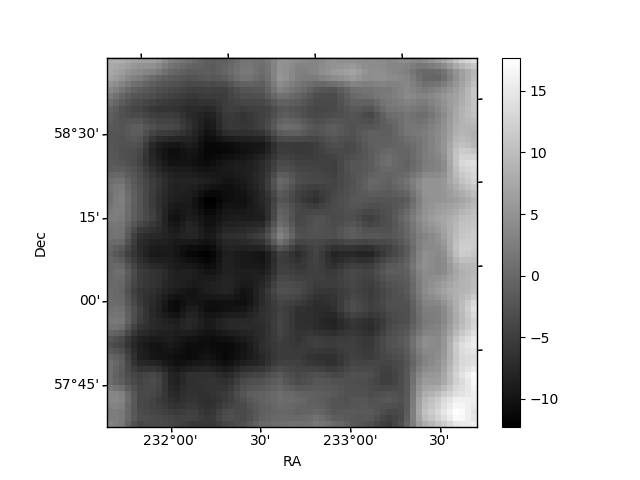
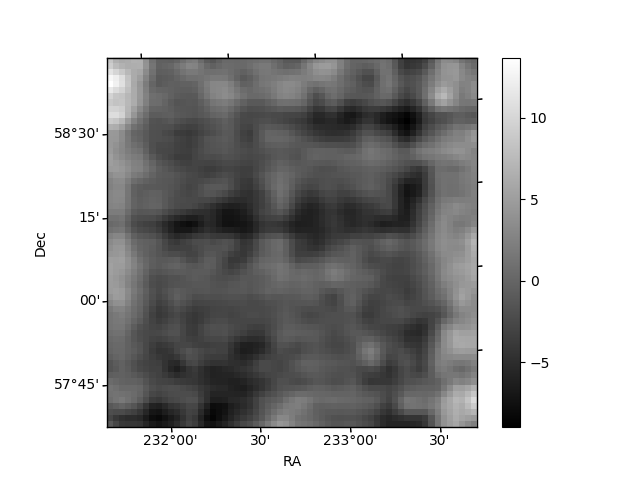
Histogram calculated using DETX and DETY for each event in the final _common_clean file
| Quadrant A | 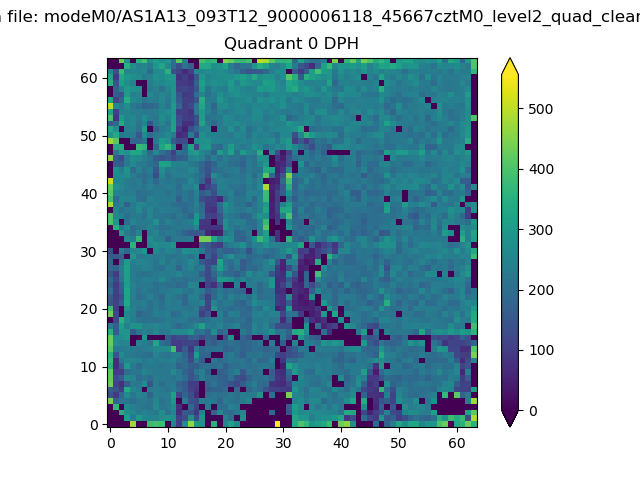 |
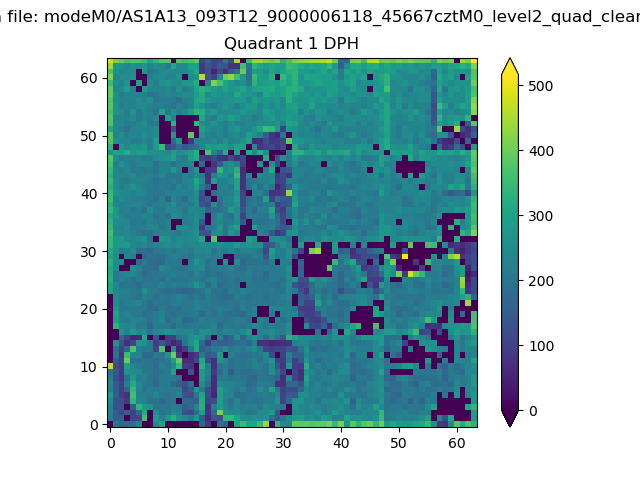 |
Quadrant B |
|---|---|---|---|
| Quadrant D | 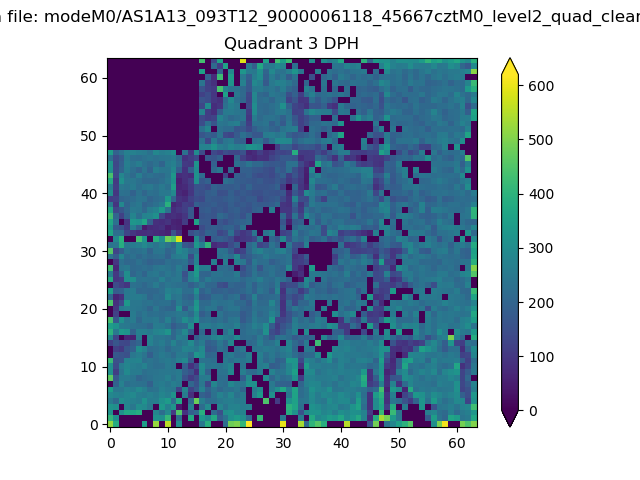 |
 |
Quadrant C |
| Plot type | Count rate plots | Images |
|---|---|---|
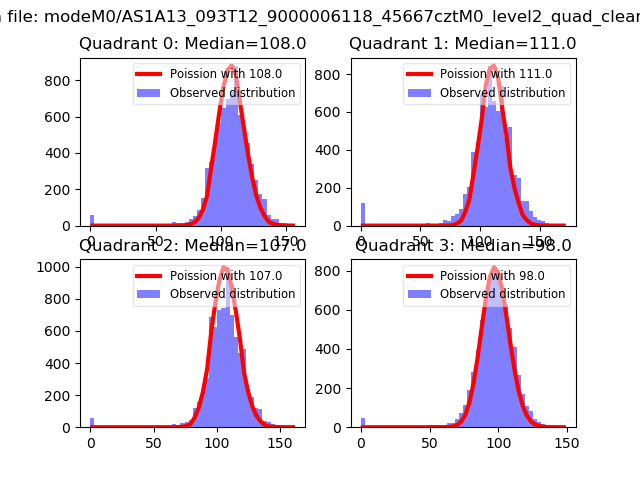
| Comparison with Poisson distribution Blue bars denote a histogram of data divided into 1 sec bins. Red curve is a Poisson curve with rate = median count rate of data. |
 |
 |
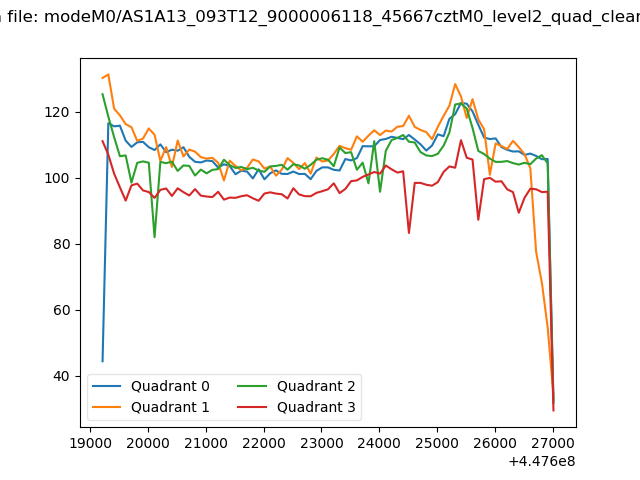
| Quadrant-wise count rates Data is divided into 100 sec bins |
 |
|
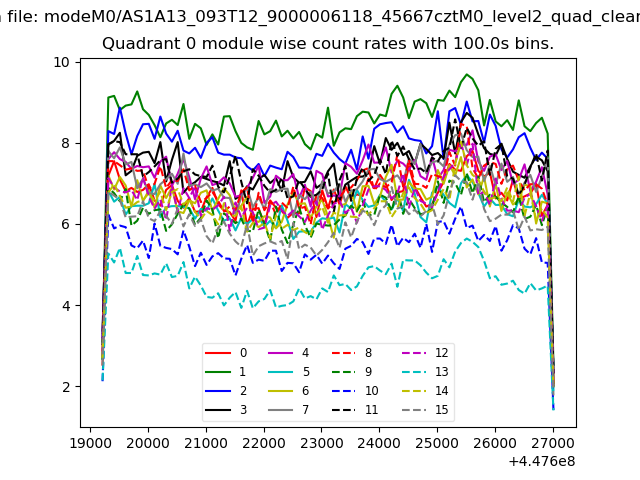
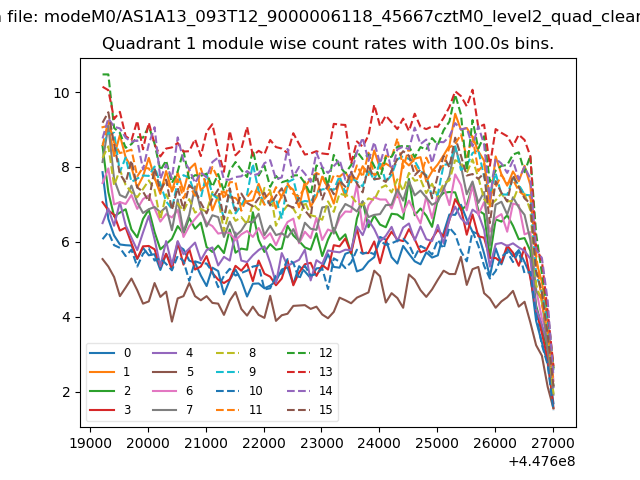
| Module-wise count rates for Quadrant A Data is divided into 100 sec bins |
 |
 |
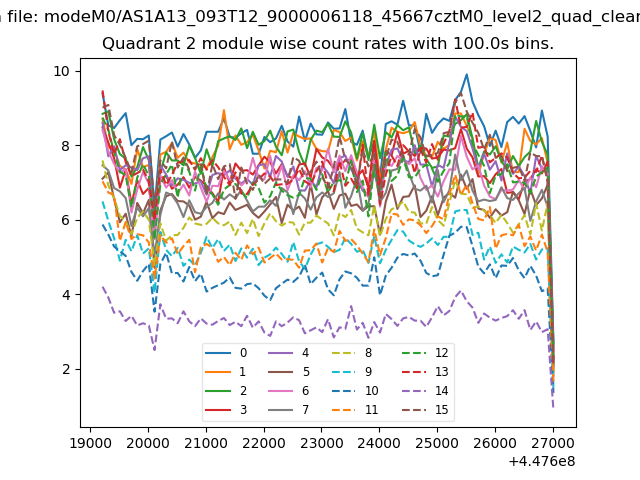
| Module-wise count rates for Quadrant B Data is divided into 100 sec bins |
 |
 |
| Module-wise count rates for Quadrant C Data is divided into 100 sec bins |
 |
 |
| Module-wise count rates for Quadrant D Data is divided into 100 sec bins |
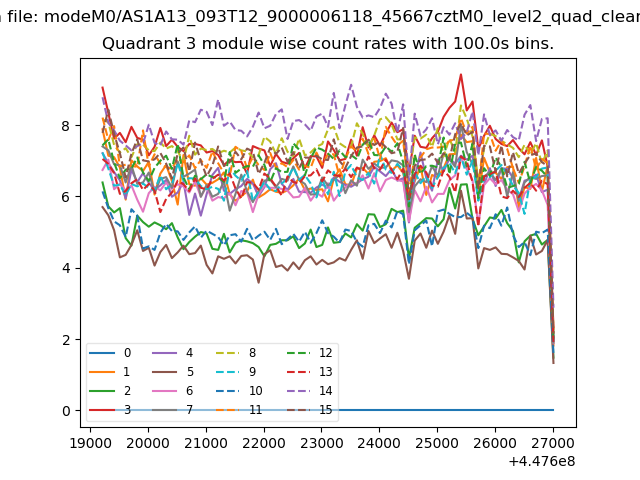 |
 |
| Parameter | Plot |
|---|---|
| CZT HV Monitor | 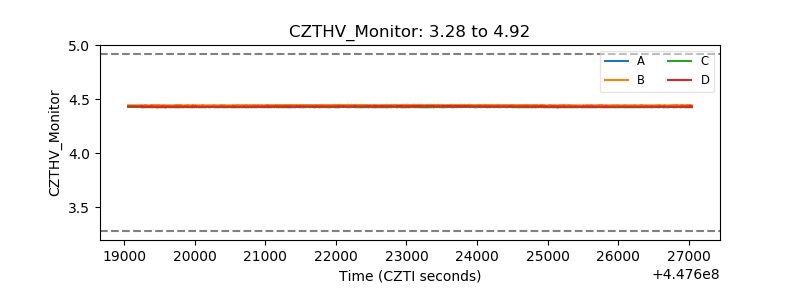 |
| D_VDD | 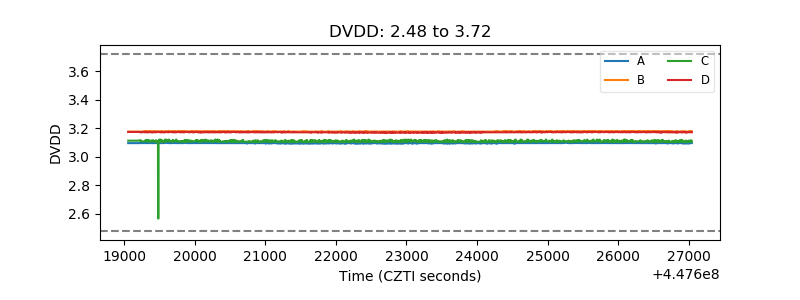 |
| Temperature 1 | 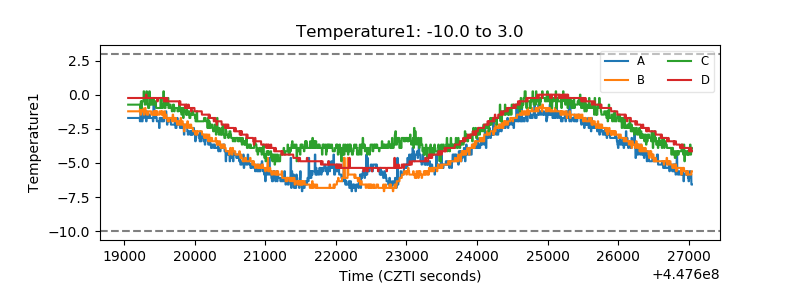 |
| Veto HV Monitor | 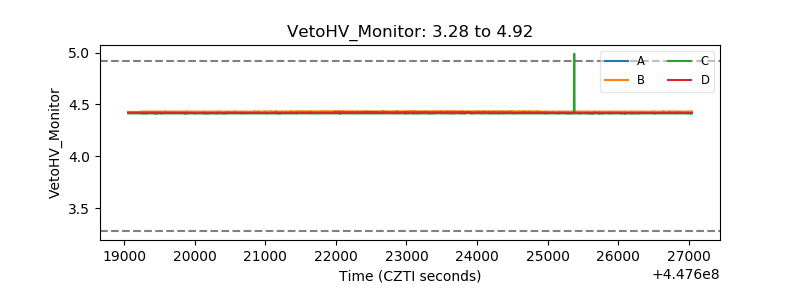 |
| Veto LLD | 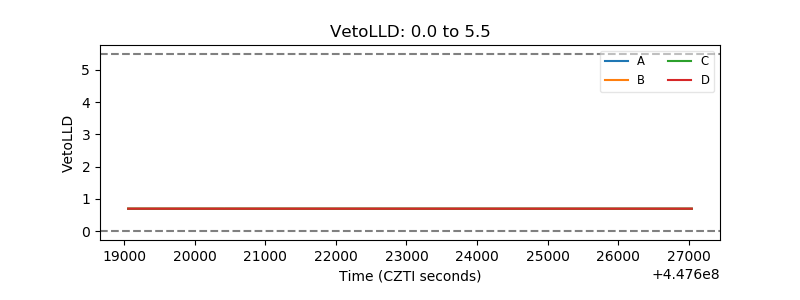 |
| Alpha Counter | 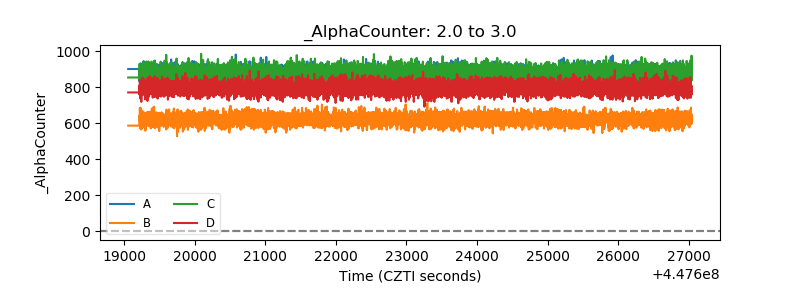 |
| _CPM_Rate | 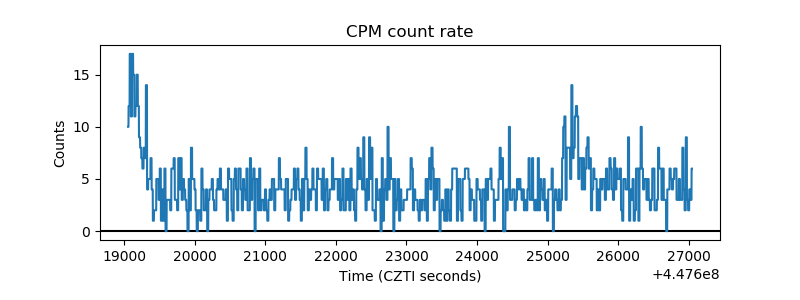 |
| CZT Counter | 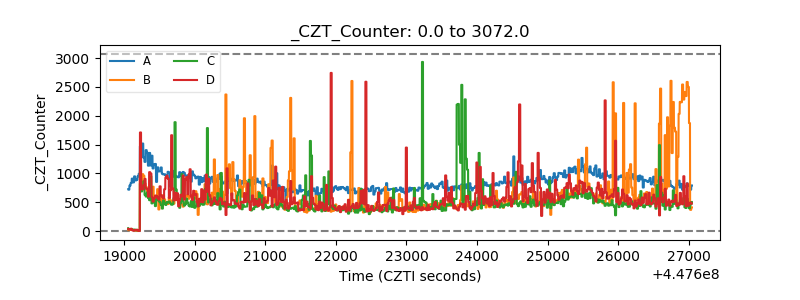 |
| +2.5 Volts monitor | 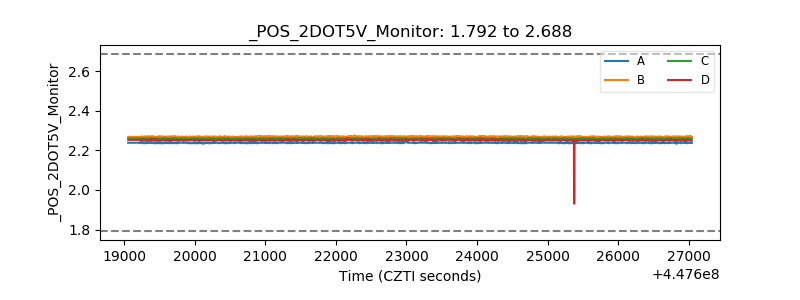 |
| +5 Volts monitor | 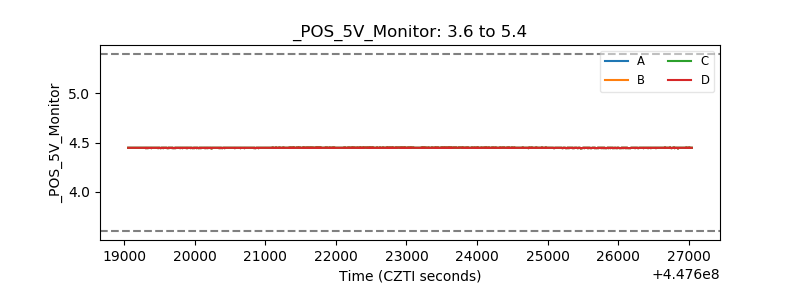 |
| _ROLL_ROT | 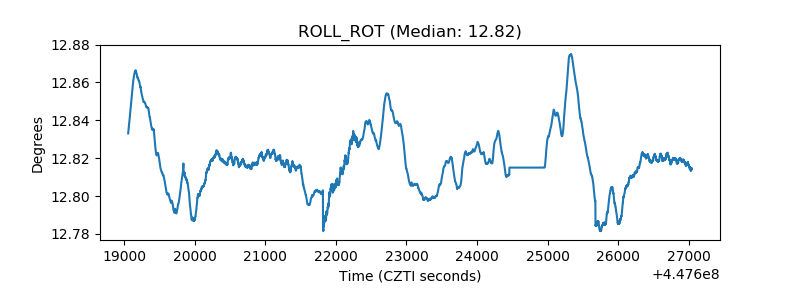 |
| _Roll_DEC | 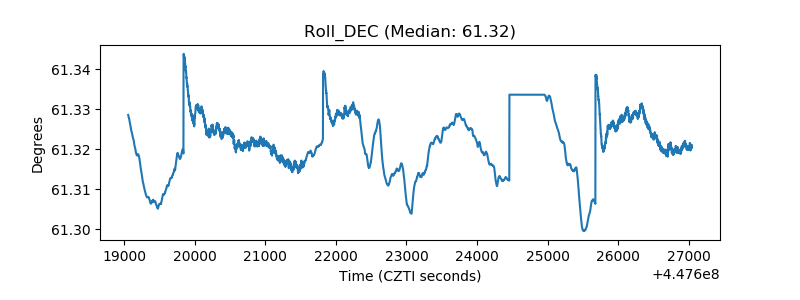 |
| _Roll_RA | 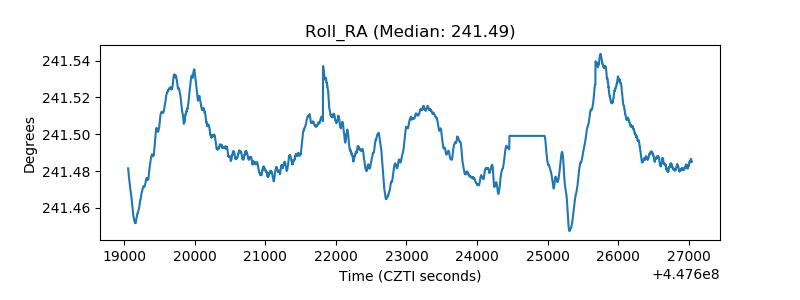 |
| Veto Counter | 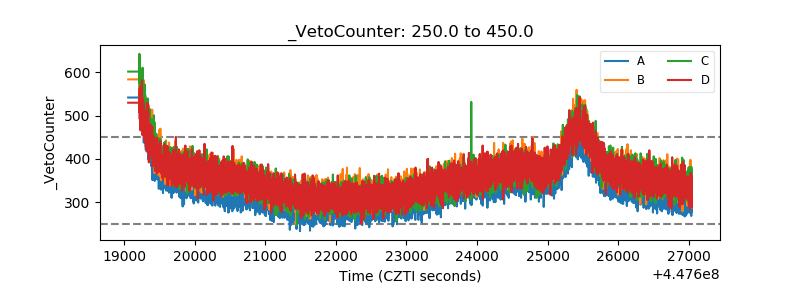 |