| Param | Original file | Final file |
|---|---|---|
| Filename | modeM0/AS1A13_093T12_9000006118_45668cztM0_level2.fits | modeM0/AS1A13_093T12_9000006118_45668cztM0_level2_quad_clean.evt |
| Size (bytes) | 594,789,120 | 138,548,160 |
| Size | 567.2 MB | 132.1 MB |
| Events in quadrant A | 7,157,178 | 928,698 |
| Events in quadrant B | 4,999,271 | 932,092 |
| Events in quadrant C | 4,171,939 | 915,386 |
| Events in quadrant D | 5,025,710 | 824,875 |
| Mode M0 | |||
|---|---|---|---|
| Quadrant | BADHDUFLAG | Total packets | Discarded packets |
| A | 0 | 27547 | 0 |
| B | 0 | 20921 | 1 |
| C | 0 | 18627 | 0 |
| D | 0 | 20991 | 0 |
| Mode SS | |||
|---|---|---|---|
| Quadrant | BADHDUFLAG | Total packets | Discarded packets |
| A | 0 | 170 | 0 |
| B | 0 | 170 | 0 |
| C | 0 | 170 | 0 |
| D | 0 | 170 | 0 |
| Quadrant | Total seconds | Saturated seconds | Saturation percentage |
|---|---|---|---|
| A | 8554 | 110 | 1.285948% |
| B | 8554 | 298 | 3.483750% |
| C | 8554 | 72 | 0.841711% |
| D | 8554 | 186 | 2.174421% |
Noise dominated data is calculated using 1-second bins in cleaned event files. If a bin has >2000 counts, and if more than 50% of those come from <1% of pixels, then it is considered to be noise-dominated and hence unusable.
| Quadrant | # 1 sec bins | Bins with >0 counts | Bins with >2000 counts | High rate bins dominated by noise | Noise dominated (total time) | Noise dominated (detector-on time) | Marked lightcurve |
|---|---|---|---|---|---|---|---|
| A | 8554 | 8554 | 1 | 1 | 0.01% | 0.01% | 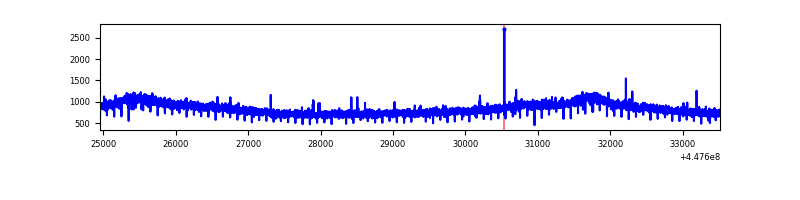 |
| B | 8554 | 8554 | 183 | 183 | 2.14% | 2.14% | 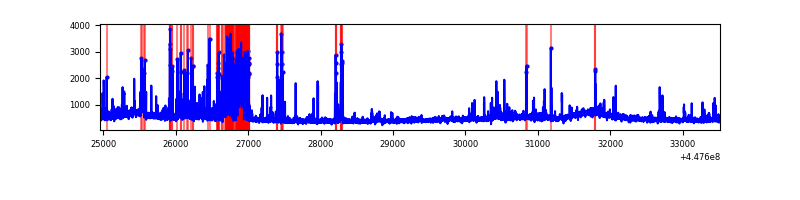 |
| C | 8554 | 8554 | 47 | 47 | 0.55% | 0.55% |  |
| D | 8554 | 8554 | 139 | 139 | 1.62% | 1.62% | 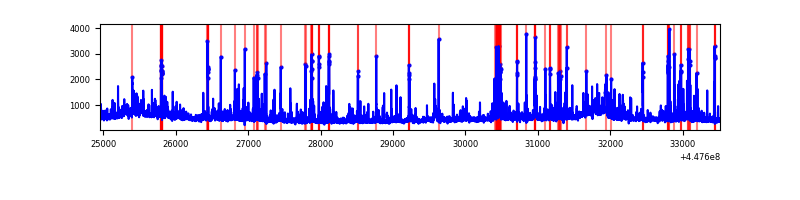 |
Top three noisy pixels from each quadrant. If the there are fewer than three noisy pixels in the level2.evt file, extra rows are filled as -1
| Pixel properties | Quadrant properties | ||||||
|---|---|---|---|---|---|---|---|
| Quadrant | DetID | PixID | Counts | Sigma | Mean | Median | Sigma |
| A | 10 | 83 | 3379508 | 16673.81 | 965 | 943 | 202.6 |
| A | 13 | 254 | 11275 | 50.99 | 965 | 943 | 202.6 |
| A | 3 | 137 | 11236 | 50.8 | 965 | 943 | 202.6 |
| B | 12 | 16 | 627798 | 3331.67 | 961 | 930 | 188.2 |
| B | 5 | 172 | 160531 | 848.24 | 961 | 930 | 188.2 |
| B | 3 | 112 | 127194 | 671.07 | 961 | 930 | 188.2 |
| C | 2 | 14 | 223902 | 989.22 | 957 | 962 | 225.4 |
| C | 14 | 254 | 164237 | 724.48 | 957 | 962 | 225.4 |
| C | 9 | 54 | 27392 | 117.27 | 957 | 962 | 225.4 |
| D | 1 | 52 | 460262 | 1919.52 | 947 | 917 | 239.3 |
| D | 13 | 249 | 297747 | 1240.4 | 947 | 917 | 239.3 |
| D | 2 | 249 | 147035 | 610.6 | 947 | 917 | 239.3 |
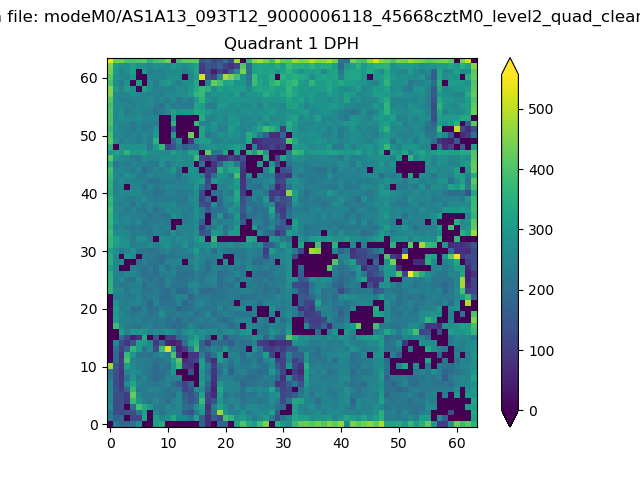
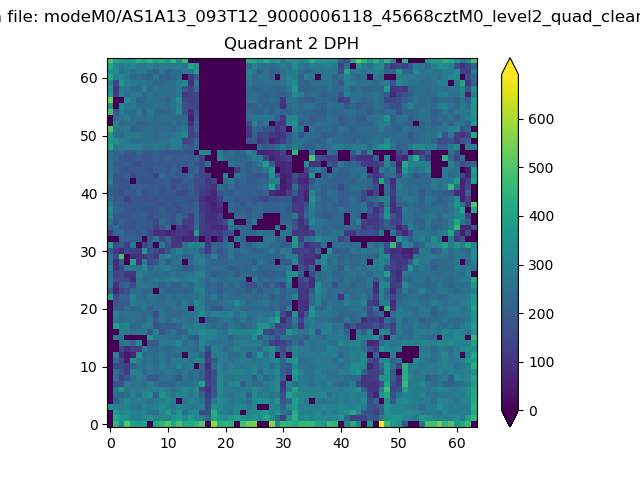
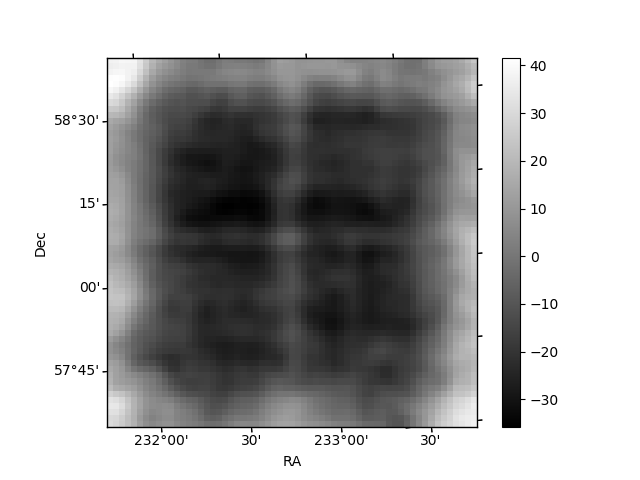
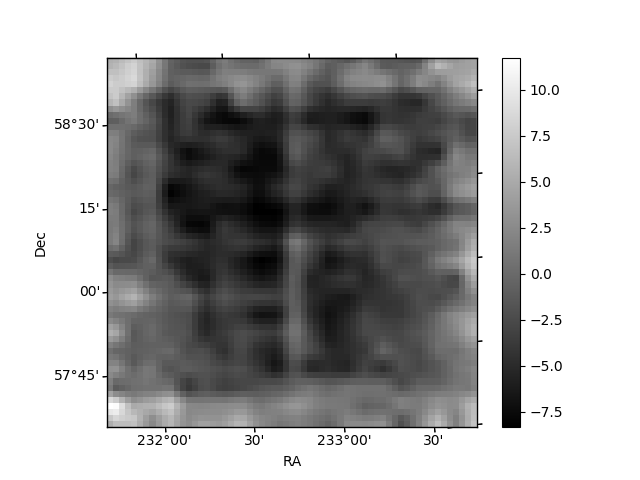
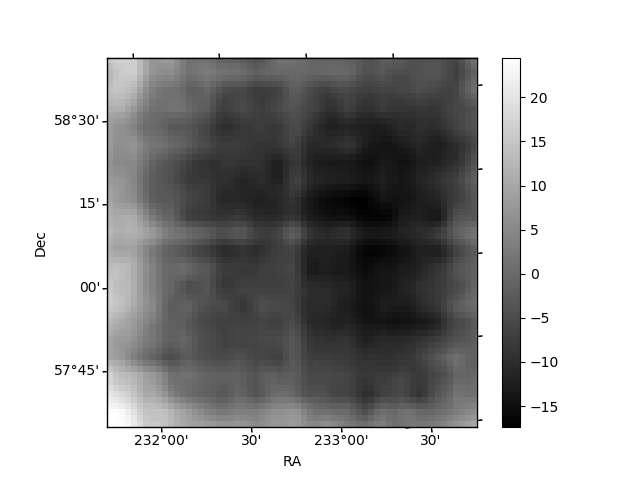
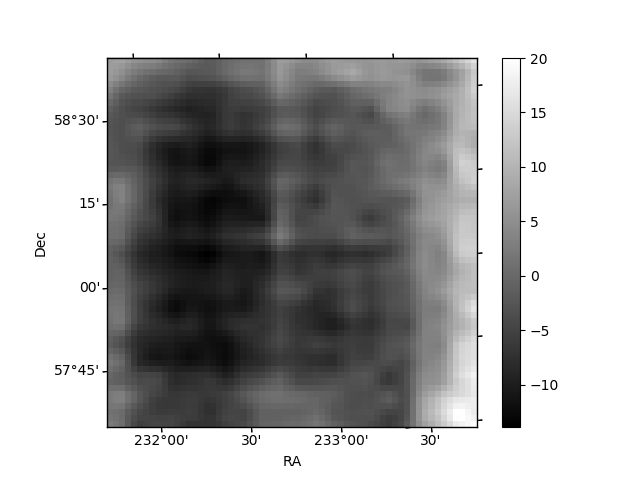
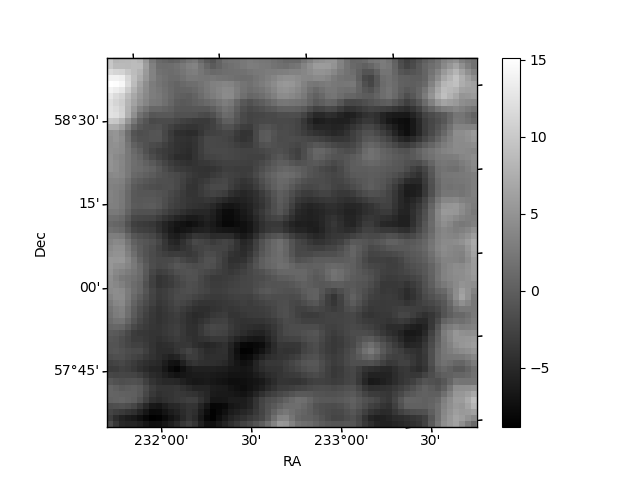
Histogram calculated using DETX and DETY for each event in the final _common_clean file
| Quadrant A | 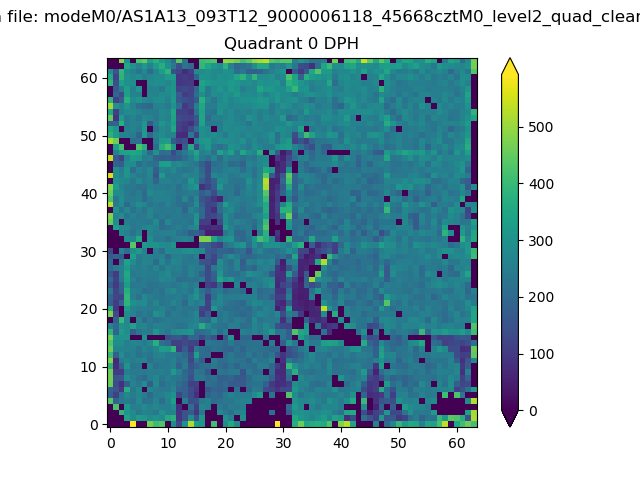 |
 |
Quadrant B |
|---|---|---|---|
| Quadrant D | 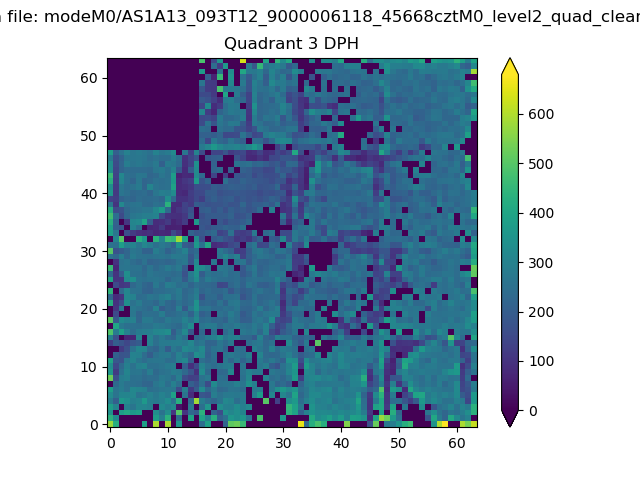 |
 |
Quadrant C |
| Plot type | Count rate plots | Images |
|---|---|---|
| Comparison with Poisson distribution Blue bars denote a histogram of data divided into 1 sec bins. Red curve is a Poisson curve with rate = median count rate of data. |
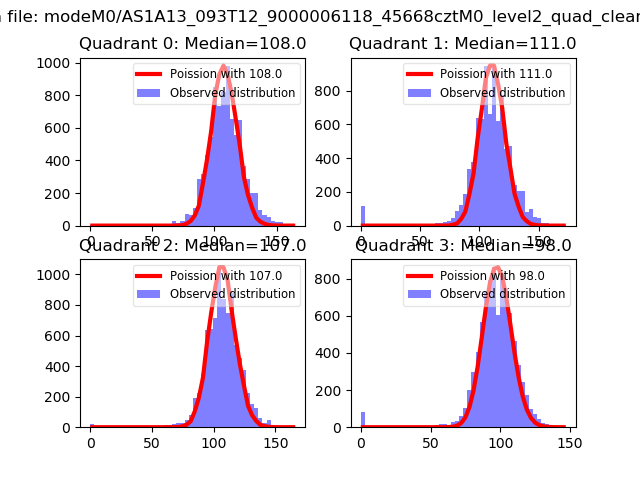 |
 |
| Quadrant-wise count rates Data is divided into 100 sec bins |
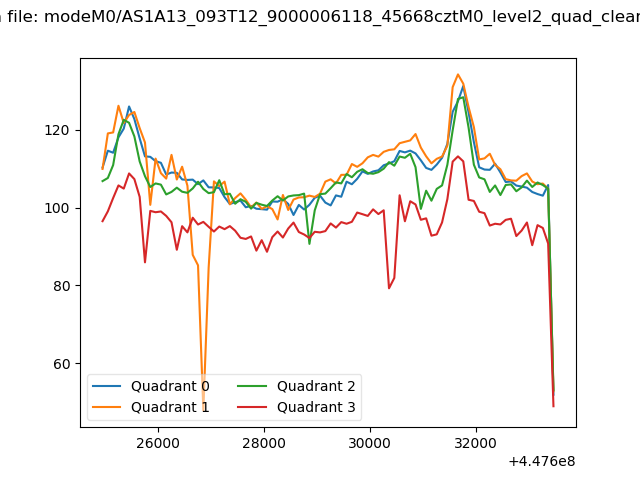 |
|
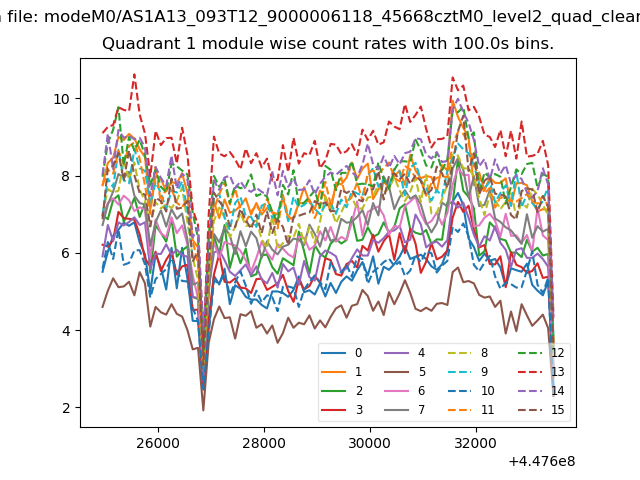
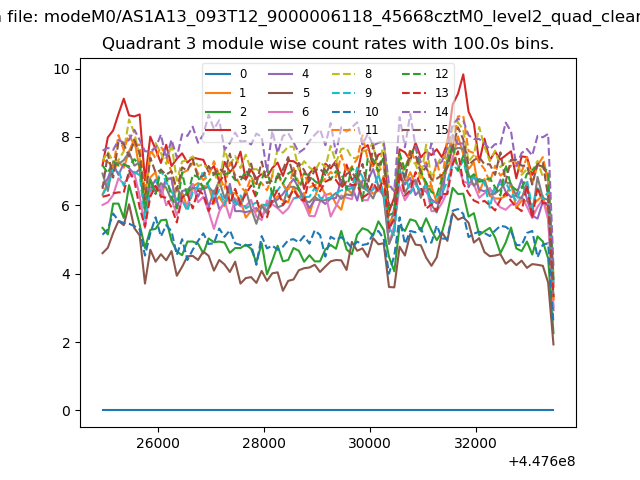
| Module-wise count rates for Quadrant A Data is divided into 100 sec bins |
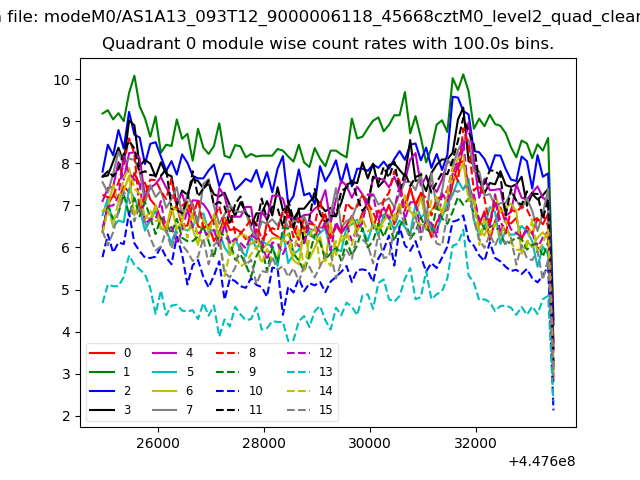 |
 |
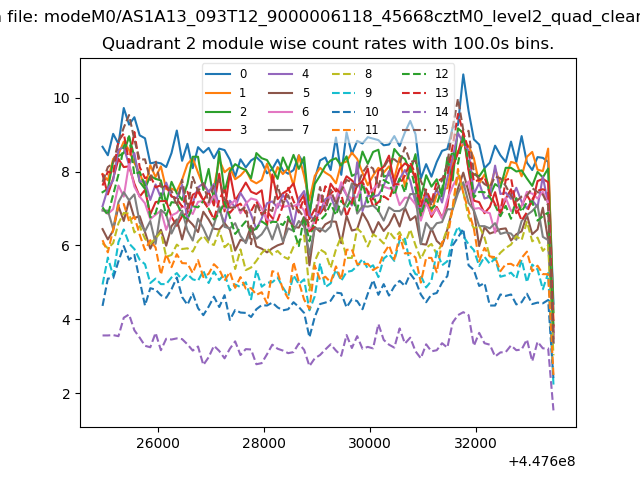
| Module-wise count rates for Quadrant B Data is divided into 100 sec bins |
 |
 |
| Module-wise count rates for Quadrant C Data is divided into 100 sec bins |
 |
 |
| Module-wise count rates for Quadrant D Data is divided into 100 sec bins |
 |
 |
| Parameter | Plot |
|---|---|
| CZT HV Monitor | 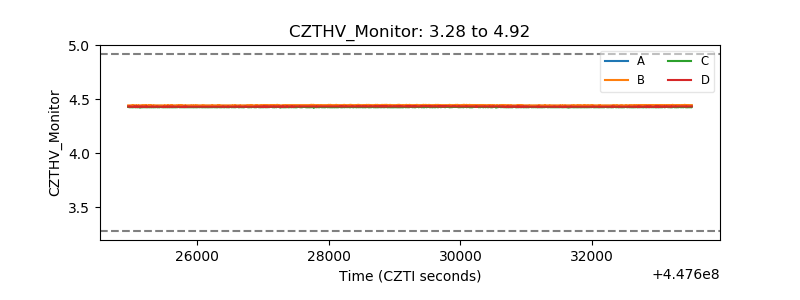 |
| D_VDD | 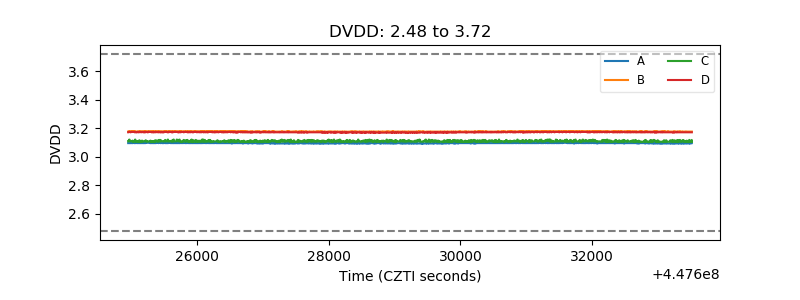 |
| Temperature 1 | 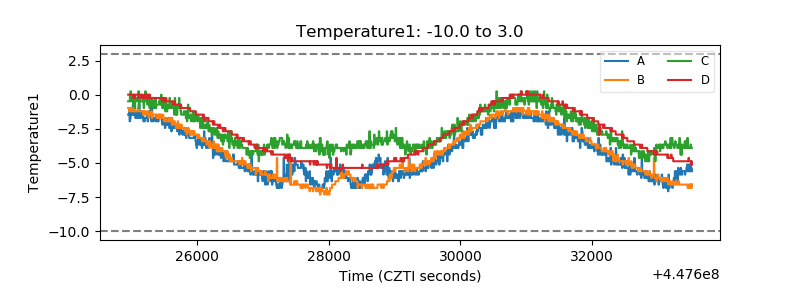 |
| Veto HV Monitor | 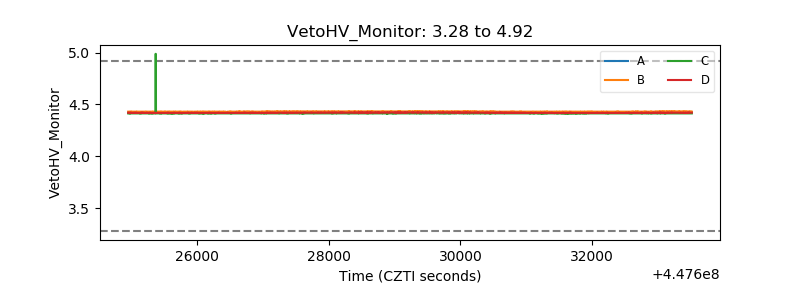 |
| Veto LLD | 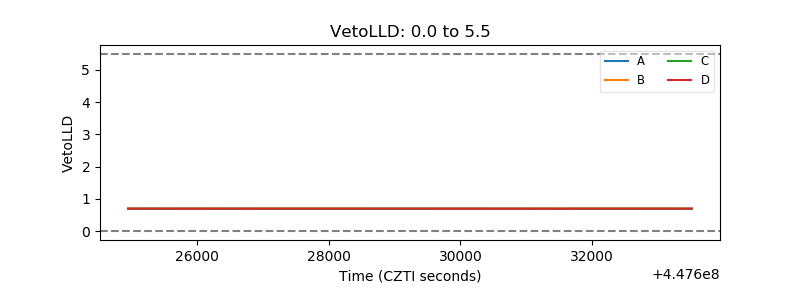 |
| Alpha Counter | 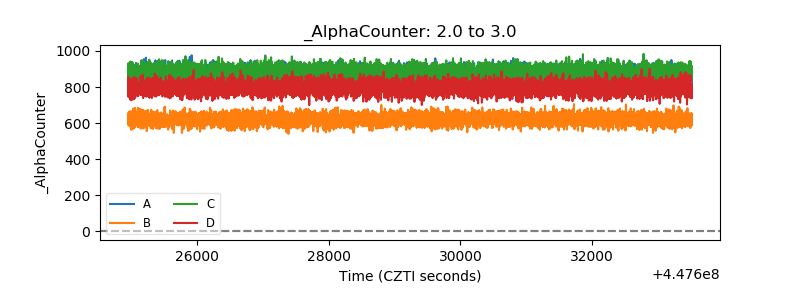 |
| _CPM_Rate | 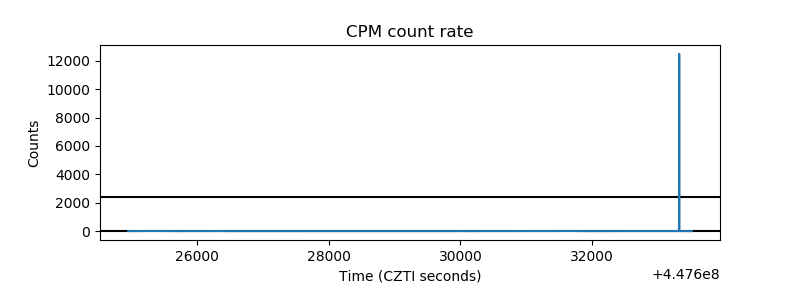 |
| CZT Counter | 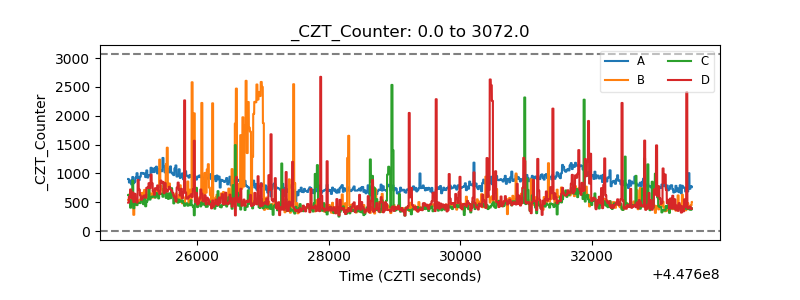 |
| +2.5 Volts monitor | 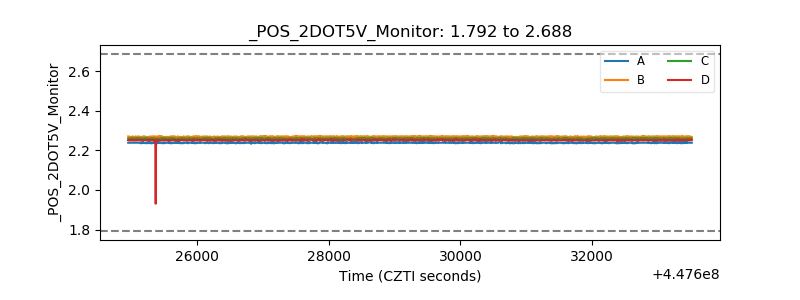 |
| +5 Volts monitor | 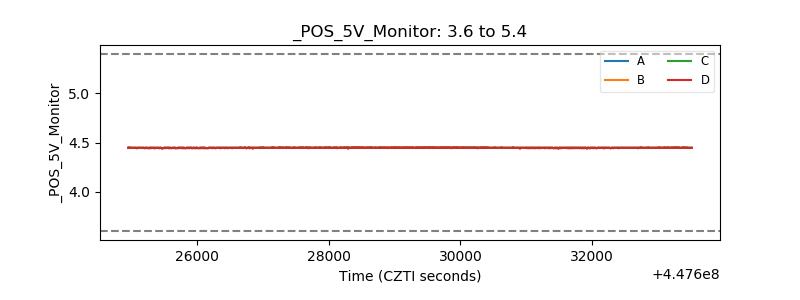 |
| _ROLL_ROT | 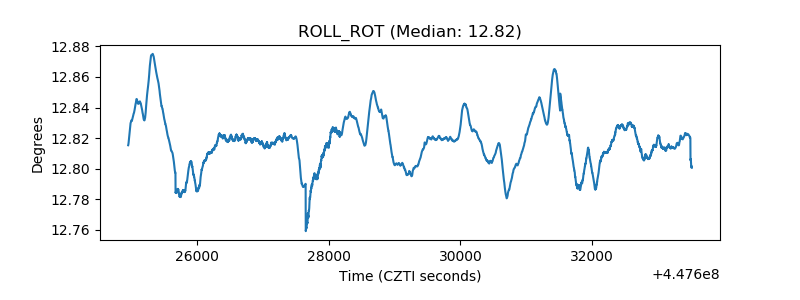 |
| _Roll_DEC | 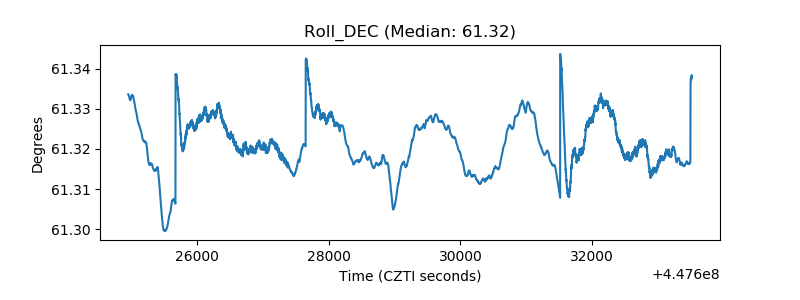 |
| _Roll_RA | 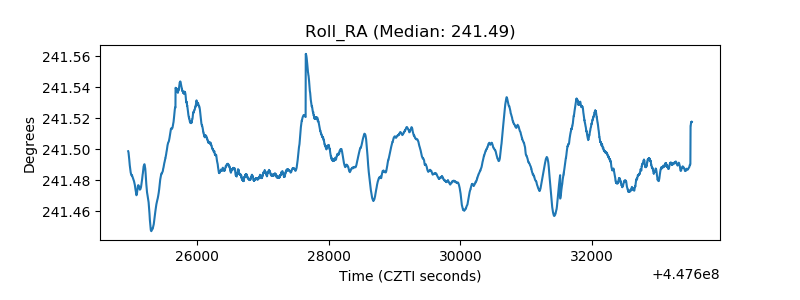 |
| Veto Counter | 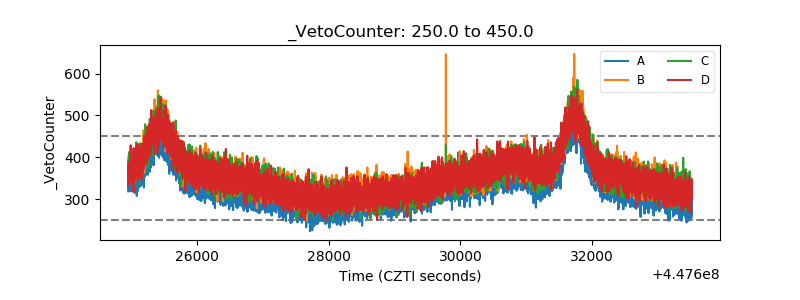 |