| Param | Original file | Final file |
|---|---|---|
| Filename | modeM0/AS1A13_093T12_9000006118_45672cztM0_level2.fits | modeM0/AS1A13_093T12_9000006118_45672cztM0_level2_quad_clean.evt |
| Size (bytes) | 449,539,200 | 109,408,320 |
| Size | 428.7 MB | 104.3 MB |
| Events in quadrant A | 5,816,074 | 720,853 |
| Events in quadrant B | 3,349,746 | 744,250 |
| Events in quadrant C | 2,990,532 | 726,733 |
| Events in quadrant D | 3,949,450 | 641,163 |
| Mode M0 | |||
|---|---|---|---|
| Quadrant | BADHDUFLAG | Total packets | Discarded packets |
| A | 0 | 22066 | 2 |
| B | 0 | 14834 | 2 |
| C | 0 | 14176 | 2 |
| D | 0 | 16688 | 3 |
| Mode SS | |||
|---|---|---|---|
| Quadrant | BADHDUFLAG | Total packets | Discarded packets |
| A | 0 | 140 | 0 |
| B | 0 | 140 | 0 |
| C | 0 | 140 | 0 |
| D | 0 | 140 | 0 |
| Mode M9 | |||
|---|---|---|---|
| Quadrant | BADHDUFLAG | Total packets | Discarded packets |
| A | 0 | 12 | 0 |
| B | 0 | 13 | 0 |
| C | 0 | 13 | 0 |
| D | 0 | 13 | 0 |
| Quadrant | Total seconds | Saturated seconds | Saturation percentage |
|---|---|---|---|
| A | 6883 | 135 | 1.961354% |
| B | 6883 | 103 | 1.496441% |
| C | 6883 | 14 | 0.203400% |
| D | 6882 | 252 | 3.661726% |
Noise dominated data is calculated using 1-second bins in cleaned event files. If a bin has >2000 counts, and if more than 50% of those come from <1% of pixels, then it is considered to be noise-dominated and hence unusable.
| Quadrant | # 1 sec bins | Bins with >0 counts | Bins with >2000 counts | High rate bins dominated by noise | Noise dominated (total time) | Noise dominated (detector-on time) | Marked lightcurve |
|---|---|---|---|---|---|---|---|
| A | 7783 | 6883 | 12 | 12 | 0.15% | 0.17% | 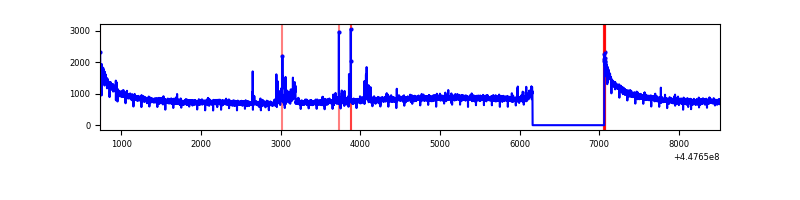 |
| B | 7783 | 6884 | 51 | 51 | 0.66% | 0.74% | 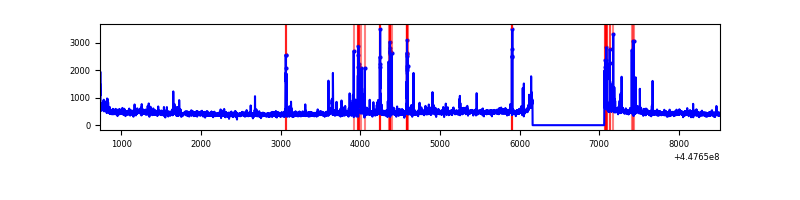 |
| C | 7783 | 6884 | 12 | 12 | 0.15% | 0.17% |  |
| D | 7782 | 6883 | 229 | 229 | 2.94% | 3.33% | 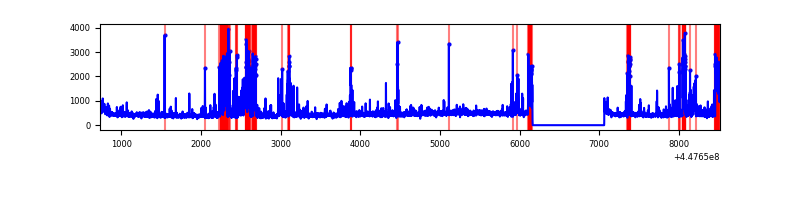 |
Top three noisy pixels from each quadrant. If the there are fewer than three noisy pixels in the level2.evt file, extra rows are filled as -1
| Pixel properties | Quadrant properties | ||||||
|---|---|---|---|---|---|---|---|
| Quadrant | DetID | PixID | Counts | Sigma | Mean | Median | Sigma |
| A | 10 | 83 | 2845679 | 18441.92 | 740 | 721 | 154.3 |
| A | 2 | 79 | 61616 | 394.74 | 740 | 721 | 154.3 |
| A | 13 | 248 | 40531 | 258.06 | 740 | 721 | 154.3 |
| B | 5 | 172 | 192274 | 1318.45 | 740 | 718 | 145.3 |
| B | 5 | 255 | 35964 | 242.59 | 740 | 718 | 145.3 |
| B | 0 | 183 | 29844 | 200.47 | 740 | 718 | 145.3 |
| C | 14 | 254 | 139159 | 808.36 | 729 | 732 | 171.2 |
| C | 13 | 61 | 4984 | 24.83 | 729 | 732 | 171.2 |
| C | 3 | 233 | 4482 | 21.9 | 729 | 732 | 171.2 |
| D | 13 | 249 | 811942 | 4464.97 | 716 | 690 | 181.7 |
| D | 2 | 249 | 132057 | 723.02 | 716 | 690 | 181.7 |
| D | 11 | 241 | 71997 | 392.46 | 716 | 690 | 181.7 |
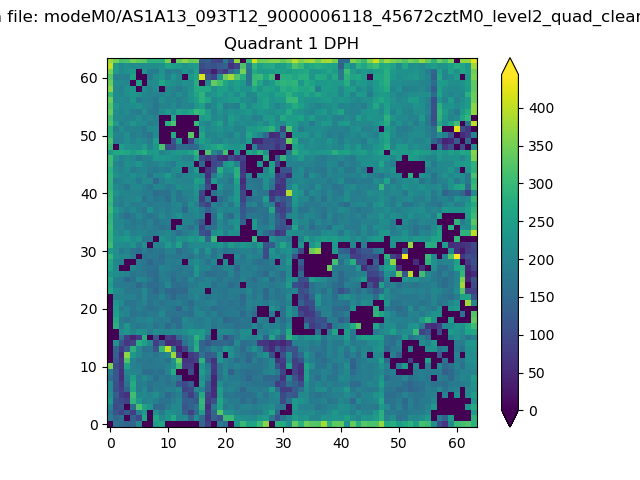
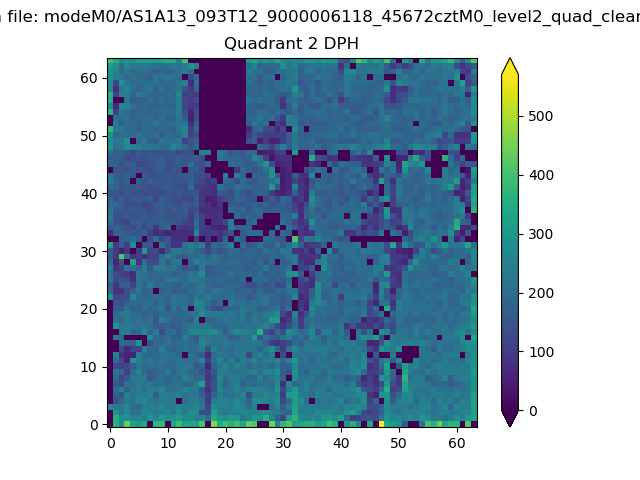
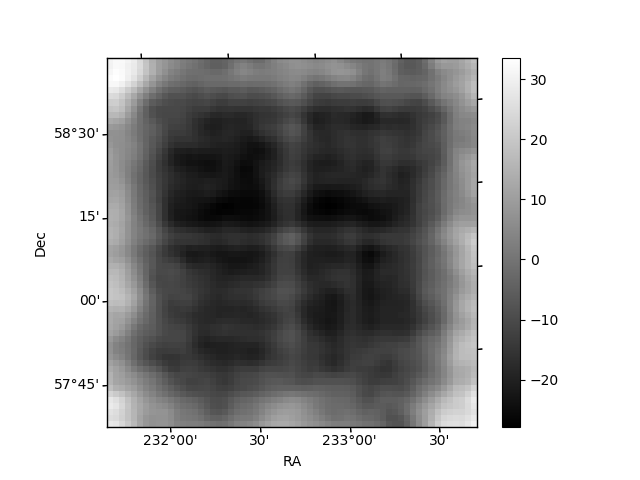
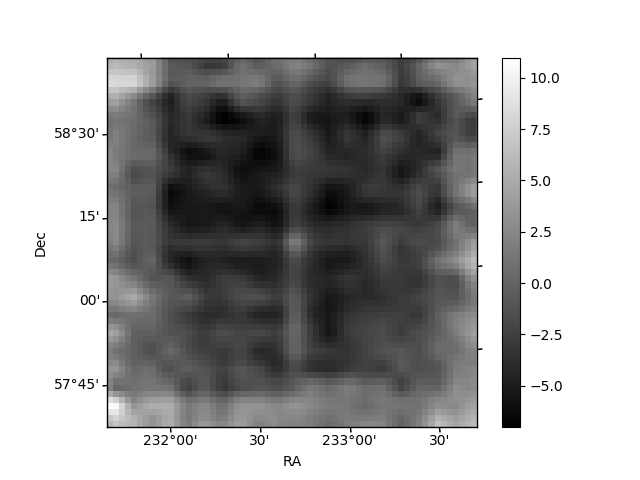
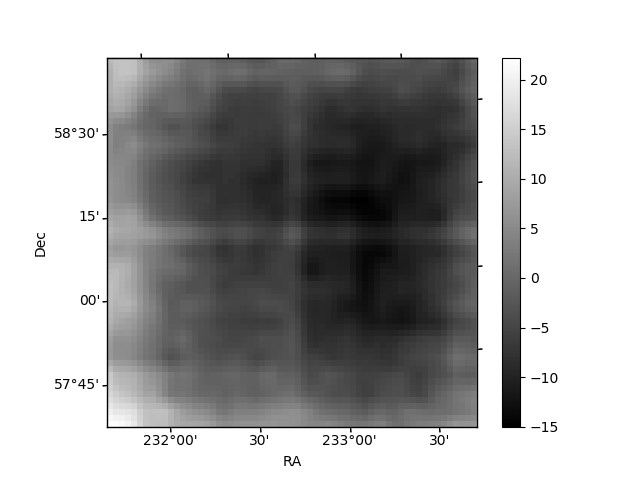
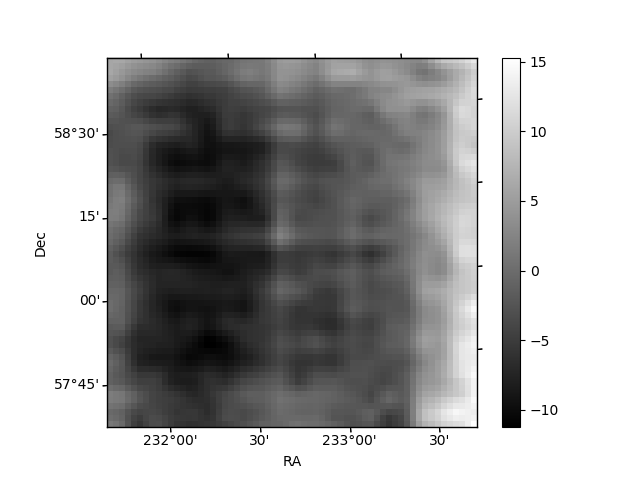
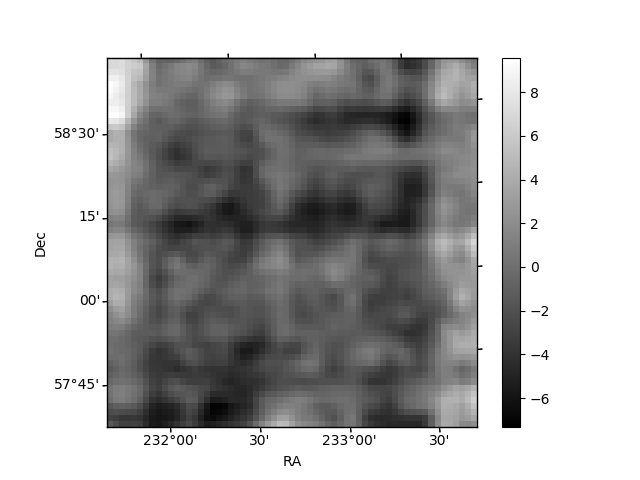
Histogram calculated using DETX and DETY for each event in the final _common_clean file
| Quadrant A | 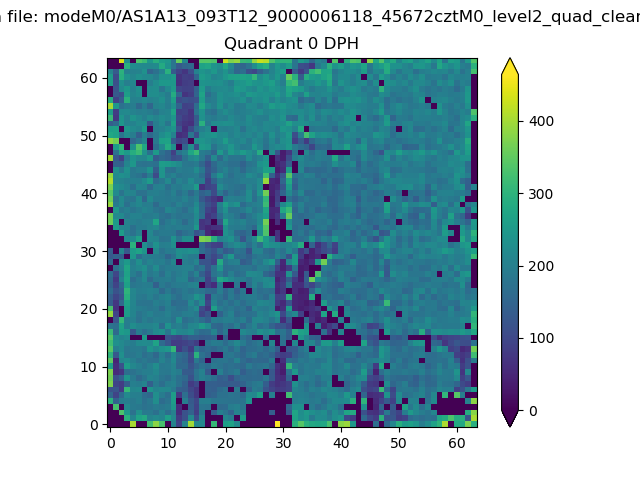 |
 |
Quadrant B |
|---|---|---|---|
| Quadrant D | 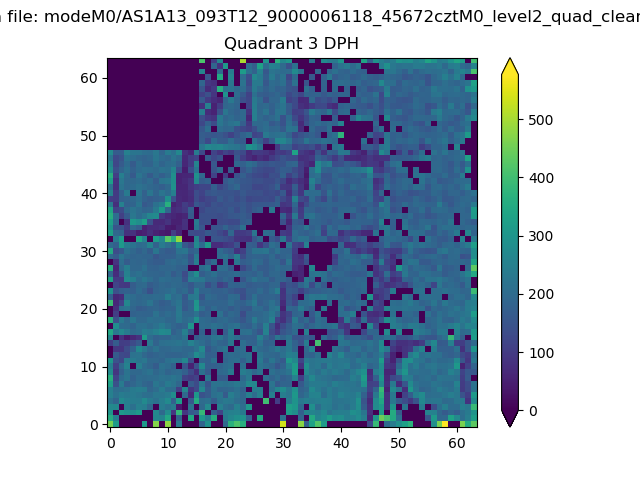 |
 |
Quadrant C |
| Plot type | Count rate plots | Images |
|---|---|---|
| Comparison with Poisson distribution Blue bars denote a histogram of data divided into 1 sec bins. Red curve is a Poisson curve with rate = median count rate of data. |
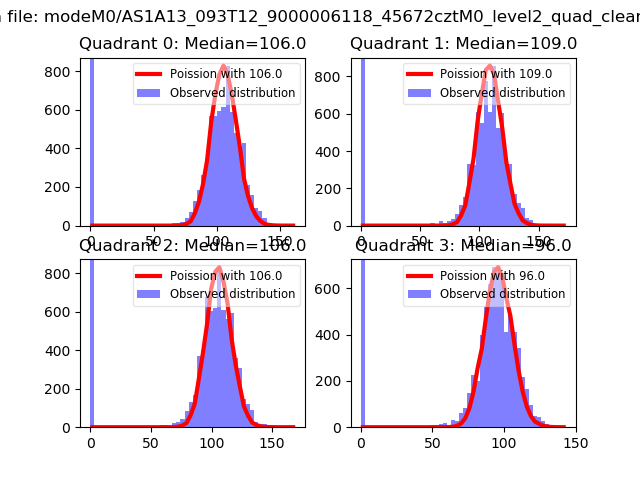 |
 |
| Quadrant-wise count rates Data is divided into 100 sec bins |
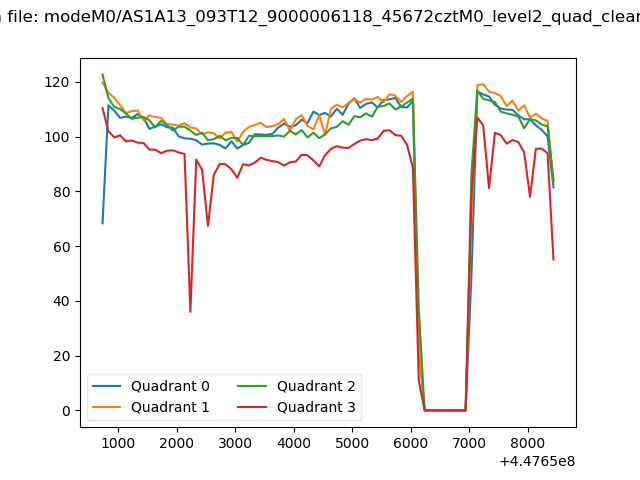 |
|
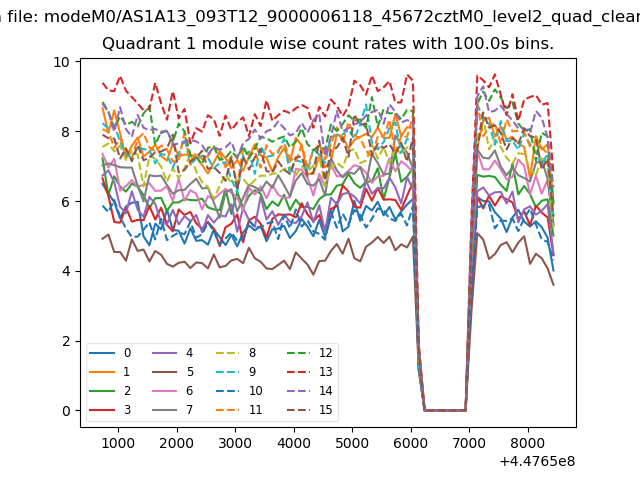
| Module-wise count rates for Quadrant A Data is divided into 100 sec bins |
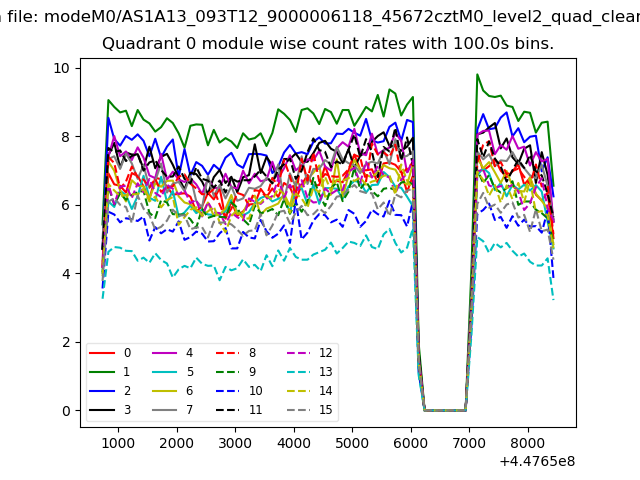 |
 |
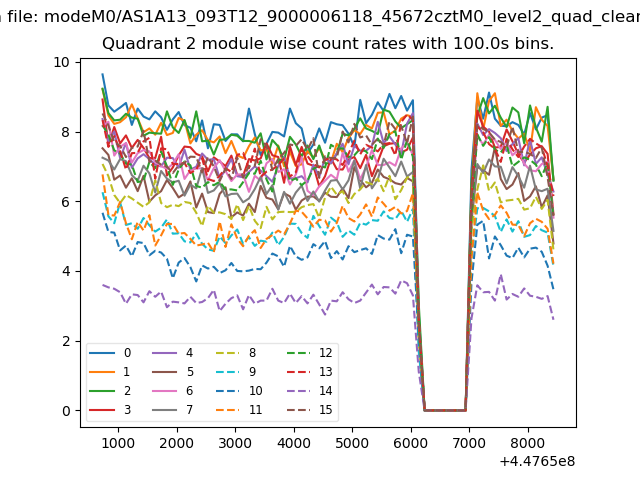
| Module-wise count rates for Quadrant B Data is divided into 100 sec bins |
 |
 |
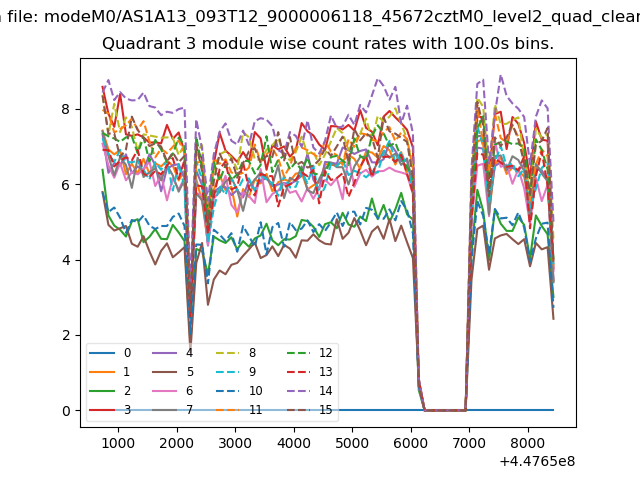
| Module-wise count rates for Quadrant C Data is divided into 100 sec bins |
 |
 |
| Module-wise count rates for Quadrant D Data is divided into 100 sec bins |
 |
 |
| Parameter | Plot |
|---|---|
| CZT HV Monitor |  |
| D_VDD | 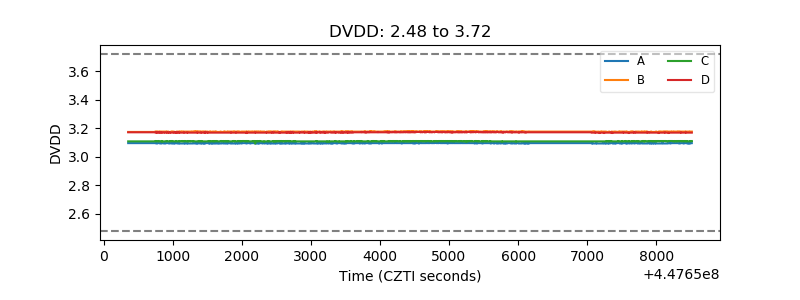 |
| Temperature 1 | 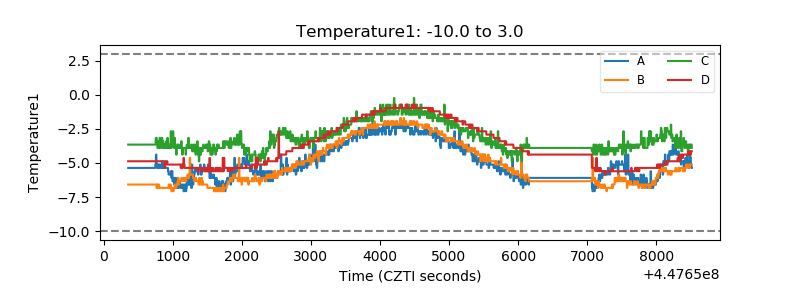 |
| Veto HV Monitor | 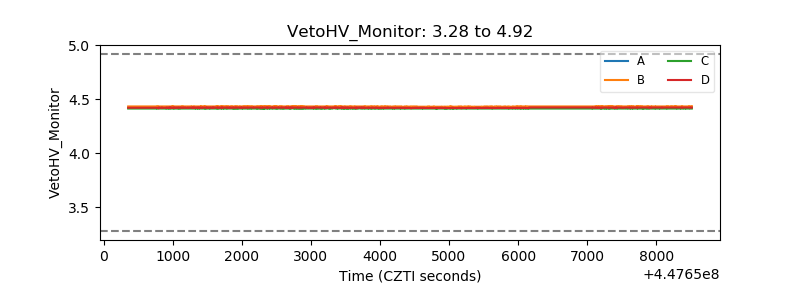 |
| Veto LLD | 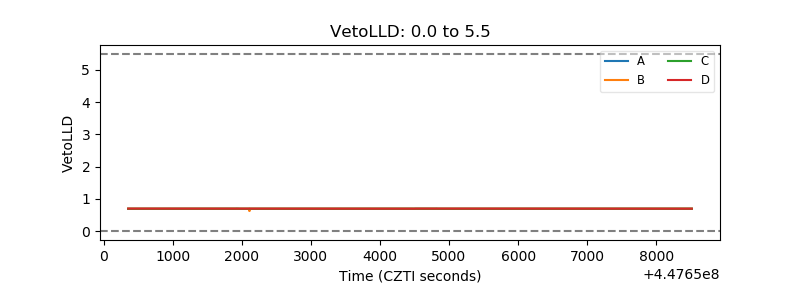 |
| Alpha Counter | 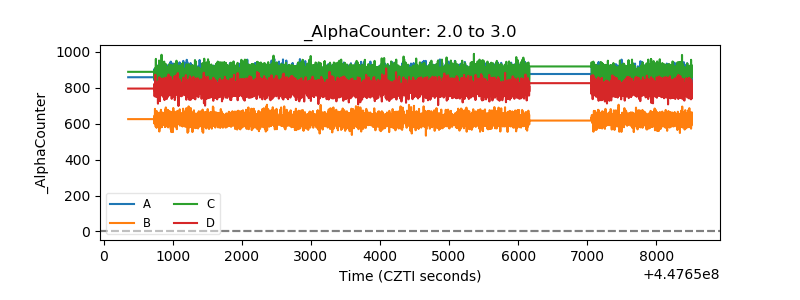 |
| _CPM_Rate | 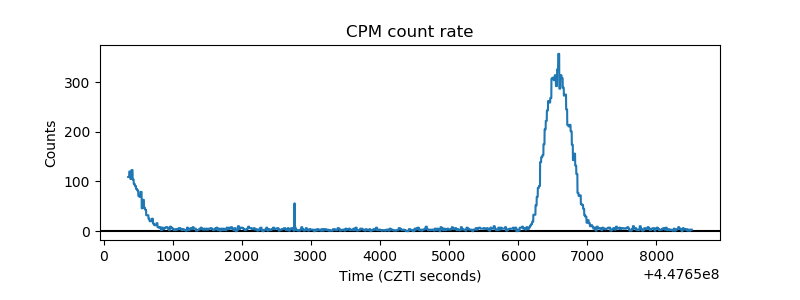 |
| CZT Counter | 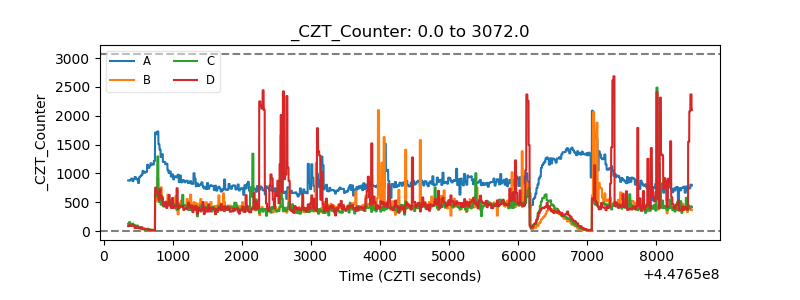 |
| +2.5 Volts monitor | 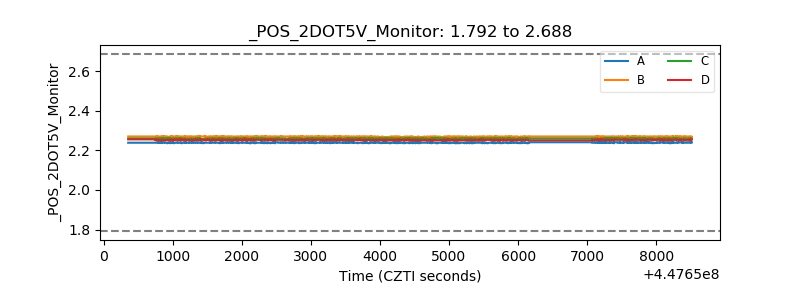 |
| +5 Volts monitor | 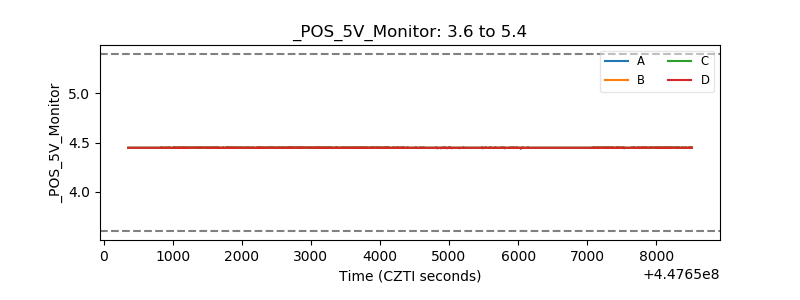 |
| _ROLL_ROT | 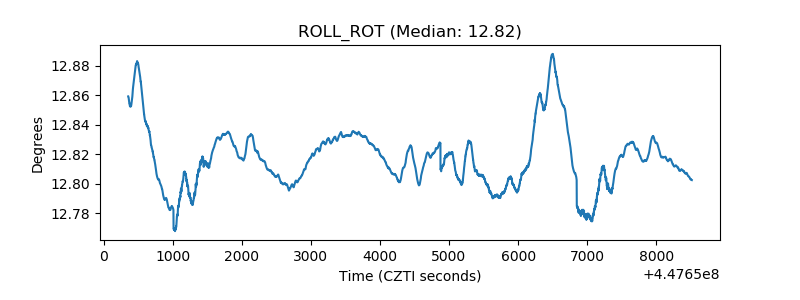 |
| _Roll_DEC | 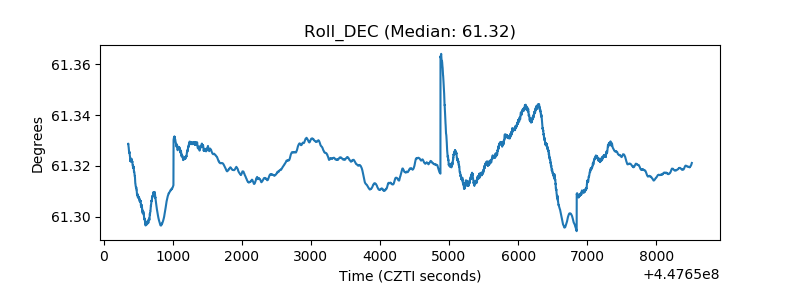 |
| _Roll_RA | 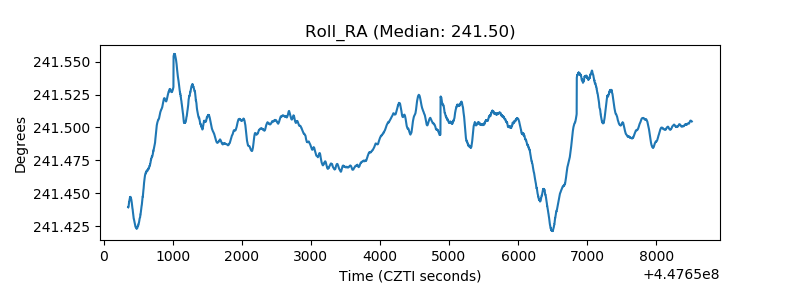 |
| Veto Counter | 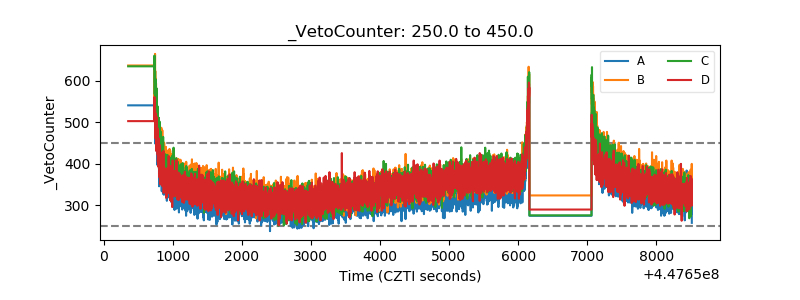 |