| Param | Original file | Final file |
|---|---|---|
| Filename | modeM0/AS1A13_093T12_9000006118_45674cztM0_level2.fits | modeM0/AS1A13_093T12_9000006118_45674cztM0_level2_quad_clean.evt |
| Size (bytes) | 428,978,880 | 97,439,040 |
| Size | 409.1 MB | 92.9 MB |
| Events in quadrant A | 5,096,366 | 650,524 |
| Events in quadrant B | 3,217,529 | 658,734 |
| Events in quadrant C | 3,087,161 | 646,783 |
| Events in quadrant D | 4,007,523 | 571,331 |
| Mode M0 | |||
|---|---|---|---|
| Quadrant | BADHDUFLAG | Total packets | Discarded packets |
| A | 0 | 19060 | 1 |
| B | 0 | 13775 | 1 |
| C | 0 | 13707 | 1 |
| D | 0 | 16145 | 1 |
| Mode SS | |||
|---|---|---|---|
| Quadrant | BADHDUFLAG | Total packets | Discarded packets |
| A | 0 | 122 | 0 |
| B | 0 | 122 | 0 |
| C | 0 | 122 | 0 |
| D | 0 | 122 | 0 |
| Mode M9 | |||
|---|---|---|---|
| Quadrant | BADHDUFLAG | Total packets | Discarded packets |
| A | 0 | 10 | 0 |
| B | 0 | 10 | 0 |
| C | 0 | 10 | 0 |
| D | 0 | 10 | 0 |
| Quadrant | Total seconds | Saturated seconds | Saturation percentage |
|---|---|---|---|
| A | 6060 | 109 | 1.798680% |
| B | 6061 | 201 | 3.316284% |
| C | 6061 | 74 | 1.220921% |
| D | 6061 | 287 | 4.735192% |
Noise dominated data is calculated using 1-second bins in cleaned event files. If a bin has >2000 counts, and if more than 50% of those come from <1% of pixels, then it is considered to be noise-dominated and hence unusable.
| Quadrant | # 1 sec bins | Bins with >0 counts | Bins with >2000 counts | High rate bins dominated by noise | Noise dominated (total time) | Noise dominated (detector-on time) | Marked lightcurve |
|---|---|---|---|---|---|---|---|
| A | 7060 | 6060 | 2 | 2 | 0.03% | 0.03% | 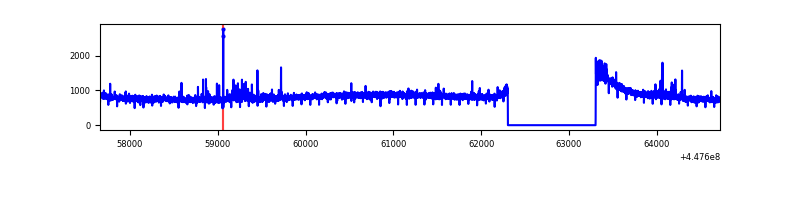 |
| B | 7061 | 6061 | 131 | 131 | 1.86% | 2.16% | 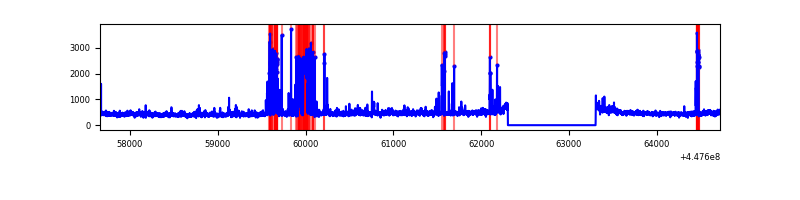 |
| C | 7061 | 6062 | 60 | 60 | 0.85% | 0.99% | 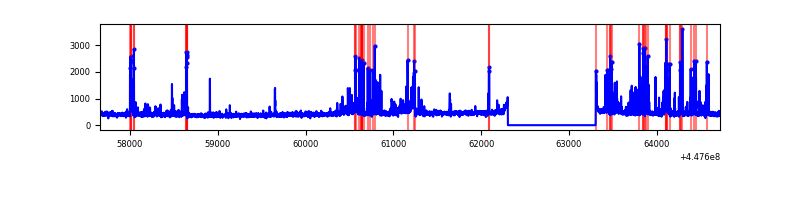 |
| D | 7061 | 6062 | 264 | 264 | 3.74% | 4.35% | 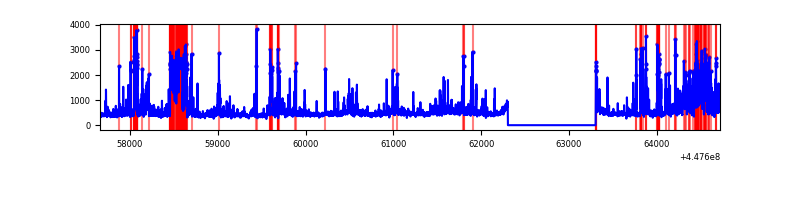 |
Top three noisy pixels from each quadrant. If the there are fewer than three noisy pixels in the level2.evt file, extra rows are filled as -1
| Pixel properties | Quadrant properties | ||||||
|---|---|---|---|---|---|---|---|
| Quadrant | DetID | PixID | Counts | Sigma | Mean | Median | Sigma |
| A | 10 | 83 | 2461147 | 17975.18 | 661 | 648 | 136.9 |
| A | 13 | 248 | 49184 | 354.58 | 661 | 648 | 136.9 |
| A | 14 | 235 | 25114 | 178.74 | 661 | 648 | 136.9 |
| B | 5 | 172 | 443353 | 3447.04 | 653 | 635 | 128.4 |
| B | 0 | 155 | 43096 | 330.6 | 653 | 635 | 128.4 |
| B | 0 | 189 | 34370 | 262.66 | 653 | 635 | 128.4 |
| C | 14 | 254 | 481774 | 3188.29 | 644 | 648 | 150.9 |
| C | 1 | 3 | 75539 | 496.28 | 644 | 648 | 150.9 |
| C | 12 | 2 | 9037 | 55.59 | 644 | 648 | 150.9 |
| D | 13 | 249 | 1186583 | 7335.14 | 636 | 615 | 161.7 |
| D | 1 | 52 | 184850 | 1139.48 | 636 | 615 | 161.7 |
| D | 2 | 249 | 95590 | 587.41 | 636 | 615 | 161.7 |
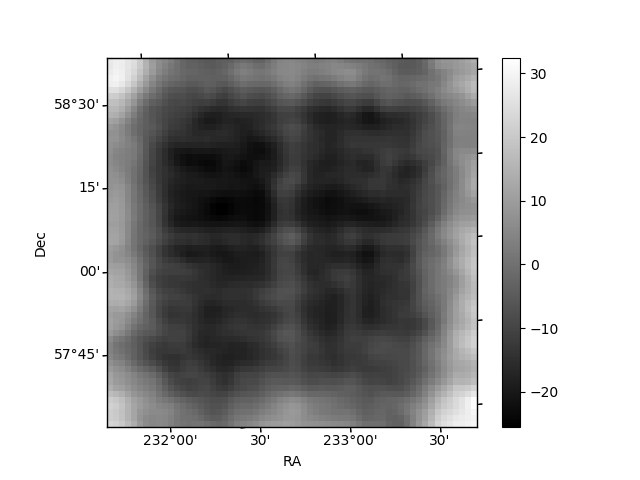
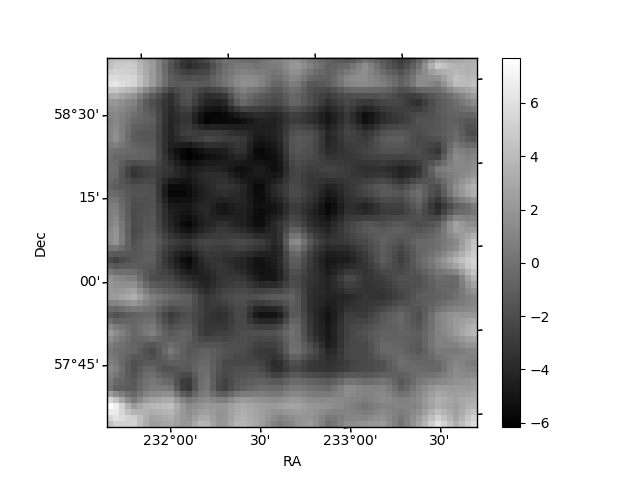
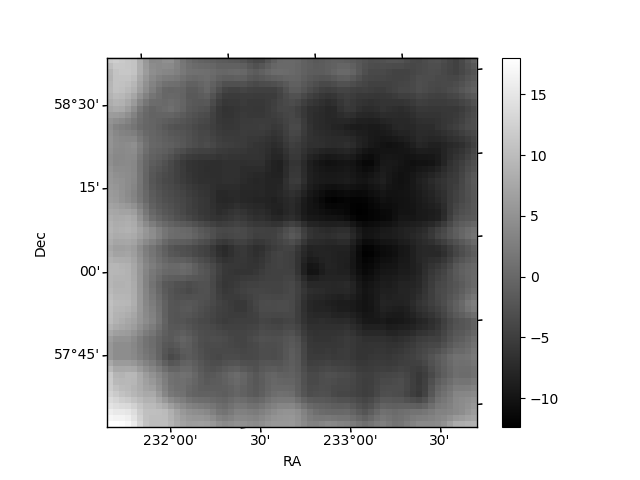
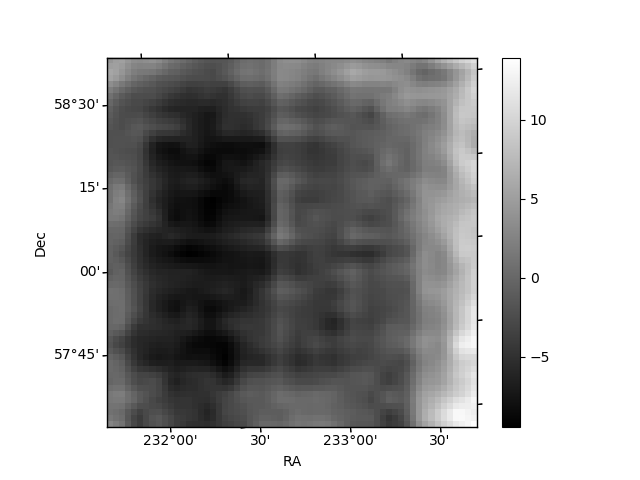
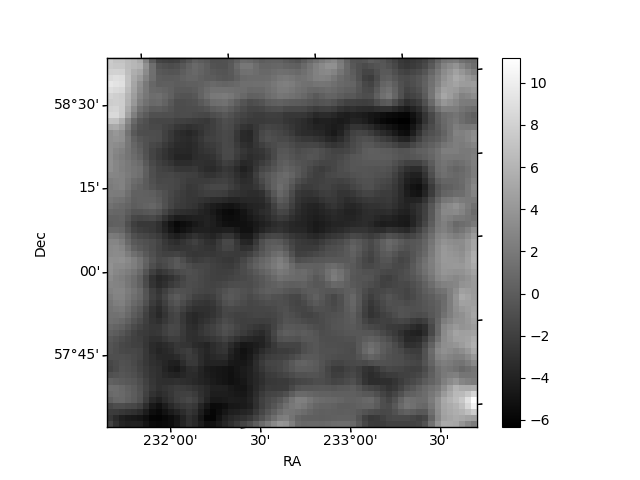
Histogram calculated using DETX and DETY for each event in the final _common_clean file
| Quadrant A | 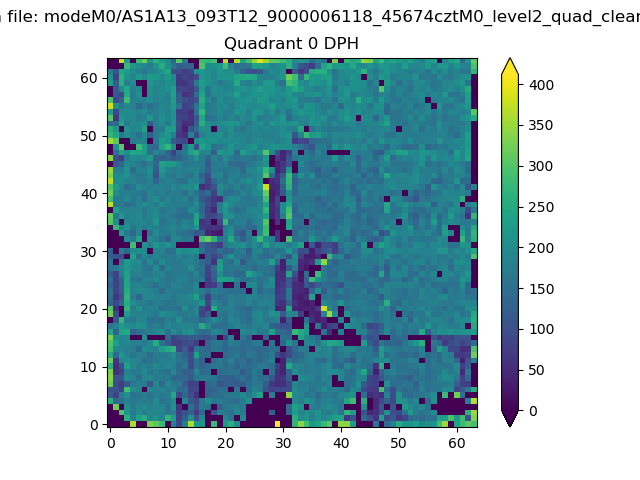 |
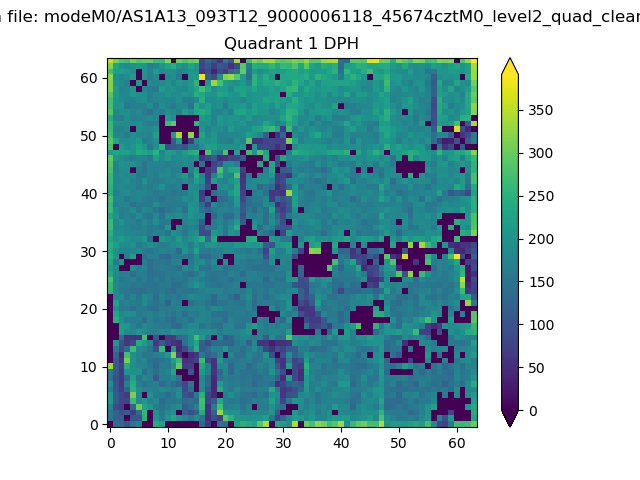 |
Quadrant B |
|---|---|---|---|
| Quadrant D | 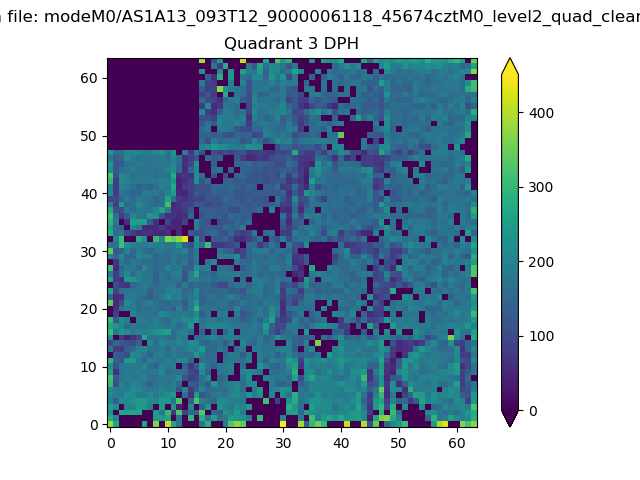 |
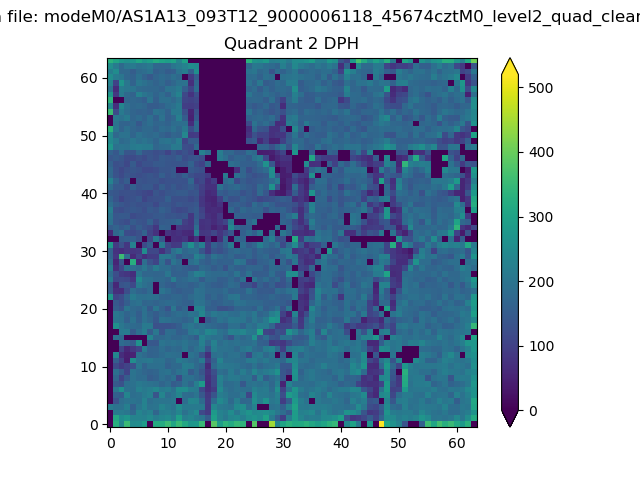 |
Quadrant C |
| Plot type | Count rate plots | Images |
|---|---|---|
| Comparison with Poisson distribution Blue bars denote a histogram of data divided into 1 sec bins. Red curve is a Poisson curve with rate = median count rate of data. |
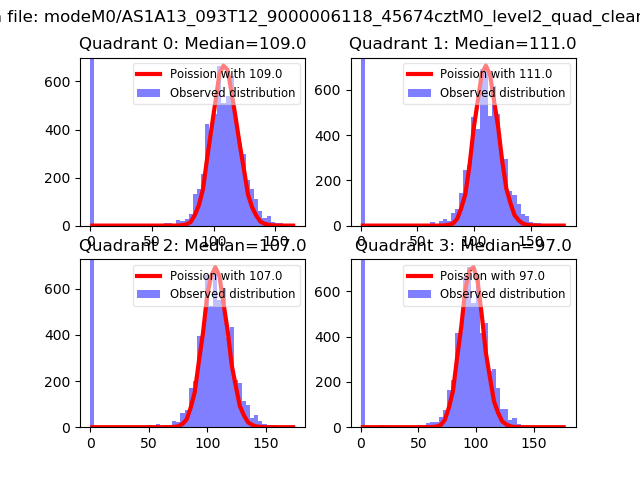 |
 |
| Quadrant-wise count rates Data is divided into 100 sec bins |
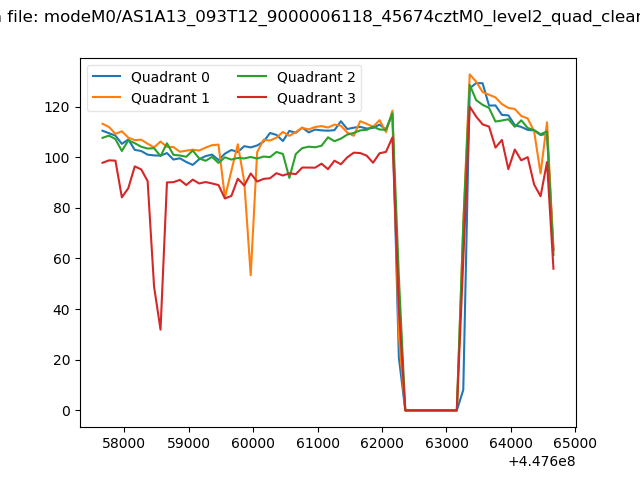 |
|
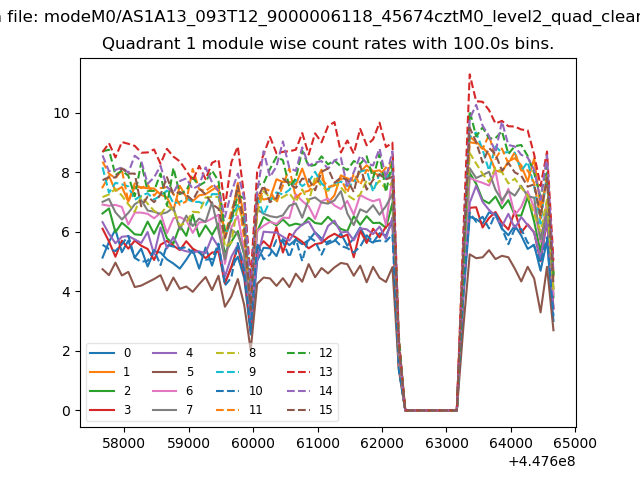
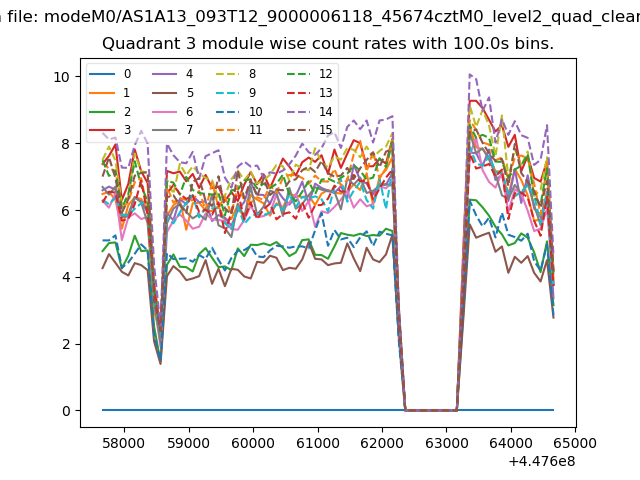
| Module-wise count rates for Quadrant A Data is divided into 100 sec bins |
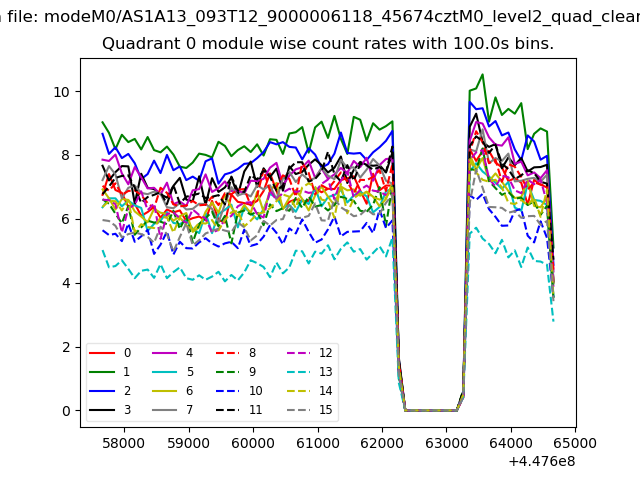 |
 |
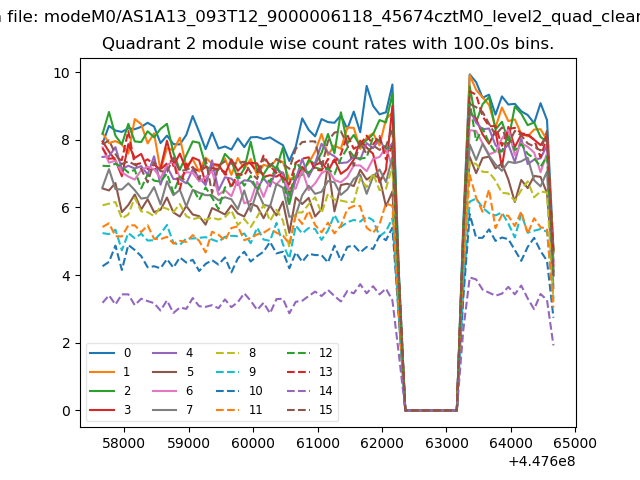
| Module-wise count rates for Quadrant B Data is divided into 100 sec bins |
 |
 |
| Module-wise count rates for Quadrant C Data is divided into 100 sec bins |
 |
 |
| Module-wise count rates for Quadrant D Data is divided into 100 sec bins |
 |
 |
| Parameter | Plot |
|---|---|
| CZT HV Monitor |  |
| D_VDD | 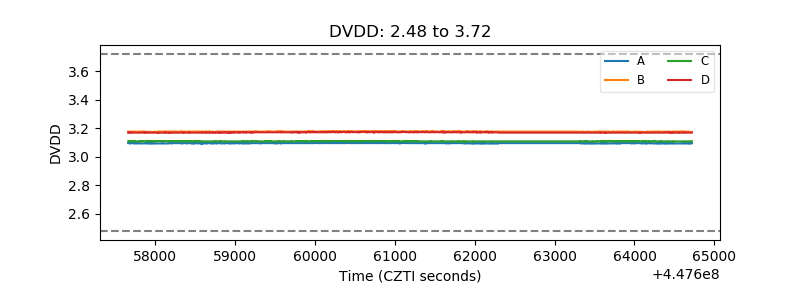 |
| Temperature 1 | 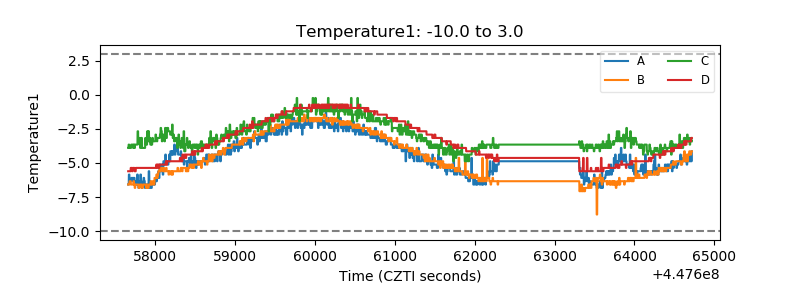 |
| Veto HV Monitor | 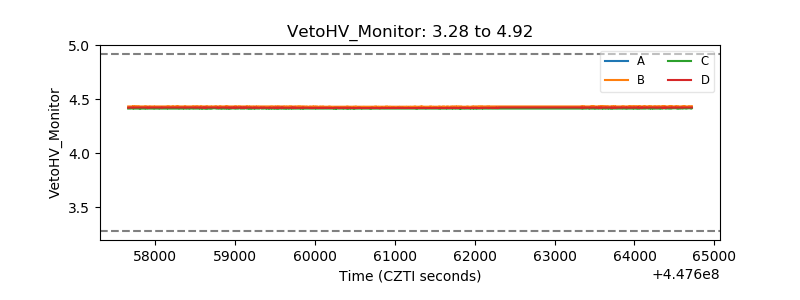 |
| Veto LLD | 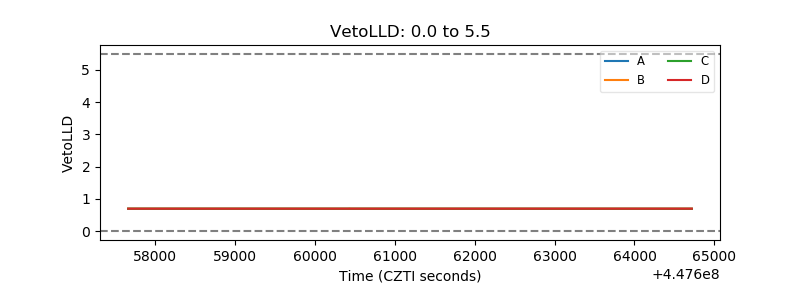 |
| Alpha Counter | 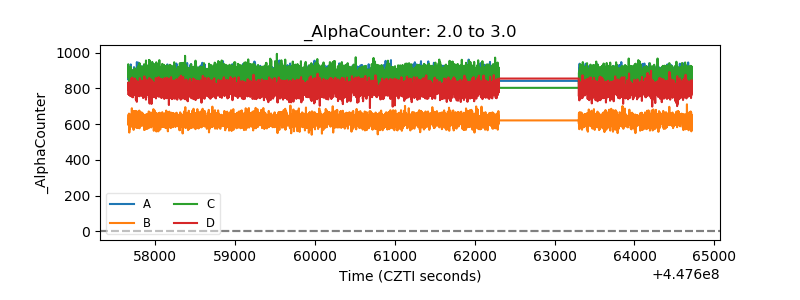 |
| _CPM_Rate | 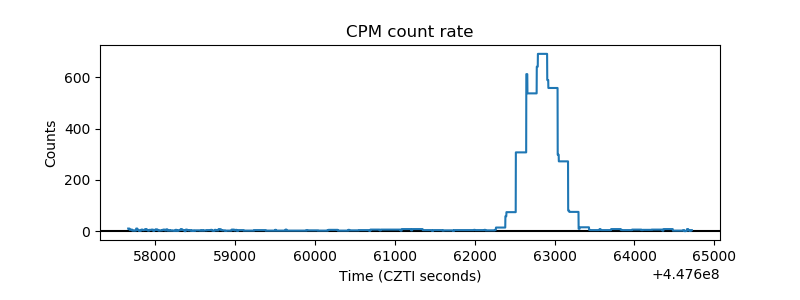 |
| CZT Counter | 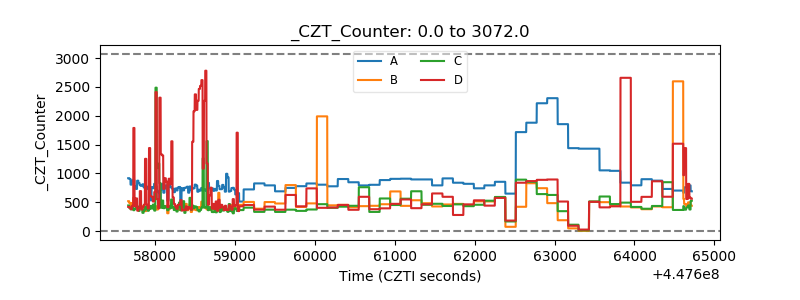 |
| +2.5 Volts monitor | 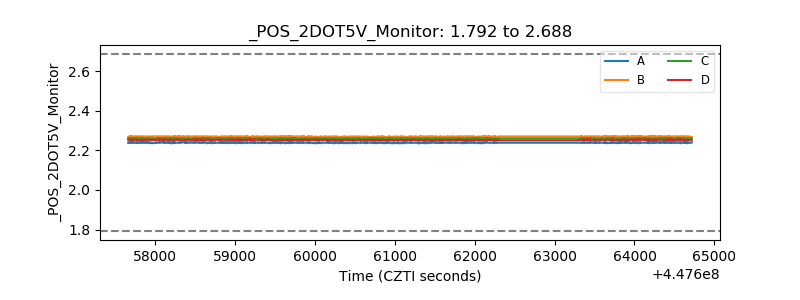 |
| +5 Volts monitor |  |
| _ROLL_ROT | 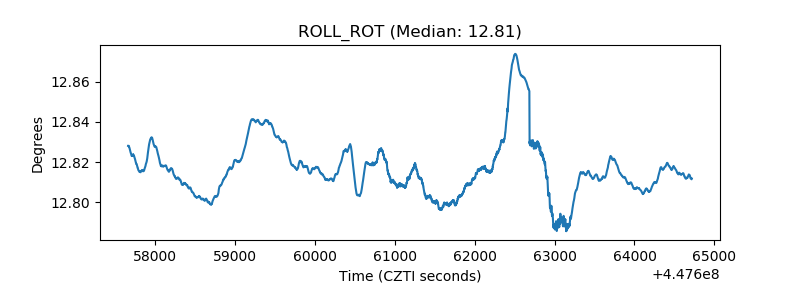 |
| _Roll_DEC | 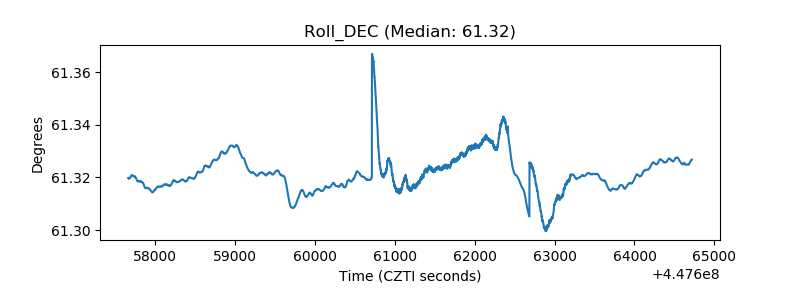 |
| _Roll_RA | 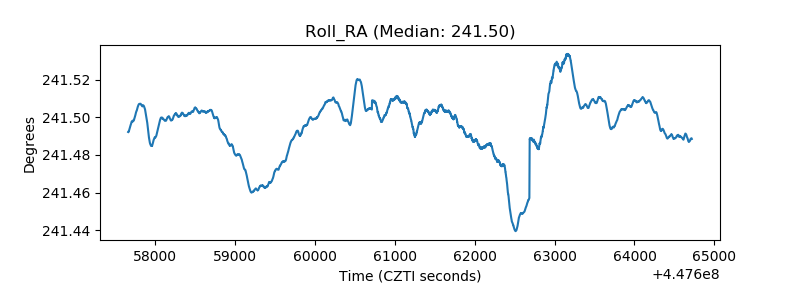 |
| Veto Counter | 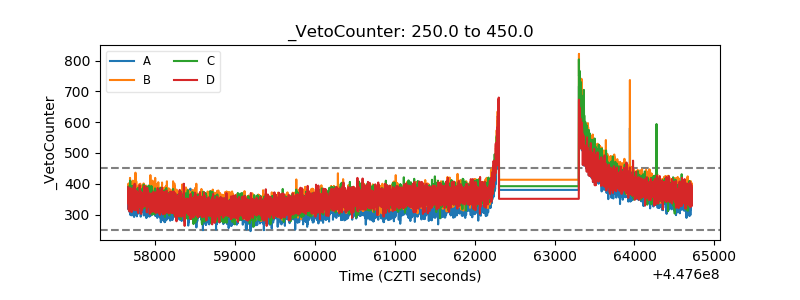 |